
ABSTRACT
Background
The incidence of gastric cancer (GC) ranks fourth among all malignant tumors worldwide, and the fatality rate ranks second among all malignant tumors. Several Chinese traditional medicines have been used in the treatment of advanced gastric cancer. This study aims to investigate the effect of combinational use of natural product cryptotanshinone (CTS) with anti-cancer drug trifluorothymidine (FTD) in GC.
Methods
Cell Counting Kit-8 assay was used to detect the inhibitory effect of the combinational or separate use of FTD and CTS on the growth of HGC-27 and AGS GC cells. The combined index of FTD and CTS was calculated using CompuSyn software. To understand the mechanism, we applied flow cytometry to study the cell cycle and cell apoptosis after treatment. We also investigated the amount of FTD incorporated into the DNA by immunofluorescence assay. The expression of relevant proteins was monitored using western blot. Furthermore, the effect of using TAS-102 in combination with CTS was studied in xenograft tumor nude mice model.
Results
FTD and CTS inhibited the growth of GC cells in a dose-dependent manner, respectively. They both exhibited low to sub-micromolar potency in HGC-27 and AGS cells. The combination of FTD and CTS showed synergistic anticancer effect in HGC-27 cells and AGS cells. Our mechanism studies indicate that FTD could block HGC-27 cells at G2/M phase, while CTS could block HGC-27 cells at G1/G0 phase, while FTD combined with CTS could mainly block HGC-27 cells at G2 phase. FTD in combination with CTS significantly increased the apoptosis of HGC-27 cells. We observed that CTS treatment increased the incorporation of FTD into the DNA HGC-27 cell. FTD treatment activated STAT3 phosphorylation in HGC-27 cells, while CTS treatment down-regulated the concentration of p-STAT3. Interestingly, the combination of CTS and FTD reduced STAT3 phosphorylation induced by FTD. In the in vivo experiments, we observed that the combination of TAS-102 with CTS was significantly more potent than TAS-102 on tumor growth inhibition.
Conclusions
FTD combined with CTS has a synergistic anti-gastric cancer effect as shown by in vitro and in vivo experiments, and the combined treatment of FTD and CTS will be a promising treatment option for advanced gastric cancer.
1. Introduction
Gastric cancer is one of malignant tumors with high morbidity and mortality in China [Citation1]. There are currently no specific and highly effective drugs that can prevent the development of gastric cancer [Citation2]. Currently, chemotherapy such as taxus, platinum and pentafluoride is the main way of multidisciplinary comprehensive treatment for advanced gastric cancer, and the chemotherapy regimen mainly includes taxus, platinum and pentafluoride, but the efficacy is not good and there are many adverse reactions after chemotherapy for gastric cancer [Citation3,Citation4].
The chemical structure of cryptotanshinone (CTS) is C19H20O3, and its relative molecular weight is 296.35. CTS is extracted from the root and rhizome of Salvia miltiorrhiza, and mainly exists in salvia and Sage [Citation5]. Many studies have shown that CTS has a wide range of pharmacological properties, including anti-tumor, anti-inflammatory, neuroprotective, cardiovascular protective, anti-fibrosis and anti-metabolic disorders [Citation6,Citation7]. CTS has also received increasing attention in recent years due to its anti-cancer activity. Previous experimental results of our group showed that CTS can effectively activate an apoptotic pathway and block gastric cancer cells in G0/G1 phase. Meanwhile, CTS, as a natural inhibitor of STAT3, can inhibit cell proliferation by inhibiting downstream protein of STAT3 [Citation8]. Studies have found that CTS can effectively improve the efficacy of doxorubicin, paclitaxel, arsenic trioxide and other anticancer drugs through the a process mediated by STAT3 signaling pathway [Citation9–11].
TAS-102 is a promising new antitumor agent that can be used in combination with other chemotherapy agents. TAS-102 is a combination of a novel oral nucleoside analogue trifluorothymidine (FTD) and thymine phosphorylase inhibitor tipilasi hydrochloride (TPI) with a molar ratio of 1:0.5 [Citation12]. FTD is an active cytotoxic component of TAS-102, and TPI plays a role in preventing FTD from being rapidly degraded and inactivated by thymine phosphorylase in vivo. FTD enters the body via nucleoside transporters and is phosphorylated sequentially by thymidylate kinase. Its monophosphate-phosphate form (FTD-MP) can temporarily inhibit thymic acid synthase (TS), and its triphosphate form (FTD-TP) can be inserted into DNA strands [Citation13]. TS inhibition is the main mechanism of classical fluoropyridines such as 5-FU [Citation14]. Although the inhibition of TS by FTD-MP may partially explain the anti-tumor effect of FTD, studies have shown that the incorporation of FTD-TP into the DNA chain and resulting in DNA damage is the main mechanism of FTD [Citation15]. It is noteworthy that FTD is one of the few chemotherapy agents that can promote STAT3 phosphorylation in the treatment of advanced tumors [Citation16].
The purpose of this study is to evaluate the efficacy and potential mechanism of FTD alone or in combination with CTS in the treatment of gastric cancer in vitro and in vivo. We studied the effect of combination of FTD and CTS through investigating its influence on cell proliferation pathways through cell cycle, apoptosis and the incorporation of FTD into DNA strands.
2. Materials and Methods
2.1. Cell culture and reagents
Human gastric cancer cell lines HGC-27 and AGS were purchased from Procell Life Science and Technology Ltd. Gastric cancer cells HGC-27 and AGS were cultured in Dulbecco's modified Eagle's medium (DMEM) and RPMI 1640, respectively, supplemented with 10% fetal bovine serum (FBS) and 1% penicillin–streptomycin solution in a 37°C cell incubator with 5% CO2.
DMEM and RPMI 1640 medium were purchased from HyClone (USA). TAS-102, FTD and CTS were obtained from TargetMol (China), and their purity was greater than 98%. Cell Counting Kit (CCK)-8 and cell cycle analysis kit were obtained from Beyotime (China), and Annexin V-FITC/PI double staining cell apoptosis detection kit was purchased from KeyGEN BioTHCE (China). Primary antibodies included BrdU, Cyclin B1, Cyclin D1, Caspase 3, Caspase 9, Bcl-2, Survivin, phospho-extracellular signal-regulated kinase (p-ERK) (Thr202/Tyr204) and ERK, p-AKT (Ser473) and AKT, p-STAT3 (Tyr705) and STAT3 (Cell Signaling Technology), p-JAK2 (Tyr221) and JAK2, GAPDH, β-actin (Affinity), MPM-2 (Abcam), IL-6 and Ki-67 (Wanleibio). Secondary antibodies horseradish peroxidase (HRP)-conjugated goat anti-rabbit/mouse IgG and Cy3 labeled goat anti-mouse IgG were from ZSGB-Bio (China) and Abclonal (China), respectively.
2.2. Cell proliferation assay
Cell proliferation capacity of FTD, CTS and their combination was determined using CCK-8 assay according to the manufacturer’s protocol. Firstly, HGC-27 cells and AGS cells at exponential growth stage were planted in 96-well plates at a density of 2 × 10³ cells/well. Then, different concentration gradients of dimethyl sulfoxide (DMSO; 0.125, 0.25, 0.5, 1, 2, 4, 8 and 16 μM), FTD (1, 2, 4 and 8 μM), CTS and their combination were added to the culture media after the cells adhered to the wall, and the cells were further cultured for another 48 h in an environment treated with different concentrations of drugs. Finally, 10 µl CCK8 reagent was added to each well and incubated while keeping it away from light at 37°C for 1–2 h. Optical density value at a wavelength of 450 nm was measured using a universal microplate reader (Biotek). Each assay was carried out two or three times.
2.3. Wound-healing assay and transwell invasion assay
Five uniform horizontal lines were drawn on the back of a 6-well plate with a marker pen. After treatment with 8 µM CTS or 0.5 μM FTD alone and in combination for 24 h, a spear was used to scratch along a ruler perpendicular to the horizontal line and then washed three times with phosphate-buffered saline (PBS) and replaced with serum-free medium the next day. Images were obtained at 0, 12 and 24 h through an inverted microscope (Zeiss, Germany). Magnification, ×100. Invasion assay was performed using 24-well transwell plates coated with matrigel. After treatment with the drug at the above concentration for 24 h, the cells were collected and prepared into a single-cell suspension. HGC-27 cells (100 µl; 1 × 10⁵ cells) were plated in the upper transwell chamber in DMEM medium without FBS. DMEM medium (600 µl) supplemented with 10% FBS was placed in the lower chambers. The cells were cultured in a 37°C incubator for 24 h. The cells traveled through the matrixgel to the lower surface, and then they were fixed and stained with crystal violet. Images were captured using an inverted microscope.
2.4. Cell cycle analysis
HGC-27 cells (1 × 10⁵ cells/well) were seed in 6-well plates and starved overnight. The cells were treated with constant concentration of CTS (8 µM) and different doses of FTD (0.25 and 0.5 μM) alone or their combination (CTS 8 µM+ FTD 0.25 or 0.5 µM) for 72 h. The cells were harvested and converted into a single-cell suspension. The cells were then washed three times with cold PBS and then fixed with 70% cold ethanol at 4°C overnight. Then, cells were centrifuged and resuspended in PBS. RNaseA and propidium iodide (PI) were added and incubated for 30 min at 37°C. Flow cytometric analysis was carried out within 30 min by using CytoFLEX flow cytometry (Beckman, USA), and frequency results for different stages of the cell cycle were determined with FlowJo software (v. 7.6.1). DMSO group was used as a control group. Each experiment was performed two or three times.
2.5. Cell apoptosis analysis
Apoptotic cells were analyzed by using Annexin V-FITC/PI double-staining cell apoptosis detection kit. HGC-27 cells were seeded at a density of 1 × 10⁵ cells/well in 6-well culture plates. The cells were treated with an indicated concentration of FTD or/and CTS for 48 h until they grew with adherence. The cells were digested with trypsin without EDTA, collected and then washed twice with PBS. Annexin V-FITC (5 µl) and PI (5 µl) were subsequently added to the cell suspension. After mixing, the cells were kept at room temperature and protected from light for 15 min. A CytoFLEX flow cytometer (Beckman, USA) was used for analysis. The percentage of apoptotic cells was determined using FlowJo software.
2.6. Immunofluorescence assay
HGC-27 cell (1 × 10⁵ cells) was evenly seeded on coverslips. The cells were treated with drugs for 24 h, fixed with 4% formaldehyde for 15 min and then washed with PBS for three times. TritonX-100 (0.1%) was dropped to completely cover the cells, incubated at room temperature for 30 min and washed three times with PBS. Cells were then blocked in 5% goat serum at room temperature for 1 h. BrdU primary antibody was diluted with PBS at 1:500 and incubated overnight at 4°C. The next day, after washing three times with PBS, these cells were incubated with Cy3-conjugated secondary antibody (1:100 dilution) for 1 h at room temperature in darkness. Cell nuclei were stained with DAPI for 10 min. The cells were then washed as before, and the plate was sealed with an anti-fluorescence quenching agent. Finally, images were observed under an inverted fluorescence microscope (×400).
2.7. Western blotting
Western blotting was performed as described previously [Citation17]. In short, after drug treatment for 24 h, total proteins were extracted by RIPA lysis buffer supplemented with protease and phosphatase inhibitors. Protein concentrations were subjected to BCA protein assay kit according to the manufacturer’s protocol. Equal amounts of total protein (40 µg) were uploaded to 10% sodium dodecyl–sulfate polyacrylamide gel electrophoresis and then transferred to polyvinylidene fluoride membranes. The membranes were blocked with 5% skim milk at 37°C for 2 h. The protein we are interested in on the membrane is cut horizontally along the position suggested by prestained marker, and subsequently incubated with a specific primary antibody at 4°C overnight. GAPDH or β-actin served as an internal control in this study. The next day, the membranes were washed three times with TBST (Tris-buffered saline and 0.1% Tween-20) and then incubated at room temperature for 1 h with a corresponding secondary antibody. Each band was examined by adding chemiluminescence (Thermo Scientific) to the membrane, and results were captured using a gel imaging system (Tanon 5200).
2.8. Hematoxylin–eosin (HE) staining
After treatment, a part of the liver and kidney tissues of nude mice were collected, fixed with formaldehyde, dehydrated and then embedded in paraffin. After cooling, the tissues were cut into 5-µm-thick sections. The sections were then dewaxed with xylene and hydrated with gradient ethanol. The sections were stained with hematoxylin for 5 min, followed by eosin for 3 min, and then washed with running water for 10 min. The slices were dehydrated and sealed with neutral resin. Finally, a positive light microscope (×200) was used to observe images on the slides.
2.9. Immunohistochemistry
The tumor and liver and kidney tissues of nude mice were fixed, embedded in paraffin and sectioned into 5-μm-thick sections. The sections were then dewaxed with xylene and hydrated with gradient ethanol. Antigen retrieval was performed with a citrate antigen retrieval solution at 100°C for 10 min. An immunohistochemical pen was used to draw a circle around the tissue and incubated at room temperature with 3% H2O2 for 15 min to eliminate endogenous peroxidase activity and then soaked in PBS for 5 min and repeated for three times. After incubation with goat serum at room temperature for 1 h, the primary antibody was diluted with PBS at 1:100, and then dropped until the tissue was completely covered. The antibody was kept in a wet box at 4°C overnight. The next day, the antibody was soaked again by PBS for three times (for 5 min each time), and the HRP-conjugated secondary antibody was dropped to completely cover the tissue and incubated in a wet box at 37°C for 60 min, followed by soaking in PBS for 5 min, and repeated for three times. DAB chromogenic agent was applied to the section and was put into water to stop the reaction when the color became dark. After staining the cells with hematoxylin, the sections were dehydrated and sealed with a neutral resin. Images were observed under a positive microscope (×400).
2.10. Nude mice xenograft tumor model of human HGC-27
BALB/c female nude mice, weighing 18–20 g and aged 5 weeks, were purchased from Wanlei Biotechnology Co., Ltd. All animal experiments were conducted in agreement with the Committee of Animal Experimentation and the Ethic Committee of Anhui Medical University (Anhui, China). These nude mice were kept in a specific pathogen-free environment with 12 h light/dark cycle, 22 ± 1°C temperature and 45–55% humidity, with free access to food and water. After adaptive feeding for 1 week, 100 µl cell suspension of HGC-27 cells was injected into the axilla of the nude mice with a density of 4 × 10⁷ cells/ml. All nude mice were randomly divided into three groups: control group (DMSO), TAS-102 treatment group (TAS-102) and combined treatment group (TAS-102+CTS), and each group was assigned three nude mice. The control group was injected with an equal dose of DMSO every 2 days. The TAS-102 treatment group was given TAS-102 orally twice daily (each time 75 mg/kg), with an interval of 6 h. In the combined treatment group, TAS-102 was given orally twice daily, at a 6-h interval, and CTS was injected intraperitoneally every 2 days (10 mg/kg). Tumor volume (V) was measured every 3 days and calculated according to a formula V = 0.5 × L × S2. After 14 days of drug treatment, the nude mice were sacrificed routinely, and their kidney, liver and tumor tissues were collected for follow-up experiments.
2.11. Statistical analysis
Combination index (CI) determined by Chou–Talalay method could be used as an indicator to measure drug interactions [Citation18]. CI < 1 was classified as synergy, CI = 1 was classified as additive, while CI > 1 was interpreted as antagonism. CI value was calculated by CompuSyn software (V. 2.0). In addition, fa represents fraction of cells affected, and dose-reduction index (DRI) means the fold-decrease of each single agent when two and three drugs were used in combination. GraphPad Prism 6.0 software was used to calculate IC50 values and plot statistical graphs. All data were presented as mean ± SD. The difference between the two groups was compared using the Student’s t-test. P < 0.05 was considered to be statistically significant.
3. Result
3.1. The combination of FTD and CTS has a synergistic anticancer effect on gastric cancer cells
CTS, one of the natural products extracted from Salvia miltiorrhiza, has been newly discovered as an anti-cancer drug (Supplementary Fig. S1). To investigate an anti-proliferative activity of FTD and CTS, human gastric cancer cells were treated with different concentrations of each drugs for 72 h. FTD and CTS significantly inhibited the proliferation of two gastric cancer cells in a dose-dependent manner. The IC50 values of CTS for HGC-27 and AGS cells were 10.68 and 5.43 µmol/L (), respectively, and the IC50 values of FTD for them were 0.87 and 2.36 µmol/L (), respectively. A drug concentration close to IC50 was selected as a subsequent experimental concentration. In addition, in order to further analyze the effects of the combination of the two drugs on gastric cancer cells, we also analyzed the effects of 2, 4 and 8 µmol/L CTS combined with different concentrations of FTD on HGC-27 cells and 1, 2 and 4 µmol/L CTS combined with different concentrations of FTD on AGS cells (). Our results reveal that combination of FTD and CTS was a more pronounced decrease compared with FTD alone in cell viability. The CI of FTD and CTS on gastric cancer cells was assessed using CompuSyn software. When the Fa (fraction of cells affected) was 50%, the concentration of FTD alone was more than three times that of the combination in HGC-27 cell. FTD and CTS are synergistic in HGC-27 cell, with CI values ranging from 0.566 to 0.878 for Fa = 0.1 ~ 0.75, as indicated by and Fa–CI plot (). Similarly, when the Fa of AGS cells was less than 95%, the CI value of FTD and CTS was less than 1 ( and ), indicating that FTD and CTS also had a synergistic effect in AGS cells. In particular, HGC-27 cells had a highly sensitive response to FTD. Hence, HGC-27 cells were chosen for further study. Moreover, we explored the biological role of FTD and its combination in HGC-27 cells. Compared with the control group, both FTD and CTS could inhibit the migration and invasion ability of HGC-27 cells, and more importantly, the inhibitory effect was more obvious when FTD was combined with CTS (Supplementary Fig. S2 and Supplementary Fig. S3). Overall, our results indicate that FTD and CST have synergistic anti-gastric cancer effects in vitro.
Figure 1. Antiproliferative effect of FTD combination with CTS on gastric cancer cells. Effect of CTS-alone treatment for 72 h on cell viability of HGC-27 (a) and AGS (b) cells. Cell viability of HGC-27 cells (c) after cotreatment with (0, 2, 4 and 8 µM) CTS and gradient concentration FTD for 72 h. Effect of (0, 1, 2 and 4 µM) CTS in combination with gradient concentration FTD on cell viability in AGS cells (d). Cell viability was assessed using the CCK-8 kit, and the optical density value was calculate using a universal microplate reader. Fa–CI plot of HGC-27 (e) and AGS (f) was calculated using CompuSyn software. Results were expressed as mean ± SD. P < 0.05 versus the value for the control group treated with DMSO.
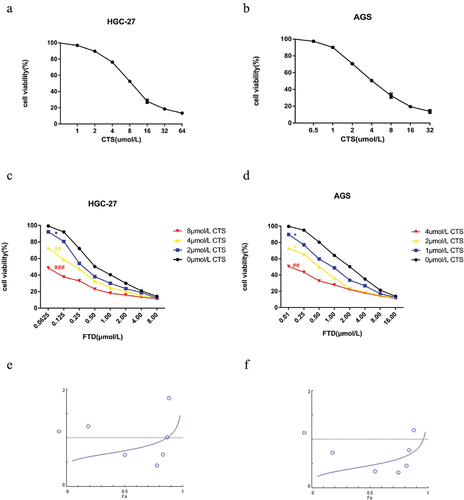
Table 1. Assessment of HGC-27 combinatorial effect of FTD and CTS at Fa 0.1, 0.2, 0.5, 0.75, 0.9 and 0.95. CI value and DRI were calculated using CompuSyn software.
Table 2. Assessment of AGS combinatorial effect of FTD and CTS at Fa 0.1, 0.2, 0.5, 0.75, 0.9 and 0.95. CI value and DRI were calculated using CompuSyn software.
3.2. FTD and its combination with CTS cause cell cycle arrest
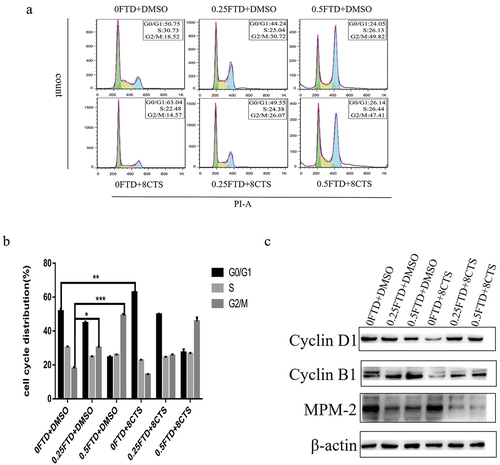
Since FTD combined with CTS can significantly inhibit the proliferation of gastric cancer cells, we conducted cell cycle analysis to explore the mechanism of their synergistic anticancer effects. Firstly, HGC-27 cells were treated with different concentrations of FTD for 72 h. Compared with the control group, we found that the cells were arrested in the G2/M phase in a dose-dependent manner (P < 0.05), and treatment with 0.5 µmol/L FTD increased the proportion of HGC-27 cells in the G2/M phase from 18.52% to 49.82% (). In addition, 8 µmol/L CTS could block HGC-27 cells in the G0/G1 phase. In the combination treatment group, the proportion of HGC-27 cells in the G2/M phase was significantly higher than that in the control group, but slightly lower than that in the FTD-alone treatment group. Furthermore, in order to find out the molecular mechanism of FTD and its combination with CTS on HGC-27 cells, we investigated the expression of cell-cycle-associated protein markers using western blotting. Cyclin D1 protein expression level was down-regulated when treated with CTS alone and Cyclin B1 protein expression level was a dose-dependent increase when treated with CTS alone, which were consistent with the results of the cell cycle analysis. In the combination treatment group, the expression of cyclin D1 protein had no significant change compared with the control group, while the protein of cyclin B1 was still up-regulated. Finally, we analyzed the fraction of HGC-27 cells in mitosis stage by measuring the expression of polyclonal antibody MPM-2 protein, and our results showed that the expression levels of MPM-2 protein in the combination treatment group were lower than those in the other groups (). This demonstrates that FTD and its combination with CTS treatment of HGC-27 cells result in G2/M phase arrest, which is mainly in the G2 phase rather than the mitotic phase.
Figure 2. Effect of FTD alone or in combination with CTS on cell cycle in HGC-27 cells. After treatment with (0, 0.25 and 0.5 µM) FTD alone and in combination with 8 µM CTS for 72 h, flow cytometry was used to detect cell cycle distribution. The results (a) were analyzed by flowJo software. (b) Respective quantitative analysis of the percentage of the cell cycle in G0/G1, S and G2/M phases. (c) Expression of Cyclin B1, Cyclin D1 and MPM-2 in HGC-27 cells after 72-h treatment with (0, 0.25 and 0.25 µM) FTD combined with or without 8 µM CTS. β-actin was used as a loading control. *P < 0.05 and ***P < 0.001 versus the G2/M phase cell proportion in DMSO group. **P < 0.01 versus the G0/G1 phase cell proportion in DMSO group.
3.3. FTD treatment or in combination with CTS induces cell apoptosis
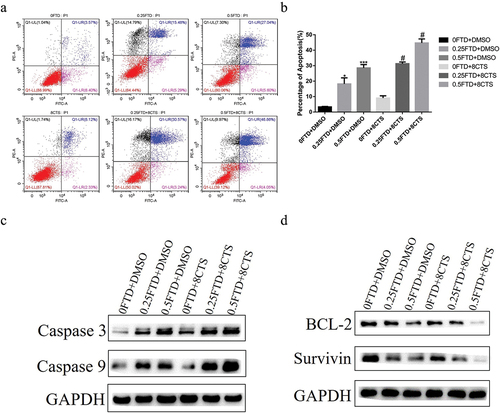
To investigate whether FTD and its combination with CTS are able to induce apoptosis, HGC-27 cells were administrated with different concentrations of FTD and CTS, alone or in combination, for 72 h. As shown in , the proportion of apoptotic cells was significantly increased to 27.04% at 0.5 µM FTD (P < 0.01) and 8.12% at 8 µM CTS in HGC-27 cells. In the combination of 0.25 µM FTD+8 µM CTS-treated and 0.5 µM FTD+8 µM CTS-treated groups, the percentage of the apoptotic HGC-27 cells significantly increased 15.09% and 19.82%, respectively, compared with that in 0.25 µM FTD-treated and 0.5 µM FTD-treated groups (P < 0.05). Because combination treatment could induced apoptosis in HGC-27 cells, we measured levels of caspase 9 and caspase 3. Meanwhile, the expression levels of anti-apoptosis proteins Bcl-2 and Survivin in each treatment group were also measured using western blot. As shown in , the expression of caspase 3 and caspase 9 was significantly up-regulated in a dose-dependent manner after exposed to FTD and its combination group; besides, combination treatment obviously decreased the expression of Bcl-2 and Survivin (). The level of caspase 9 in the combination group was higher than that in the FTD-alone group. Taken together, our results suggested that combined treatment of FTD and CTS could induce more apoptosis in HGC-27 cells than any other group.
Figure 3. Effect of FTD alone or in combination with CTS on apoptosis in HGC-27 cell. HGC-27 cell was treated with the indicated concentration of FTD combined with or without CTS for 72 h, and the ratio of late apoptosis was detected by flow cytometry using Annexin V-FITC/PI double-staining cell apoptosis detection kit. In this study, (a) the proportion of apoptosis was based on late apoptosis, which was located in the upper right quadrant. (b) Respective quantitative analysis of the percentage of apoptosis. (c) Western blot analysis of the expression of caspase 3 and caspase 9 apoptosis-related proteins. (d) Expression of BCL2 and Survivin anti-apoptotic proteins. GAPDH was used as a loading control. *P < 0.05 and ***P < 0.001 versus the control group (0 FTD+DMSO). #P < 0.05 versus the corresponding FTD-alone group.
3.4. CTS increased the amount of FTD incorporation into genomic DNA
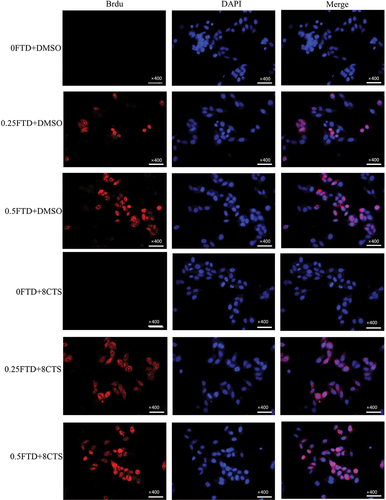
Since FTD can be identified by BrdU antibody [Citation19], we analyzed the amount of FTD incorporated into DNA strand using immunofluorescence assay. Our results show FTD incorporation into HGC-27 cell DNA in a concentration-dependent manner (). In the combination of 0.25 µM FTD+8 µM CTS, the level of FTD incorporation into DNA was significantly higher than that by 0.25 µM FTD-only group. As a result, further increases in FTD incorporation were observed when FTD was combined with CTS, leading to reduced DNA synthesis in gastric cancer cells.
Figure 4. Effect of CTS on FTD incorporation into DNA strand. After treatment with (0, 0.25 and 0.5 µM) FTD combined with or without 8 µM CTS for 72 h, we used BrdU antibody to visualize the incorporation of FTD into DNA strand by immunofluorescence assay. BrdU was stained with Cy3 fluorescence secondary antibody (red) and its nuclear was stained with DAPI (blue). Magnification, ×400.
3.5. CTS blocked FTD-induced phosphorylation of STAT3 via affecting its upstream signaling pathway
As is known to all, constant activated STAT3 increases tumor cell proliferation and inhibits anti-tumor immunity. Our immunoassay results show that FTD treatment increased phosphorylation of STAT3 at Tyr-705 in a dose-dependent manner but had no significant effect on the total STAT3 protein (). Additionally, 8 µM CTS was able to attenuate the levels of phosphorylated STAT3. Compared with FTD treatment, FTD in combination with CTS significantly reduced STAT3 phosphorylation induced by FTD. To further elaborate the potential molecular mechanism of this result, we examined the main STAT3 upstream signaling cascade pathways, including JAK/STAT3, MEK/ERK and PI3K/AKT/mTOR pathways, and the critical protein expression status, especially alterations in the phosphorylation level. Our results suggested that P-AKT (Ser473), P-ERK (Thr202/Tyr204) and P-JAK (Tyr931) were reduced in the FTD combination with CTS-treated HGC-27 cells compared with the FTD-alone-treated cells, while the total protein expression levels of AKT, ERK and JAK were hardly affected (). These data indicate that CTS could reduce FTD-induced STAT3 phosphorylation level by repressing the activation of STAT3 upstream signaling pathway proteins.
Figure 5. Effect of FTD alone or in combination with CTS on STAT3 signaling pathway. After treatment with the indicated concentration of FTD combined with or without CTS on HGC-27 cell for 72 h, the expression levels of (a) total STAT3, p-STAT3 and upstream signaling pathway proteins and (b) total ERK, p-ERK, total AKT, p-AKT, total JAK2 and p-JAK2 were detected using western blotting. GAPDH was used as a loading control.
3.6. FTD in combination with CTS can significantly enhance the anticancer ability in nude mice subcutaneous HGC-27 xenograft tumor model
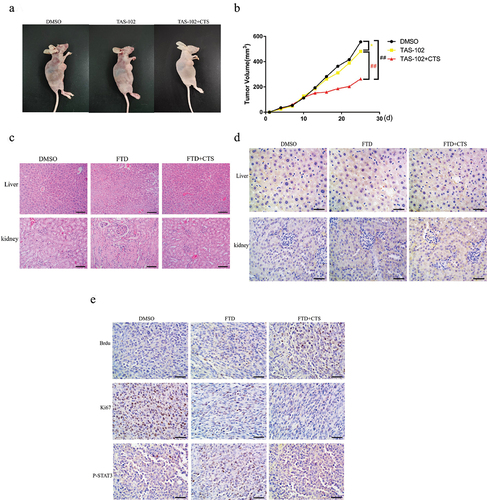
To further uncover the anticancer effect of TAS-102 combined with CTS in vivo, we established a subcutaneous HGC-27 xenograft tumor model (). All nine nude mice were randomly and evenly divided into three groups: DMSO group, TAS-102 group and TAS-102+CTS group. As shown in , compared with the DMSO group, TAS-102-only treatment inhibited tumor growth by 13.45%, while the tumor growth inhibition rate of the combination reached 52.65% (). Additionally, we examined whether TAS-102 and CTS treatment has side effect on the liver and kidney in nude mice at effective doses by HE staining. Our results show that no inflammatory response was observed in the liver and kidney of the treated nude mice (). Additionally, immunohistochemical experiments showed that there was no significant difference in IL-6 levels in the liver and kidney of the nude mice in each treatment group compared with the control group (). Also, we detected the expression level of FTD in the xenograft tumor tissues by BrdU antibody, which was consistent with the results of immunofluorescence we had conducted before. There was a significant decrease in the expression level of Ki-67 in the TAS-102+CTS group than that in the TAS-102 group and the DMSO group. Compared with the DMSO group, p-STAT3 expression increased in the TAS-102 group, but returned to a lower level after combined CTS treatment (). Thus, CTS can significantly enhance the anticancer ability of TAS-102 in vivo.
Figure 6. The combination of FTD and CTS inhibits HGC-27 xenograft tumor growth in vivo. HGC-27 cells (4 × 10⁷) were injected subcutaneously into the nude mice to establish a tumor xenograft model. The nude mice were administered TAS-102 (75 mg/kg, i.p., twice a day) alone or in combination with CTS (10 mg/kg, p.o., every 2 days) for 2 weeks, and the control group received intraperitoneal injection of an equal dose of DMSO every 2 days. (a) Representative nude mice xenograft tumor images of DMSO group, TAS-102 group and TAS-102+CTS group. (b) Tumor volume changes were monitored every 3 days. Data were expressed as mean ± SD, n = 3. After treatment with DMSO, TAS-102 and CTS for 2 weeks, the liver and kidney showed no significant inflammation by HE staining (c), and the expression of inflammatory cytokine IL-6 was further detected by immunohistochemistry (d). We used BrdU antibody to detect the amount of FTD in the xenograft tumor tissue in the three treatment groups using immunohistochemistry. Ki-67 and p-STAT3 were used to detect the malignant degree and phosphorylation level of STAT3 in each group of xenograft tumors, respectively (e). HE staining (high power field, ×200) and immunohistochemistry (high power field, ×400).
4. Discussion
To date, an early diagnosis of gastric cancer remains difficult, and gastric cancer is often in its advanced stage when the clinical symptoms appear. Although most gastric cancer patients can be treated via surgery, the diagnosis is poor. Five-year survival rate after surgery is only 20–30% [Citation20]. As a newly discovered anti-tumor drug, FTD has attracted a lot attention due to its unique anti-tumor mechanism and strong anti-cancer ability. FTD has been recommended for third-line chemotherapy for HER2-negative patients with advanced gastric cancer according to the latest sixth edition of Japanese Gastric Cancer Treatment Guidelines [Citation21]. Traditional chemotherapeutic drugs have serious adverse reactions and high drug resistance rate. However, traditional Chinese medicine has great potential in the treatment of advanced gastric cancer due to its advantages of improving patients’ quality of life, low toxicity, low side reactions and sensitization of chemotherapy [Citation22]. Therefore, understanding the effect and mechanism of the combination of FTD and CTS on gastric cancer treatment is of great importance for doctors. Our results shown here are the first-time uncovering of in vitro and in vivo combinational effect of FTD and CTS in gastric cancer.
Chemotherapy is the main method of multidisciplinary comprehensive treatment for advanced gastric cancer. The recommended chemotherapy regimen for first-line chemotherapy for gastric cancer includes oxaliplatin combined with fluorouracil (FOLFOX or XELOX), docetaxel/paclitaxel combined with cisplatin (TP) and irinotecan combined with fluorouracil (FOLFIRI), but its efficacy is not satisfactory so far [Citation23]. As a novel fluorouracil antitumor agent, TAS-102 was first approved in Japan in 2014 for the treatment of unresectable advanced or recurrent colorectal cancer [Citation24]. A study of TAS-102 in patients with gastric cancer began with a phase III trial in a large sample (n = 507) of patients with metastatic or advanced gastric cancer in eastern and western countries who had received at least two previous chemotherapy treatments. The results showed a 31% reduction in the risk of death in the TAS-102 group compared with placebo. Based on this study, TAS-102 was also recently approved by the Food and Drug Administration for gastric or gastroesophageal junction adenocarcinoma in patients who have previously received at least two chemotherapy regimens, including fluorouracil, platinum compounds, taxane or irinotecan [Citation25]. Here, our results demonstrate that FTD and CTS combined treatment of gastric cancer cells had significantly stronger inhibition of proliferation compared with each single drug treatment group. More importantly, the two drugs showed synergistic anticancer effects at appropriate concentrations. Previous studies have shown that TAS-102 may enhance the efficacy of combination therapy with chemotherapeutic agents irinotecan and oxaliplatin and targeted chemotherapeutic agent bevacizumab [Citation26–28].
We further analyzed the potential mechanism of synergistic effect of FTD and CTS by cell cycle and apoptosis. Compared with the control group, CTS alone could block HGC-27 cells in G1 phase and significantly reduce Cyclin D1, which was consistent with our previous findings [Citation8]. FTD could block cells in G2 phase and up-regulate Cyclin B1 expression. After the combination of FTD and CTS, we found that HGC-27 cells were mainly blocked at G2 phase, and the expression level of mitotic phosphoprotein monoclonal antibody (MPM)-2 protein decreased sharply, indicating that most of the cells were blocked in the intercellular phase and did not enter the mitotic phase. In general, monoclonal antibodies recognize only one or a few specific proteins. However, MPM-2 recognizes more than 50 proteins. Mitogen-specific MPM-2 antigens have conserved phosphorylation epitopes present in a wide range of species. Phosphorylation of these epitopes occurs during mitotic induction, and concentrated in mitotic subcellular structures such as centrosomes, centromere, spindle fibers and chromosome axes [Citation29,Citation30]. FTD combined with CTS increased the expression of pro-apoptotic proteins Caspase 3 and Caspase 9 and inhibited the expression of anti-apoptotic proteins Bcl-2 and Survivin, thereby promoting the apoptosis of gastric cancer cells. FTD works by incorporating DNA strands into tumor cells to inhibit DNA replication. In this study, immunofluorescence experiment was used to intuitively observe that CTS could promote FTD to incorporate into DNA chain. Similarly, Taisuke Baba et al. found that 5-FU could also promote FTD to incorporate into DNA chain [Citation31].
STAT3 is involved in cell cycle (cMyc and Cyclin D1), anti-apoptosis (Bcl-XL, Bcl-2 and Survivin), angiogenesis (VEGF and IL-8) and invasion (MMP-2 and MMP-9) regulation gene expression [Citation32,Citation33]. Additionally, the JAK/STAT pathway is a key signal pathway for tumor immune system activation. To activate the JAK/STAT pathway, cytokines such as IL-6 bind to their receptors to activate JAK trans-phosphorylation, which then recruits and catalyzes STAT phosphorylation. The phosphorylated STAT forms a dimer and subsequently moves into the nucleus to initiate target gene transcription [Citation34]. Previous studies have shown that JAK2/STAT3 signaling pathway is involved in the occurrence and development of various solid tumors such as colorectal cancer, hepatocellular carcinoma and ovarian cancer, and is overactivated in tumor cells [Citation35–37]. JAK2/STAT3 signaling pathway and targeted therapy of STAT3 have attracted wide attention in recent years. In this study, we investigated HGC-27 cells treated by FTD alone, and found that the phosphorylation of STAT3 was promoted when the total STAT3 protein expression was unchanged, while the expression of P-STAT3 was down-regulated by CTS alone. CTS combined with FTD reduced the phosphorylation level of STAT3 induced by FTD compared with FTD alone. In addition, we further studied the expression levels of ERK, AKT and JAK2, the main upstream signaling pathway proteins, to study the potential mechanism of the changes in p-STAT3 expression caused by CTS combined with FTD treatment. ERK, a member of mitogen-activated protein kinase family, is an upstream signal of STAT3. Its signaling pathway is the core of the signaling network involved in regulating cell growth, development and division [Citation38].
Our results on the nude mice xenograft tumor showed that FTD and CTS combined therapy could more significantly inhibit the growth and malignancy of gastric cancer, while exhibiting minimal toxic side effects on the liver and kidney that are commonly caused by many chemotherapy drugs.
This study has some limitations. The synergistic anticancer mechanism of AGS cells has not been further elaborated by FTD and CTS. In addition, the specific mechanism of CTS promoting FTD insertion into DNA strands was not further studied in this study.
5. Conclusion
In conclusion, the combination of FTD and CTS can play an anticancer role through cell cycle, cell apoptosis and influencing cell proliferation pathways by increasing the incorporation of DNA chains, which are closely related to the occurrence and development of gastric cancer. The combination of FTD and CTS can enhance the anti-tumor effect and reduce the toxicity and side effects of chemotherapy, which is expected to play a great role in the treatment of advanced gastric cancer.
Ethics declarations
The present study was reviewed and approved by the Animal Care and Use Committee of Anhui Medical University. We confirm that all methods were performed in accordance with the relevant guidelines and regulations in the National Institutes of Health Guidelines for the Care and Use of Laboratory Animals.
Contributions
PQL, LXZ and ZMC performed the experiments, conducted the statistical analysis and drafted the manuscript; GW assisted in performing the experiments; HZ and SCY discussed the results and helped in revising the manuscript; AMX, WXH and ZJW designed the main study and critically revised the manuscript. All authors read and approved the final manuscript.
Supplemental Material
Download JPEG Image (255.3 KB)
Acknowledgements
Thanks to Immunology Teaching and Research Department of Basic Medical School of Anhui Medical University for providing experimental equipment.
Disclosure statement
No potential conflict of interest was reported by the authors.
Data availability statement
All data generated or analyzed during this study are included in this published article.
Supplementary material
Supplemental data for this article can be accessed online at https://doi.org/10.1080/15384101.2023.2215678
Additional information
Funding
References
- Joshi SS, Badgwell BD. Current treatment and recent progress in gastric cancer. CA Cancer J Clin. 2021;71(3):264–279.
- Thrift AP, El-Serag HB. Burden of gastric cancer. Clin Gastroenterol Hepatol. 2020;18(3):534–542.
- Sexton RE, Al Hallak MN, Diab M, et al. Gastric cancer: a comprehensive review of current and future treatment strategies. Cancer Metastasis Rev. 2020;39(4):1179–1203.
- Ajani JA, D’Amico TA, Bentrem DJ, et al. Gastric cancer, version 2.2022, NCCN clinical practice guidelines in oncology. J Natl Compr Canc Netw. 2022;20(2):167–192.
- Ashrafizadeh M, Zarrabi A, Orouei S, et al. Recent advances and future directions in anti-tumor activity of cryptotanshinone: a mechanistic review. Phytother Res. 2021;35(1):155–179.
- Wu YH, Wu YR, Li B, et al. Cryptotanshinone: a review of its pharmacology activities and molecular mechanisms. Fitoterapia. 2020;145:104633.
- Li H, Gao C, Liu C, et al. A review of the biological activity and pharmacology of cryptotanshinone, an important active constituent in Danshen. Biomed Pharmacother. 2021;137:111332.
- Chen ZM, Huang L, Li MM, et al. Inhibitory effects of isocryptotanshinone on gastric cancer. Sci Rep. 2018;8(1):9307.
- Wang J, Zhang G, Dai C, et al. Cryptotanshinone potentiates the antitumor effects of doxorubicin on gastric cancer cells via inhibition of STAT3 activity. J Int Med Res. 2017;45(1):220–230.
- Wang Y, Lu HL, Liu YD, et al. Cryptotanshinone sensitizes antitumor effect of paclitaxel on tongue squamous cell carcinoma growth by inhibiting the JAK/STAT3 signaling pathway. Biomed Pharmacother. 2017;95:1388–1396.
- Shen L, Zhang G, Lou Z, et al. Cryptotanshinone enhances the effect of arsenic trioxide in treating liver cancer cell by inducing apoptosis through downregulating phosphorylated- STAT3 in vitro and in vivo. BMC Complement Altern Med. 2017;17(1):106.
- Chakrabarti S, Wintheiser G, Tella SH, et al. TAS-102: a resurrected novel Fluoropyrimidine with expanding role in the treatment of gastrointestinal malignancies. Pharmacol Ther. 2021;224:107823.
- Lenz HJ, Stintzing S, Loupakis F. TAS-102, a novel antitumor agent: a review of the mechanism of action. Cancer Treat Rev. 2015;41(9):777–783.
- Vodenkova S, Buchler T, Cervena K, et al. 5-fluorouracil and other fluoropyrimidines in colorectal cancer: past, present and future. Pharmacol Ther. 2020;206:107447.
- Emura T, Suzuki N, Yamaguchi M, et al. A novel combination antimetabolite, TAS-102, exhibits antitumor activity in FU-resistant human cancer cells through a mechanism involving FTD incorporation in DNA. Int J Oncol. 2004;25(3):571–578.
- Baba Y, Tamura T, Satoh Y, et al. Panitumumab interaction with TAS-102 leads to combinational anticancer effects via blocking of EGFR-mediated tumor response to trifluridine. Mol Oncol. 2017;11(8):1065–1077.
- Meng L, Chen Z, Jiang Z, et al. MiR-122-5p suppresses the proliferation, migration, and invasion of gastric cancer cells by targeting LYN. Acta Biochim Biophys Sin (Shanghai). 2020;52(1):49–57.
- Chou TC. Drug combination studies and their synergy quantification using the Chou-Talalay method. Cancer Res. 2010;70(2):440–446.
- Kitao H, Morodomi Y, Niimi S, et al. The antibodies against 5-bromo-2′-deoxyuridine specifically recognize trifluridine incorporated into DNA. Sci Rep. 2016;6(1):25286.
- Wong MCS, Huang J, Chan PSF, et al. Global incidence and mortality of gastric cancer, 1980-2018. JAMA Netw Open. 2021;4(7):e2118457.
- Mikuni H, Boku N. III. chemotherapy for gastric cancer -revised points of the 6th edition of Japanese Gastric Cancer Treatment Guidelines. Gan To Kagaku Ryoho Cancer & Chemotherapy. 2021;48(9):1121–1125.
- Xu W, Li B, Xu M, et al. Traditional Chinese medicine for precancerous lesions of gastric cancer: a review. Biomed Pharmacother. 2022;146:112542.
- Wang FH, Zhang XT, Li YF, et al. The Chinese Society of Clinical Oncology (CSCO): clinical guidelines for the diagnosis and treatment of gastric cancer, 2021. Cancer Commun (Lond). 2021;41(8):747–795.
- Kotani D, Fukuoka S, Yoshino T. Efficacy of TAS-102. Gan To Kagaku Ryoho Cancer & Chemotherapy. 2015;42(1):1–5.
- Shitara K, Doi T, Dvorkin M, et al. Trifluridine/Tipiracil versus placebo in patients with heavily pretreated metastatic gastric cancer (TAGS): a randomised, double-blind, placebo-controlled, phase 3 trial. Lancet Oncol. 2018;19(11):1437–1448.
- Doi T, Yoshino T, Fuse N, et al. Phase I study of TAS-102 and irinotecan combination therapy in Japanese patients with advanced colorectal cancer. Invest New Drugs. 2015;33(5):1068–1077.
- Cecchini M, Kortmansky JS, Cui C, et al. A phase 1b expansion study of TAS-102 with oxaliplatin for refractory metastatic colorectal cancer. Cancer. 2021;127(9):1417–1424.
- Yoshida Y, Yamada T, Kamiyama H, et al. Combination of TAS-102 and bevacizumab as third-line treatment for metastatic colorectal cancer: tAS-CC3 study. Int J Clin Oncol. 2021;26(1):111–117.
- Escargueil AE, Larsen AK. Mitosis-specific MPM-2 phosphorylation of DNA topoisomerase IIalpha is regulated directly by protein phosphatase 2A. Biochem J. 2007;403(2):235–242.
- Tapia C, Kutzner H, Mentzel T, et al. Two mitosis-specific antibodies, MPM-2 and phospho-histone H3 (Ser28), allow rapid and precise determination of mitotic activity. Am J Surg Pathol. 2006;30(1):83–89.
- Baba T, Kokuryo T, Yamaguchi J, et al. Pre-exposure to fluorouracil increased trifluridine incorporation and enhanced its anti-tumor effect for colorectal cancer. Anticancer Res. 2018;38(3):1427–1434.
- Laudisi F, Cherubini F, Monteleone G, et al. STAT3 interactors as potential therapeutic targets for cancer treatment. Int J Mol Sci. 2018;19(6):1787.
- Huang Q, Zhong Y, Dong H, et al. Revisiting signal transducer and activator of transcription 3 (STAT3) as an anticancer target and its inhibitor discovery: where are we and where should we go? Eur J Med Chem. 2020;187:111922.
- Hu X, Li J, Fu M, et al. The JAK/STAT signaling pathway: from bench to clinic. Signal Transduct Target Ther. 2021;6(1):402.
- Park SY, Lee CJ, Choi JH, et al. The JAK2/STAT3/CCND2 Axis promotes colorectal Cancer stem cell persistence and radioresistance. J Exp Clin Cancer Res. 2019;38(1):399.
- Zhao Z, Song J, Tang B, et al. CircSOD2 induced epigenetic alteration drives hepatocellular carcinoma progression through activating JAK2/STAT3 signaling pathway. J Exp Clin Cancer Res. 2020;39(1):259.
- Yoshikawa T, Miyamoto M, Aoyama T, et al. JAK2/STAT3 pathway as a therapeutic target in ovarian cancers. Oncol Lett. 2018;15(4):5772–5780.
- Najafi M, Ahmadi A, Mortezaee K. Extracellular-signal-regulated kinase/mitogen-activated protein kinase signaling as a target for cancer therapy: an updated review. Cell Biol Int. 2019;43(11):1206–1222.