
ABSTRACT
Estrogen receptor (ER) α expression and associated signaling is a major driver of over two-thirds of all breast cancers (BC). ER targeting strategies are typically used as a first-line therapy in patients with steroid receptor positive (SR+) disease. Secondary resistance to anti-estrogenic agents may occur with clonal expansion and disease progression. Mechanisms underlying hormone resistance are an expanding field of significant translational importance. Cross-talk with other nuclear hormones, receptors, and signaling pathways, including thyroid hormones (TH) and their receptors (THRs), have been shown to promote endocrine therapy resistance in some studies. We have shown that TH replacement therapy (THRT) was independently and significantly associated with higher rates of relapse and mortality in SR positive (+), node-negative (LN-) BC patients, whereas it showed no association with outcomes in SR negative (-) patients. LN-, SR+ patients receiving THRT and tamoxifen had the worst outcomes, suggesting a pro-carcinogenic interaction that significantly and independently shortened survival and increased mortality. Using in vivo and in vitro models, we previously showed hormonal cross-talk, altered gene signaling, target gene activation, and resistance to tamoxifen in the presence of TH. In this report, we show TH ± E2 ± tamoxifen inhibits cell cycle control signaling, reduces apoptosis, and enhances cell proliferation, tumor growth, tamoxifen resistance, and clonal expansion. Mechanistically these changes involve numerous genes and pathways, including critical cell cycle regulatory proteins and genes identified using various molecular methods. These studies facilitate a greater mechanistic understanding of the biological and molecular impact of TH on SR+ BC.
Introduction
Estrogen is a well-recognized independent promoter of BC development and progression, especially in peri- and post-menopausal females [Citation1]. Women with later sexual development, multiple pregnancies, older age at menarche, and births at a younger age, surgical oophorectomy or drug-induced estrogenic blockade have a reduced incidence of breast cancer (BC). In patients with all stages of SR+ BC, surgical oophorectomy or the administration of anti-estrogenic drugs has been shown to significantly reduce relapse, the development of contralateral BC, and improve BC survival [Citation2–4]. With the advent of molecular phenotyping, subsets of SR+ BC patients are identified and stratified into prognostic subsets. Molecular data often informs, which patients may be more resistant to anti-estrogenic agents or benefit from the addition of chemotherapy or other agents. We previously reported statistically significant, independent interactions between outcome, treatment response, and exogenous TH administration in early-stage BC patients only if their cancers were SR+. These interactions were also demonstrated using in vivo, in vitro and in silico methods [Citation5]. In this study, we further define molecular and biological changes as well as hormonal and treatment interactions between estrogenic and thyroid hormones.
Several cellular processes, including embryonic development, cell growth, differentiation, metabolism, proliferation, and transformation to cancer, are modulated by the THs tri-iodo-L-thyronine (T3) and thyroxine (T4). These hormones are made by the thyroid gland and may be modulated in activity by binding proteins, receptor expression, or enzymes in target cells. TH/THR may regulate gene expression through genomic and non-genomic mechanisms. Feedback loops from TH/THR may alter gene expression, multiple signaling pathways, and alternate hormone receptor complexes which may be tissue type or cell subtype-specific. Significant similarities between TH/THR and E2/ER have been reported, with overlapping functions, structures, and mechanisms of action [Citation6]. Specific interactions in breast epithelium or lumian cells, or in breast tissue have not been widley investigated. THR is comprised of two primary isoforms (α and β) with further isoforms generated by alternative splicing (TRα1 and 2, TRβ1 and 2) These are widely expressed by embryonic and mature mammalian cells, including breast epithelium and epithelial-derived BC [Citation6–8]. TH has specifically been shown to promote angiogenesis, proliferation, and modulate metabolic processes in some cancer subtypes [Citation9].
Thyroid diseases, including autoimmune or inflammatory disorders, changes in thyroid gland function, benign tumor nodules, or cancer affect approximately 10% of the US population, with a five to ten-fold female predominance [Citation10]. Thyroid disease (clinical or preclinical) increases with age (up to 25% in older women) [Citation11] and is especially high in women with BC (up to 75% in newly diagnosed patients [Citation12,Citation13]). Significant independent associations between BC risk and thyroid disease has been shown in numerious large epidemiologic studies as well as analysis of population subgroups [Citation14,Citation15]. Many thyroid diseases influence TH synthesis or metabolism, with hyperthyroidism being the most common. Excess endogenous production of TH (hyperthyroidism) is significantly associated with an increase in female BC risk, whereas low TH (hypothyroidism) is significantly associated with a reduction in BC [Citation16,Citation17]. Other covariables including: patient age, reproductive history and obesity may influence the effects of TH on BC as well [Citation5,Citation18]. Exogenous TH, administered as THRT (most frequently in the form of levothyroxine, a synthetic T4, typically administered daily and often for the patient’s lifetime), may also increase the risk of BC [Citation19]. The magnitude of increased risk from THRT has been shown to be higly significant in several large studies. For example, in a nationwide population-based study of Taiwanese women, women over 65 on THRT had the highest incidence of BC risk (HR1.45, 95% CI 1.12–1.41, P < 0.01). The incedence was lower but significant in women <65 years on THRT (HR1.19, 95% CI 1.09–1.29, P < 0.01) [Citation19]. A report from the Women’s Health Initiative Study confirmed THRT may be associated with modulation of the risk of BC in some women, and that there are a variety of variables (e.g. thyroid disease, THRT, patient age/menopausal status, reproductive history, and estrogenic therapy) that may modulatethe risk. For example, in hypothyroid post-menopausal women treated with THRT alone, there was a 20-fold reduction in BC [Citation20]. In hypothyroid post-menopausal women who received TH and estrogen therapy of any duration, in contrast, no similar risk reduction was observed [Citation21,Citation22]. In women with hyperthyroidism (treated or untreated), an increased risk of BC development was detectable but did not reach statistical significance. Hyperthyroid women also treated with peri- and/or post-menopausal unopposed estrogen therapy <5 years in duration showed a highly significant and remarkable 62% increased risk of invasive BC (HR1.62, 95% CI 1.01–2.58) [Citation20]. Other literature has shown that THRT use for papillary thyroid cancer (PTC) is associated with a significant increase in early and aggressive BC development [Citation23–26]. These clinical reports, combined with our data [Citation5] suggests that in combination, estrogen, and thyroid hormone (endogenous hyperthyroidism or THRT) promotes BC.
At the molecular level, recent studies have highlighted overlap and cross-talk in the genomic and non-genomic actions of TH and other steroid hormones, including E2, in BC cells. Similar interactions between estrogen and testosterone have also been reported [Citation27]. We have previously shown that ERα and THRα are requisite to the TH:E2 interactions, whereas other receptor isoforms were not significantly involved SR+ BC cells [Citation5]. Some have reported that TH may induce phosphorylation and activation of estrogen receptor α (ERα) at Ser-118, via feedback from TH/THR activated MAPK/ERK (1/2) pathway to promote BC proliferation. Others have focused on the role of integrin αVβ3, which contains a cell surface receptor site for TH and thus may also serve as a conduit to activate MAPK/ERK signaling, promoting estrogenic cross-talk and BC proliferation [Citation28]. When examining the influence of TH on proliferation, T4 primarily interacts with cell surface receptors, whereas T3 binds to nuclear THRs and thus non-genomically activates alternate pathways such as the MAPK, PI3K, and WNT pathways [Citation6,Citation29,Citation30].
In this report, we provide further evidence of pro-carcinogenic cross-talk between THs/THRs and estrogen (E2)/estrogen receptors (ERs) to promote SR+ BC through the activation of cell cycle genes and their respective proteins, enhancing cell proliferation. We also show TH, in combination with E2, significantly enhances colony formation and the fraction of cells in S-phase, and significantly reduces cellular apoptosis. In total, these effects promote tumor growth and increase treatment resistance. We also show TH in the presence of E2 or tamoxifen can upregulate genomic and non-genomic hormonal signaling only in SR+ BC cells via complex molecular and regulatory gene alterations not previously described.
Materials and methods
Cell lines
Human breast cancer cell lines MCF7, T47D, MDA-MB-468, SKBR3 cells (source ATCC), and further described [Citation5]. Cell lines were authenticated by Short Tandem Repeat DNA Profiling (Promega) at the University of Colorado Cancer Center (UCCC) Tissue Culture Core and tested for mycoplasma every three months. Only cells under five passages were used in this study. PT12 cells (also known as UCD12 cells) were derived from UCD12 PDX model [Citation31] and have been characterized as described in [Citation32]. The immortalized human BC cell lines MCF7 and T47D cells were cultured in MEM/EBSS (Gibco) supplemented with 5% FBS, NEAA (Hyclone), Sodium Pyruvate (100 mM, Gibco), 100 U/mL penicillin and 100 ug/mL streptomycin sulfate (Invitrogen), and insulin (Sigma). Prior to hormone treatment, all ER+ cells were cultured in phenol-red free MEM (Gibco) supplemented with L-glutamine, 5% CSS, which is reduced to 2.5% CSS 24 hrs. later. Cells were treated with 100 nM 4-OH-tamoxifen (Sigma) or 1 μM Fulvestrant (ICI, Selleckchem). MDA-MB-468 and SKBR2 cells were cultured in DMEM/F12 (Corning Cellgro) with 5% FBS with insulin. PT12 cells were cultured in DMEM/F12 media supplemented with 10% FBS, 1 × 10⁻⁹ M Insulin, 100 ng/mL cholera toxin (Sigma), and hydrocortisone (Stemcell). All cells were cultured in a 37°C incubator with 5% CO2. Additional cell culture conditions are described elsewhere [Citation5,Citation33,Citation34].
Western blot analysis
Expression and activation of signaling molecules were assayed by Western blot. T47D cells were grown under varying media conditions as described [Citation5]. Antibodies were from the following sources: ERα (2922), phospho-ERα (2511), Cyclin B (BF682, 4138), Cyclin A (4656), Myc (D84Cl2, 5606), IGF-IR (3027), E2F1(3742) were all purchased from Cell Signaling Technology, Inc.; Cyclin E (HE12), and Cyclin D1 (M-20) were obtained from Santa Cruz Biotechnology; and β-actin (AC-75) were obtained from Sigma Aldrich. ERα (EPR4097), ERα (SP1), phospho-ERα (phospho-S118, E91) were all purchased from Abcam.
Quantitative PCR
qRTPCR was previously described in [Citation5]. In brief Total RNA was isolated from BC cell lines or animal tumor tissue using the RNeasy Mini Kit (Qiagen). RNA (2,000 ng) was reverse transcribed using the qScript cDNA Synthesis Kit (QuantaBio), and the resulting cDNA used for real-time PCR amplification with Fast SYBR green PCR master mix on a 7500 HT real-time PCR system (Applied Biosystems). GAPDH was used as an endogenous normalization control. Primers are described in supplemental methods. Relative levels of gene changes were determined using the ΔΔ/CT analysis protocol. Primers used in this study include: CCNA1 (PPH00971), CCND1 (PPH00128F), CCNE1 (PPH00131A); and GAPDH (PPH00150F) were purchased from QIAGEN.
Cell proliferation assay
A CellTiter 96 AQ nonradioactive cell proliferation kit (Promega Corp) was used as described [Citation34] https://www.ncbi.nlm.nih.gov/pmc/articles/PMC3905068/ to determine cell viability. In brief, 5,000–10,000 cells were plated in each well of a 96-well plate in DMEM/F-12 medium with 1% FBS and 15 mmol/L HEPES (pH 7.4) for 24 hr, and then grown in DMEM medium with 0.5% FBS. After 72 hr, wells were read at 490 nm with a microplate reader. All conditions were tested in triplicate samples, and the percentage of surviving cells from each group was calculated relative to controls. Control cultures were defined as 100% survival.
Cell cycle analysis
Cell cycle distribution of treated and untreated cells as previously described [Citation34]. Cells were seeded in 60-mm dishes with MEM medium with 2.5% CSS serum prior to hormone treatment, Tam (1 µM) or ICI (1 µM). Cells were harvested and fixed in 70% ethanol containing 50 μg/ml propidium iodide and 100 μg/ml RNase I in PBS for 30 min at 37°C. Cell cycle distribution was analyzed with the Gallios™ Flow Cytometer (Beckman Coulter Inc.) in the University of Colorado Cancer Center Flow Cytometry Shared Resource. DNA histograms were analyzed using ModFit software. Apoptosis studies were performed using YO-PRO-1 (or FITC conjugated annexin V) and PI per manufacturers recommendations (13243, Thermo Fisher Scientific). Vibrant Apoptosis Kit with YO-PRO®-1 and PI (Molecular Probes) was used in accordance with the manufacturer’s protocol as described previously [Citation35] and in [Citation36]. In brief, MCF7 cells were plated in 5% FBS MEM medium, then starved with glucose-free MEM medium with 2.5% CSS serum prior to hormone treatment, Tam (1 µM) or ICI (1 µM) for 72 h. Cells were harvested after the treatment period, washed with chilled PBS and counted for cell density of ~ 1 × 10⁶ cells/mL in PBS in 1 mL assay. Cells were then stained using Vibrant apoptosis assay, as per manufacturer's guidelines. Gated percentage of cells in region A2 is representative of dead cells and is indicated with percentage of dead cells relative to entire population of gated cells, excluding debris. Region A1 was gated for apoptotic cells, and the remaining cells were viable cell.
Colony-forming assay
Clonogenic assays were performed as described [Citation34]. Cells were placed in 6-well plates (in triplicate) at a density of 1000–2000 cells/well, with 2 ml of MEM medium with 2.5% CSS serum prior to hormone treatment, Tam (1 µM) or ICI (1 µM) and grown in a 37°C humidified atmosphere containing 95% air and 5% CO2. Colonies were visualized by staining with a 0.5% crystal violet in 25% methanol, followed by 3 washes with tap water to remove excess stain. Total colony numbers were counted using a gel doc imager (BioRad Laboratories).
GeneAtlas WT expression and Affymetrix array
MCF7 and T47D cells were treated with vehicle control, estrogen, thyroid hormone, estrogen + thyroid hormone with or without Tam or ICI at concentrations defined in for 24 hr. Cells were harvested using Qiagen RNAeasy mini kit purification per manufacturer’s recommendations. GeneAtlas™ WT Expression Kit and Ambion® WT Expression Kit in conjunction with the Gene Chip® WT Terminal Labeling Kit to generate amplified and biotinylted sense-strand DNA targets from the entire expressed genome without bias. We used the Affymetrix® Gene 1.1 ST Assay strips per manufacturer’s guidelines (GeneAtlas™ WT Expression User Guide (Pub. No. MAN0019117 Rev. A.0).
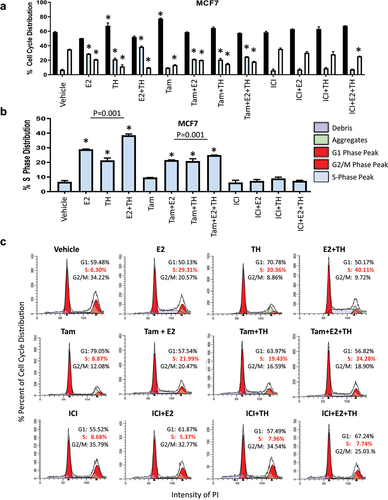
Figure 1. TH with E2 enhanced S phase arrest in MCF7 cells. (a) MCF7 were treated with vehicle (ETOH), E2 (1×10⁻⁸ M), TH (T4: 1 × 10⁻⁷ M, T3: 2.5 × 10⁻⁸ M at a 4:1 ratio) or combination of E2+TH with or without tamoxifen (Tam, 1 mM) or fulvestrant (ICI, 1 mM) for 24 hrs. then harvested and stained with propidium iodide (PI) for cell cycle changes as monitored by flow cytometry. G1 phase (black), S phase (light blue), G2/M phase (white) percent distribution is represented for triplicate experiments. (b) Percent S-phase distribution is measured by flow cytometry of PI staining. (C) representative flow cytometry histogram of cell cycle distribution. Student t-test was performed on biological triplicates, * p < 0.0001 relative to control or otherwise specified.
RNA-seq analysis and gene set enrichment analysis.
RNA-seq libraries were prepared from total RNA by the University of Colorado Cancer Center Genomics Shared Resource using the NuGEN Stranded mRNA Sample preparing kit (Tecan Genomics, Inc.) and previously reported in [Citation5]. In brief, the resulting libraries were sequenced on the Illumina HiSeq 4000 (1 × 50 bp) with an average 46 million reads per sample. Sequencing reads were trimmed with cut adapt to remove 3' adaptor sequences and low quality 3' bases (q < 10), and mapped to GRCh37 human genome using HISAT2 v 2.1.0 [Citation37]. More than 90% of the sequencing reads were mapped to the genome. To quantify the gene expressions, the number of read counts and transcript per million (TPM) per gene was calculated by SALSA tool (https://github.com/hmgene/salsa). Differential expression of an individual gene in two experimental conditions was tested by the Negative Binomial Generalized Linear Model (NB-GLM) using edgeR program [Citation38]. Using a threshold cutoff (FDR ≤0.05 and |log2 FC|≥1), we selected the significant gene set (Supplemental Fig. S5), which was visualized in an unsupervised hierarchical clustering heat map. We used Gene Set Enrichment Analysis (GSEA) software [Citation39] to identify gene sets/pathways enrichment in different comparisons. To further characterize the gene interactions, we used Ingenuity Pathway Analysis (IPA) to identify upstream regulators and diseases/functions of the differentially expressed genes. Within each of those categories, putatively activated pathways were selected by z score (>0.1) and p value (<0.05). RNA-seq data have been deposited to the NCBI Gene Expression Omnibus (GEO) and can be accessed through the accession number GSE131276 (https://www.ncbi.nlm.nih.gov/geo/query/acc.cgi?acc=GSE131276).
Animal models
Xenograft experiments were approved by the University of Colorado Institutional Animal Care and Use Committee (IACUC) and conducted in accordance with NIH guidelines of care and use of laboratory animals [Citation5]. Female NOD-SCID-gamma (NSG) mice purchased from the Jackson Laboratory, grown to 4 to 6 weeks old, implanted with a S.C. E2 pellet (a silastic implant containing cellulose and either 0.25 mg or 1 mg of E2 (Millipore Sigma)), and injected with UCD12 PDX per protocol [Citation33]. Mice were treated as previously described in [Citation5]. In brief, Mice were then treated with L-thyroxine (T1775, Sigma Aldrich, 5 mg/kg in water) for half the mice while the remainder were on E2 treatment only. Mammary tumors were measured in 2 dimensions using digital calipers. Volume was calculated as (length2 × width)/2, where the length was the longer of the 2 measurements. After tumors grew to a specific size (100–150 mm3), mice were randomized to treatment groups based on body weight and tumor volume, followed by tamoxifen (T5648, Sigma Aldrich) treatment 2 times a week or fulvestrant (ICI, 5 mg per mouse) treatment performed weekly. Once tumors reached 2000 mm3 experiments were terminated.
Statistics
For some analyses, statistical significance was evaluated using a two-tailed Student t-test or ANOVA with Bonferroni or Dunnett’s multiple comparisons test or non-parametric equivalents in GraphPad Prism (Ver 6, GraphPad Software) as described in [Citation5]. Stat View 5.1 (Abacus) software was used for statistical analyses of clinical data. Results are reported as mean ± SD or mean ± SEM. Test assumptions were checked for all analyses. The statistical test used and the significance value were reported for each figure in the legend. The tumor growth data sets were analyzed using the Bonferroni corrected 2-way ANOVA to compute statistical significance. One-way ANOVA with Tukey’s post hoc test was done for samples with multiple comparisons, as described in [Citation5]. A p value less than 0.05 was considered significant.
Results
TH increases S-phase fraction, cell growth, and tamoxifen resistance
Our prior work demonstrated that exogenous TH enhanced expression of several genes associated with high-risk expression profiles used to assign prognostic risk and thus determine cancer treatment (Oncotype, MammaPrint, etc.) for lymph-node negative SR+ BC patients [Citation5]. Additionally, co-treatment of TH+E2 enhanced ER+ BC tumor growth and expression of the Ki67 biomarker of proliferation rate. In these studies, we explored whether TH alone or in combination with E2 enhanced the activation of cell cycle genes and signaling pathways. Using flow cytometry, we quantitated the percentage of BC cells in various cell cycle phases under different hormonal conditions. Several forms of TH were used to compare their effects in SR+ BC cells, including T4, T3, or a combination of T4:T3 (4:1 and 10:1 ratios) [Citation5]. Here, we treated two ER+ BC cells (MCF7 and T47D) with different treatment conditions and show that TH or E2 alone, or in combination, significantly increase the percentage of cells in S-phase () or (Supplementary Figure S1). Pretreatment of the ER+ BC cells with the partial antagonist tamoxifen (Tam), as compared to the full ER degrader fulvestrant (ICI, ICI 182,780), induced significant differences in their response to TH. Tam alone enhanced both E2 and TH-mediated increases in the S-phase fraction of MCF7 () and T47D (Supplemental ) cells. Tam also further enhanced the TH+E2-mediated S-phase fraction of cells. In contrast, ICI blocked the E2, TH, or E2+TH-mediated increase in the S phase fraction in both cell lines examined. The data is also shown as Mod-Fit plots to quantify the cell cycle distribution of proliferating in MCF7 () and T47D (Supplemental ) cell lines under various hormonal conditions. These data show that TH alone or combined with E2 increases the percentage of cells in S-phase. In contrast, ICI attenuates the proliferative actions of these hormones in combination.
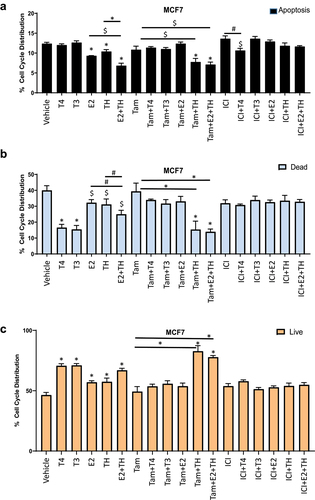
Given the enhanced TH-induced tumor growth and treatment resistance we reported in our previous work, we next sought to determine if TH±E2 modulated the programmed cell death/apoptosis in the same cell lines under similar hormonal conditions. The apoptotic capacity of cells was quantitated using the YO-PRO-1 reagents and methods for the rapid determination of apoptotic fractions. The MCF7 apoptotic fraction data, , shows a significant decrease in apoptosis in response to either hormone alone, E2 + TH, Tam + TH, and Tam + E2 + TH. The necrotic/dead cell fraction, as compared to the viable/live cell fraction, are also shown in , respectively. They show a marked increase in viable cells with TH alone (T3, T4) or TH combined with E2. Viability further increased when Tam and TH were used in combination, with or without E2, . These data are as expected, given , showing the most significant decline in apoptosis in the same treatment groups. Thus, TH modulates the functional response of BC cells to Tam, shifting it from a partial ER inhibitor to an estrogenic promoter of cell proliferation and viability (as previously reported in our patient-derived data [Citation5] and cell cycle analysis, ). No interaction with TH was apparent in any ICI treatment groups, consistent with its role as a complete blocker of estrogenic signaling.
Figure 2. Thyroid combined with estrogen decrease cellular apoptosis and increased proliferation in MCF7 cells. MCF7 cells treated with vehicle (ETOH), T4 (1×10⁻⁷ M), T3 (2.5×10⁻⁸ M), E2 (1×10⁻⁸ M), TH (T4: 1 × 10⁻⁷ M, T3: 2.5 × 10⁻⁸ M at a 4:1 ratio) or combination of E2+TH with or without tamoxifen (Tam, 1 mM) or fulvestrant (ICI, 1 mM) for 24 hrs. As defined in for 24 hrs. were collected and stained with apoptotic kit Yo-pro-1® assay and analyzed by flow cytometry to define the percentage of cells in apoptosis (a), dead cells (b), or live cells (c). Student t-test was performed on biological triplicates, * p < 0.0001, # p < 0.001, $ p < 0.01 relative to control or otherwise specified.
TH enhances E2-mediated colony formation
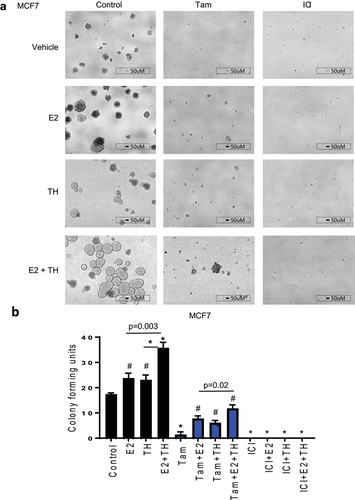
Next, we examined the colony formation (CF) capacity of BC cells treated with TH ± E2, with or without Tam or ICI. TH ± E2 enhanced CF units relative to vehicle in both MCF7 () and T47D cells (Supplemental ). Tam alone significantly reduced colony formation, although it was less effective in the presence of E2, TH or both in MCF7 cells. In T47D cells (with lower ER expression relative to MCF7), Tam and ICI were each efficient in reducing E2, TH, or TH+E2-mediated CF (Supplemental ). Fulvestrant (ICI) was the most effective against CF capacity in all treatment groups and cell lines, as shown for MCF7 () or T47D cells (Supplemental ). Altogether, the use of the full ER-antagonist (ICI) most efficiently attenuated the TH-mediated colony-forming capacity of the ER+ BC cells. As a side note, when examining the morphology of ER+ cells (MCF7 and T47D) are mass colonies that have disorganized nuclei and robust cell-cell adhesion as described in [Citation40]. In the presence of TH, the mass of cells appear more three-dimensional with a smooth cytoplasmic edge as compared to flatter and less cohesive cell groups without a smooth cell border (also described as grape-like clusters associated with a basaloid phenotype, as shown in [Citation40]). In the presence of Tam or ICI, mass colonies are unable to form.
Figure 3. Estrogen with thyroid hormone increases colony-forming units and enhances tamoxifen mediated resistance in ER+ BC cells. (a) MCF7 cells were treated as defined in for 7 days than replenished with new media and subsequent treatment for another 7 days. Total colony forming units were imaged at 4 × . A representative experiment is shown from three representative experiments. Scale bar 50 µm. (b) colony forming units were quantified using BioRad imager. Student t-test was performed on biological triplicates, * p < 0.0001, # p < 0.001 relative to control or otherwise specified.
TH enhances E2-mediated expression of cell cycle regulatory proteins and genes
Based on our observational studies of two groups of stage 1 BC patients that showed worse outcomes for SR+ BC patients on THRT, we next examined the effects of TH±E2 on BC cell cycle proliferation and expression of cell cycle regulatory proteins and genes. As shown in and quantitated in , TH alone increased ERα expression, in ER+ BC cell line T47D and alternate ER+ cell lines shown previously [Citation5] E2 alone increased E2F1, phospho-ER (S118), Cyclin A, B, E, D, and IGF1R. E2 and TH combined were associated with a decrease in ERα, an increase in phospho-ERα (S118), E2F1, and cyclins A, B, D1, E, and IGFIR. Tam+TH significantly increased E2F1 and cyclin A protein expression. In the presence of Tam+E2+TH there was a significant increase in phospho-ERα (S118), E2F1, cyclin A, B, E, and IGF-1 R. Tam + TH increased the expression of E2-mediated signaling, consistent with a shift in Tam action from a partial ER antagonist to an agonist in the presence of TH. Notably, these interactions appear to be even more accentuated when E2 is also present. This is in contrast to the effect of ICI, which consistently reduced the expression of cell cycle regulatory proteins under various treatment conditions, especially E2F1, total ERα, cyclin A, cyclin E and IGF1R protein expression.
Figure 4. Estrogen alone or in combination with thyroid hormone increase cell cycle related proteins in ER+ but not ER- BC cell lines and enhances endocrine therapy resistance to tamoxifen but not fulvestrant in ER+ BC cells. (a) ER + BC T47D cells were treated with vehicle (ETOH) or E2 (1×10⁻⁸ M) alone or in combination with TH (T4: 1 × 10⁻⁷ M, T3: 2.5 × 10⁻⁸ M at a 4:1 ratio) with or without tamoxifen (Tam, 1 mM) or fulvestrant (ICI, 1 mM) for 24 h. Cells were collected and harvested for Western blot analysis of cell cycle regulated protein expression relative to β-actin loading control. (b) Western blot quantification of identified proteins () plotted relative to β-actin loading control were performed using ImageJ analysis. Statistical t-test was performed on triplicate experiments, * p < 0.01. (c) T47D (ER+) BC cells were treated with vehicle (ETOH), E2 (1×10⁻⁸ M), T4 (1×10⁻⁵M to 1 × 10⁻¹⁰M) and T3 (2.5×10⁻⁶ M to 2.5 × 10⁻¹¹M) as described in a and monitored for changes in proliferation using MTS. (d-e) T47D cells treated as described in a for 24 hours than cells were harvested for qRTPCR analysis of cyclin A, cyclin D1 and cyclin E. Student t-test was performed on biological triplicates, * p < 0.0001 relative to control.
Pre-treating ER+ BC cells with the hormones alone or combined with Tam or ICI further corroborated our findings that TH+E2 enhances proliferation in ER+ cells (T47D, ; MCF7, Supplemental ) but not in ER-negative BC cell lines (MDA-MB-468 and SKRB3, Supplemental ) as quantitated by an MTS proliferation assay. Next, T47D were pre-treated with Tam prior to hormone combinations and monitored for expression of cyclin A, cyclin D1, and cyclin E genes at the mRNA level in T47D () and MCF7 (Supplemental ) cells. Altogether, Tam failed to efficiently block the pro-proliferative effects of TH alone or combined with E2 in ER+ BC cells, whereas ICI significantly reduces the pro-growth effects of these hormones.
TH enhances activation of E2-mediated cell cycle regulatory pathway genes
Given the high expression of both ESR1 and THRα in SR+ BC and the ability of both TH and E2 to enhance growth, proliferation, and activation of cell cycle regulatory proteins in SR+ BC cells, we next studied their effects on gene regulation in vitro. We treated MCF7 and T47D with vehicle, E2, TH, TH+E2, with or without Tam or ICI for 24 h, prior to harvesting cells for derivation of RNA followed by an Affymetrix® Gene 1.1 ST Assay (see figure legend and methods for further detail). Our comprehensive RNA-seq analysis examined over 33,000 genes for changes in signaling pathways induced by several treatment groups. Several regulatory genes were up or down-regulated by E2, as compared to vehicle control. These included estrogen-inducible genes and other regulatory genes as shown in ().
Table 1. Affymetrix genes effected by thyroid hormone alone or in combination with estrogen in MCF7 and T47D cells.
In response to TH alone, numerous other genes showed significant changes in transcription including KPNA2, PFKFB3, SLC9A3R1, and HSPA8 (up-regulated) and KIAA1324 (down-regulated) (). In combination, TH and E2 also upregulated several E2 induced genes THBS1, ELOVL5, and GREB1 as well as others not regulated by E2 alone including SLC7A5, HSPB8, FDFT1, HSP90AA2, CMYBL1 and SEMA3C (). In combination, the hormones significantly downregulated CD24, RAB27B, FBXO32, and BAMBI as compared to vehicle control (). Supplementary Table S1 shows significant gene expression data for MCF7 and T47D cells treated with these hormones as well as Tam, in the following groups: Tam + E2, Tam + TH, or Tam + E2 +TH (D, E, F and G, respectively). In the presence of all three hormones, numerous genes were activated, including GREB1, RAD51C, RPL7A, CKS1B, GFRA1, TFF1, STC, SEMA3C, B4GALT1, PGR, SLC9A3R1, SERPINA6, IGFBP5, IER1, TTC39A, IFGBP4, JAK1, MBOAT1. Altogether, TH combined with E2 significantly upregulated several genes involved in cell proliferation and estrogenic signaling. When Tam was added to both hormones (TH+E2), the gene expression pattern changed significantly to include several involved in epithelial-mesenchymal transition (EMT) and hormonal signaling associated with the progesterone receptor (PGR), in addition to estrogenic signaling and proliferation. Activation of these unique gene sets by each treatment group provides mechanistic data supporting the effects observed in our patient studies and preclinical research [Citation5]. In aggregate, our data show that TH enhanced estrogen-mediated proliferation and changes in tamoxifen response, to either resistance or a shift from a partial antagonist to a partial agonist, in ER+ BC cell lines.
We next sought to validate the aforementioned hormone-induced gene expression patterns in vivo by using a novel ER+ PDX model, UCD12, grown in the quadrilateral mammary fat pads of female NSG ovary-intact mice with estrogen supplementation, see [Citation5] for additional detail. Mice were treated with TH (LT4, 5 mg/L) to generate a hyperthyroid state or no exogenous TH for 30 days prior to stratification by tumor size, as described elsewhere [Citation5]. Each cohort (vehicle control or THRT treated) group was then treated ± Tam (1 mg/kg in 0.1 mL peanut oil) for the duration of the experiment (60 days). E2 alone promoted tumor growth and increased tumor weight and size, as previously reported [Citation5]. In contrast, E2 + TH cohort had significantly larger tumor masses and a higher rate of Ki-67 expression, see [Citation5] for additional detail. In the E2 cohort treated with Tam, PDX tumors were Tam sensitive, with a reduction in size and proliferation. When tumors were treated with Tam+E2+TH, tumor growth was partially attenuated when compared to E2+TH. However, it was not nearly as attenuated as E2+Tam. These data show that in the presence of TH, tamoxifen is less effective as an estrogen receptor antagonist. Further molecular characterization of our tumors shows that there appears to be a slight conversion in tamoxifen effects from a partial antagonist to a partial agonist as shown in with an increase in cell cycle regulatory protein expression, E2F1, phospho-ER(S118), cyclin A, and cyclin B protein expression. Here we wanted to further examine whether E+TH enhanced cell cycle regulatory gene expression using our treated ER+ PDX tumors as reported in [Citation5].
To explore the molecular mechanisms by which TH enhances E2-mediated tumor growth and Tam resistance, we performed RNA-seq analyses on tumors derived as described above and previously reported an unsupervised hierarchical clustering heat map for all treatment groups [Citation5]. In this report, we show selected RNA-seq analysis data derived from the UCD12-PDX tumors from the treatment groups E2 vs. E2 + TH, using a threshold cutoff (FDR ≤0.05 and |log2FC|≥1, ). We further provide a comparison of gene sets enriched in the tumors from the E2+TH treated cohort, relative to E2 alone, using GSEA methods. As shown in numerous pathways related to cell cycle control, mismatch repair, homologous recombination, and DNA replication were significantly enriched by TH in combination with E2, as compared to E2 alone (). More specifically, 42 genes were significantly upregulated in tumors of the E2+TH cohort relative to the E2 cohort alone, including MCM2, PTTG1, CCNB2, E2F2, ORC1, CCNE1, E2F1, MYC, CCNA2, and PCNA (). A selected gene expression heatmap of E2 vs. E2+TH treated tumors (n = 6 per cohort) is shown in . The data indicate significant increases in CDK1, CCNB1, CDKN2C, CDK7, and E2F1. The relative gene expression levels by treated tumor cells are also shown for selected genes in each treatment group (E2 vs. E2+TH, ). TH±E significantly enhanced the relative fold expression of several cell cycle regulatory genes (CCNB2, E2F1, MYC, CCNA2, E2F2, and PCNA, shown in ) as compared to the E2 alone tumors. These data further validate changes in selective genes induced by TH in the presence of E2 in a different model, shown in .
Figure 5. Thyroid hormone enhances expression of pro-tumorigenic pathways and activation of cell cycle regulatory genes. (a) unsupervised hierarchical-clustering analysis of mRNA expression profiles of UCD12-PDX treated tumors E2 (n = 6, blue line) and E2 + TH n = 6, green line). The heat map (Spearman correlation, Euclidean distance) represents log transformed Delta Ct values. Heat map colors correspond to mRNA expression as indicated in the color key red (over expressed) blue (downregulated). (b) gene set enrichment analysis with estrogen (E2) Induction (top) and estrogen and thyroid hormone (E2+TH, bottom). Bars are normalized enrichment scores. (c) cell cycle regulatory genes relative gene expression in E2 (n = 6) or E2 + TH (n = 6) treatment samples for the expression. (D) relative gene expression CCNB2, E2F1, MYC, CCNA2, E2F2, PCNA of samples from . (E &F) GSEA enrichment plot analysis of gene expression changes using KEGG_Cell_Cycle_Pathway (E) and BIOCARTA_Cell_Cycle_Pathway (F) in response to treatment with E2 alone or E2+TH. The top portion of the figure plots the enrichment score (ES) for each gene, where the bottom portion of the plot shows the value of the ranking metric moving down the list of ranked genes.
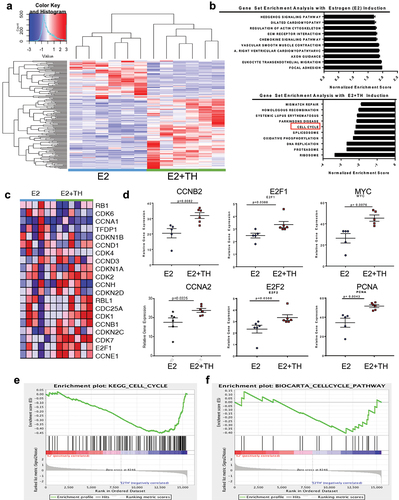
To further validate these findings, GSEA representative enrichment plots resulting from a comparison of E2 vs E2+TH±Tam treated PDX tumors were generated using two different methods, the KEGG Cell Cycle platform () and the BIOCARTA_Cell_Cycle_Pathway (). From the derived gene signatures, the data shows several genes involved in cell cycle regulation (E2F1, MYC, and CCND1), EMT (TGFB3 and SNA1) or thyroid/estrogen mediated signaling (FOS, TFF1, IGFBP4, GREB1, NRP1) that are distinctly different by treatment group (). The highest-fold changes in gene signatures included cell cycle regulatory genes and protein coding genes, for example calmodulin like 5 (CALML5), which if ubiquitinated in the nucleus has been associated with BC in premenopausal women [Citation41]). From the 32 genes highly expressed by tumors from TH+E2 cohort relative to E2 alone, other genes such as potassium channel tetramerization domain coding 3 gene (KCTD3), metallothionein 1X (MT1X), lysine Demethylase and Nuclear Receptor Corepressor (HR), and lactotransferrin (LTF) were also significantly upregulated (). Also notable, estrogen alone decreased the expression of estrogen receptor 1 (ESR1); however, in the presence of E2+TH+Tam ESR1 was significantly increased p = 0.0067 (). Our data also shows that TH added to E2 further enhanced the expression of MYC, E2F1, CCNB1, and CCNE1 ().
Figure 6. Thyroid hormone activates estrogen signaling and is predicted to interact with nuclear receptors. (a) Heat map of differentially expressed genes in tumors from mice treated with (E2, n = 6; E2 + TH, n = 6; E2 + Tam, n = 6; E2 + TH + Tam, n = 6). Expression as indicated in the color key red (over expressed) blue downregulated). Defined up regulated E2+TH genes are posted to the right. (b) relative fold change in overall genes modulated by E2+TH (n = 6) treated tumors relative to E2 (n = 6) treatment alone. (c) relative mRNA expression of MYC, E2F1, CCNB1, and CCNE1 in E2 vs E2 + TH treated tumors. (d) Heatmap of differentially expressed genes in four treatment groups described in 7A were monitored for expression of cell-cycle regulatory genes. Expression as indicated in the color key red (over expressed) blue (downregulated). Relative gene mRNA expression of cell-cycle regulatory genes that are up-regulated in the E2+TH group are shown in (below). Data represented as mean ± SEM (n = 6 per group).
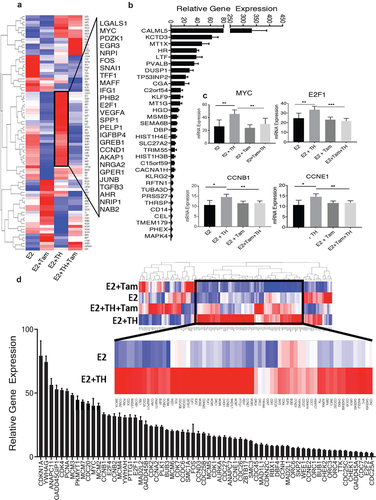
Finally, we performed RNA-seq analysis on E2 vs. TH+E2 treated murine tumor cohorts (n = 6) and examined tumor cells for cell cycle regulatory gene signatures. We identified over 64 cell cycle regulatory genes that were significantly enhanced by TH when added to E2 (). Up-regulated genes included: CDKN1A, CDK4, PCNA, MYC, CCNB1, E2F2, and E2F1; each has been previously identified in our cell culture studies described herein and (5). Examination of our RNAseq data from (E2+TH as compared to E2) treated mice-derived tumors also showed upregulation of key cell-cycle regulatory genes (cyclin A2, cyclin B1, cyclin B2, cyclin D3, and cyclin E2), DNA replication-associated genes (MCM 2, MCM 3, MCM 4, MCM5, MCM7), several estrogen-inducible E2F family members (E2F1, E2F2, and E2F4), genes that play a role in cell division (CDC25A, CDC25B, CDC25C, CDC26, CDCD27, CDC45), and genes in the CDK family that play a role in cell-cycle progression (CDK1, CDK2, CDK4, CDK7) (). E2+TH treated mouse derived PDX tumors displayed the highest expression of CDKN1A, cyclin-dependent kinase inhibitor 1A, which has previously been reported to be highly elevated in BC tissues at both mRNA and RNA levels [Citation42]. CDKN1A plays a role in inhibiting CKDs, required for G1 to S transition, and may promote a pro-tumorigenic and endocrine-resistant phenotype of BC [Citation43,Citation44]. Overall, the combined effects of E+TH further modulated key cell cycle genes abundant genetic modulation of key cell cycle regulatory genes in ER+BC cells, as shown our in vivo and in vitro models.
Discussion
Abundant historical, clinical, and basic research has demonstrated statistically significant comorbidity between thyroid disease and breast cancer [e.g., 17, 38, 39]. In the usual case, thyroid disease often precedes BC for many years [Citation14,Citation15,Citation40,Citation41]. With more widespread screening for thyroid disease, there has been an increase in the diagnosis of preclinical thyroid disorders, nodules, a rare carcinoma. For many of these patients, THRT is prescribed and may be taken for years, decades, or a lifetime. THRT administration for off-label use, including weight loss, depression, peri-menopausal symptoms, and metabolic dysregulation, has also increased over the last several decades. TH is currently administered to millions of patients worldwide, especially women. Given the long-recognized comorbidity between BC and thyroid disease (see Beatson et al. [Citation45]), as well as the increased frequency of both disorders as well as thyroid cancer in recent decades, the use of THRT may be ill-advised in SR+ BC patients, those with an increased risk of the disease, or in women without definitive hypothyroidism. Women on THRT, particularly with estrogen may benefit from increased or earlier screening from BC. A better understanding of mechanisms of interaction may also lead to novel strategies to target the untoward effects of THRT on estrogenic signaling in the breast while its systemic benefit is preserved.
In this report, we show additional and more mechanistic data related to the biologic and molecular impact of hormonal crosstalk between TH and E2 in ER+ BC cells. These data, and our prior report of its association with worse clinical outcomes and enhanced treatment resistance (5) further validate that only SR+ BC shows these interactions. This finding is seminal, as it subdivides BC patients into those who may or may not experience deleterious effects with hyperthyroidism or THRT. Additionally, in this report, we provide the first evidence that TH alone, or with E2, enhances tumor clonogenicity and decreases the ability of an ER+ BC cell to undergo programmed cell death, biological processes closely associated with tumor growth, treatment resistance, and disease progression. We also showed that TH, and its hormonal interactions with E2 and tamoxifen alter gene expression and signaling pathways to promote further cancer aggression and resistance consistent with an EMT phenotype. We further corroborated our in vitro data from cell culture-based studies ( and Supplemental Table S1) and in vivo PDX-derived murine tumors () and provided additional gene expression data showing broad categories of genes modulated by TH and its interaction with E2. Of the effects described above, these data support the conclusions of others that E2F1 and E2F family members play a prominent role as transcriptional activators and transcriptional repressors associated with tumor growth and cell survival in SR+ BC [Citation46–48]. In the present study, we better defined the role that E2F1 and E2F family members play in the hormonal interactions between TH:THR and E2:ER, which drive cancer cell proliferation and induce pro-carcinogenic signaling as supported by other reports [Citation49].
Hormone stimulation by either TH or E2 alone can enhance E2F1 transcriptional and translational expression in ER+ BC cell lines. Further, treating ER+ tumors with TH+E2 significantly upregulated both E2F1 and E2F2 mRNA levels in harvested tumors from an ER+ murine model. Key cell cycle genes upregulated in these interactions include E2F1, E2F2, MCM (−2, −3, −4, −6, −7), CHEK1, and CCN (E1, E2, B2, A2). Furthermore, our data suggest that E2F1 target genes altered by hormonal cross-talk in ER+ tumors may promote an aggressive phenotype, BC metastasis, and enhanced tumor growth and mortality [Citation49].
Although TH production and homeostaiss is necessary for embryogenesis and human life, the efffects of abnormal TH production or exogenous THRT on breast epithelial cell proliferation, BC risk, endocrine treatment response, and BC survival has not been wellstudied. We have reported that Stage I ER+ BC patients on THRT show a pro-prolifertive, anti-apoptotic and pro-cacinogenic effects on ER+ BC based on our in vivo, in vitro, and in silico data. These interactions were enhanced by concomitant E2, and further promoted by tamoxifen. These data and mechanistic interactions suggest that fulvestrant may be more optimal than tamoxifen in patients with elevated endogenous or exogenous TH, particularly in women with obesity (and thus higher peripheral conversion of E2 if post-menopausal or a history of E2 administration. Given that endocrine monotherapy has limited efficacy in molecularly high-risk BC patients (which we have associated with THRT use, chemotherapy or novel paradigms such as coupling fulvestrant with a cyclin-dependent kinase 4 and 6 (CDK4/6) inhibitor may be helpful. We hypothesize that combining tamoxifen with CDK4/6 inhibitors (palbociclib, ribociclib, abemaciclib) may attenuate estrogenic-mediated activity and cell cycle machinery induced by TH, possibly overcoming endocrine therapy resistance.
In summary, this report builds on our prior work showing critical hormonal interactions (cross-talk) between TH/THR and E2/ER in early-stage BC patients, in vivo, in vitro, and in silico models of BC. In aggregate, our studies have demonstrated clinically relevant hormonal interactions, revealed that only SR+ (ER+) patients are at risk, and identified key cell cycle regulatory and other pro-cancer genes that may be useful as biological tools or targets to improve BC patient outcomes. Clinical and public awareness of deleterious hormonal crosstalk, involving not just TH and E2 but also E2 and testosterone should be considered in assessing BC risk and screening strategies, and the administration of TH off-label for chronic disorders may be ill-advised. As shown by our data, TH may be especially dangerous in women receiving tamoxifen. Gene expression profiling to assess the prognostic risk of recurrence in SR+ BC patients may ultimately provide the most actionable data to guide treatment and predict outcomes.
Author Contributions
RW and AT designed all experiments. RW, HS, ZF, SE performed all the experiments. RW and SW performed all the statistical analyses using human BC cell lines and tumor data sets. We thank Zeying Fan. We thank Drs. Carol Sartorius and Britta Jacobson for PDX model and cell line used to perform in vivo experiments and RNA-seq experiments. RW, HM, and ACT performed and analyzed RNA-seq analysis. RW and AT wrote the manuscript. All authors discussed the results and edited the manuscript.
Supplemental Material
Download Zip (1.6 MB)Supplemental Material
Download Zip (3.4 MB)Acknowledgements
Support for the University of Colorado Cancer Center (UCCC) Genomics Shared Resource, UCCC DNA Sequence and Analysis Shared Resource Core, UCCC Biostatistics and Bioinformatics Shared Resource, UCCC Biorepository Core Facility, UCCC Tissue Biobanking and Histology Shared Resource, and UCCC flow cytometry core facility is funded in part by the NIH/NCI Cancer Center Support Grant P30CA043934. Grant support provided in part by Susan G Komen for the Cure K100575 to R Wahdan-Alaswad, S Edgerton, and A Thor; ACS-IRG 16-184-56 R Wahdan-Alaswad from the American Cancer Society; CCL-C92110 RSW and AWD#222569-RW from the Colorado Cancer League and Mary Kay Ashe Foundation 051-04 A. Thor.
Disclosure statement
No potential conflict of interest was reported by the author(s).
Supplementary material
Supplemental data for this article can be accessed online at https://doi.org/10.1080/15384101.2023.2249702
Additional information
Funding
References
- Travis RC, Key TJ. Oestrogen exposure and breast cancer risk. Breast Cancer Res. 2003;5(5):239–247. doi: 10.1186/bcr628
- Cuzick J, Sestak I, Forbes JF, et al. Anastrozole for prevention of breast cancer in high-risk postmenopausal women (IBIS-II): an international, double-blind, randomised placebo-controlled trial. Lancet. 2014;383(9922):1041–1048. doi: 10.1016/S0140-6736(13)62292-8
- Goss PE, Ingle JN, Alés-Martínez JE, et al. Exemestane for breast-cancer prevention in postmenopausal women. N Engl J Med. 2011;364(25):2381–2391. doi: 10.1056/NEJMoa1103507
- Stickeler E, Fehm T, Schütz F, et al. Aromatase Inhibitors in the prevention of breast cancer. Breast Care. 2015;10(2):141–142. doi: 10.1159/000430877
- Wahdan-Alaswad RS, Edgerton SM, Salem H, et al. Exogenous thyroid hormone is associated with shortened survival and upregulation of high-risk gene expression profiles in steroid receptor–positive breast cancers. Clin Cancer Res. 2021;27(2):585–597. doi: 10.1158/1078-0432.CCR-20-2647
- Liu YC, Yeh CT, Lin KH. Molecular functions of thyroid hormone signaling in regulation of cancer progression and anti-apoptosis. Int J Mol Sci. 2019;20:20(20. doi: 10.3390/ijms20204986
- Cristofanilli M, Yamamura Y, Kau S-W, et al. Thyroid hormone and breast Carcinoma. Primary hypothyroidism is associated with a reduced incidence of primary breast carcinoma. Cancer. 2005;103:1122–1128. doi: 10.1002/cncr.20881
- Hercbergs A, Mousa SA, Leinung M, et al. Thyroid hormone in the clinic and breast cancer. Horm Cancer. 2018;9(3):139–143. doi: 10.1007/s12672-018-0326-9
- Davis PJ, Davis FB, Mousa SA. Thyroid hormone-induced angiogenesis. Curr Cardiol Rev. 2009;5(1):12–16. doi: 10.2174/157340309787048158
- Berta E, Lengyel I, Halmi S, et al. Hypertension in thyroid disorders. Front Endocrinol. 2019;10:482. doi: 10.3389/fendo.2019.00482
- Diab N, Daya NR, Juraschek SP, et al. Prevalence and risk factors of thyroid dysfunction in older adults in the community. Sci Rep. 2019;9(1):13156. doi: 10.1038/s41598-019-49540-z
- Brown AP, Chen J, Hitchcock YJ, et al. The risk of second primary malignancies up to three decades after the treatment of differentiated thyroid cancer. J Clin Endocrinol Metab. 2008;93(2):504–515. doi: 10.1210/jc.2007-1154
- Nielsen SM, White MG, Hong S, et al. The breast–thyroid cancer link: A systematic review and meta-analysis. Cancer Epidemiol Biomarkers Prev. 2016;25(2):231–238. doi: 10.1158/1055-9965.EPI-15-0833
- Tosovic A, Becker C, Bondeson A-G, et al. Prospectively measured thyroid hormones and thyroid peroxidase antibodies in relation to breast cancer risk. Int J Cancer. 2012;131(9):2126–2133. doi: 10.1002/ijc.27470
- Tosovic A, Bondeson A-G, Bondeson L, et al. Prospectively measured triiodothyronine levels are positively associated with breast cancer risk in postmenopausal women. Breast Cancer Res. 2010;12(3):R33. doi: 10.1186/bcr2587
- Glushakov RI, Proshin SN, Tapil’skaya NI. The incidence of breast tumor during experimental hyperthyroidism. Bull Exp Biol Med. 2013;156(2):245–247. doi: 10.1007/s10517-013-2322-y
- Chen S, Wu F, Hai R, et al. Thyroid disease is associated with an increased risk of breast cancer: a systematic review and meta-analysis. Gland Surg. 2021;10(1):336–346. doi: 10.21037/gs-20-878
- Ortega-Olvera C, Ulloa-Aguirre A, Ángeles-Llerenas A, et al. Thyroid hormones and breast cancer association according to menopausal status and body mass index. Breast Cancer Res. 2018;20(1):94. doi: 10.1186/s13058-018-1017-8
- Wu CC, Yu Y-Y, Yang H-C, et al. Levothyroxine use and the risk of breast cancer: a nation-wide population-based case–control study. Arch Gynecol Obstet. 2018;298(2):389–396. doi: 10.1007/s00404-018-4837-y
- Weng CH, Okawa ER, Roberts MB, et al. Breast cancer risk in postmenopausal women with Medical history of thyroid disorder in the women’s health initiative. Thyroid: Offic J Am Thyroid Association. 2020;30(4):519–530. doi: 10.1089/thy.2019.0426
- Fang Y, Yao L, Sun J, et al. Does thyroid dysfunction increase the risk of breast cancer? A systematic review and meta-analysis. J Endocrinol Invest. 2017;40(10):1035–1047. doi: 10.1007/s40618-017-0679-x
- Weng CH, Chen Y-H, Lin C-H, et al. Thyroid disorders and breast cancer risk in Asian population: a nationwide population-based case–control study in Taiwan. BMJ Open. 2018;8(3):e020194. doi: 10.1136/bmjopen-2017-020194
- Yu F, Ma J, Huo K, et al. Association between breast cancer and thyroid cancer: a descriptive study. Transl Cancer Res. 2017;6(2):393–401. doi: 10.21037/tcr.2017.03.44
- Kumar A, Klinge CM, Goldstein RE. Estradiol-induced proliferation of papillary and follicular thyroid cancer cells is mediated by estrogen receptors alpha and beta. Int J Oncol. 2010;36(5):1067–1080. doi: 10.3892/ijo_00000588
- de Vathaire F, Hardiman C, Shamsaldin A, et al. Thyroid carcinomas after irradiation for a first cancer during childhood. Arch Intern Med. 1999;159(22):2713–2719. doi: 10.1001/archinte.159.22.2713
- Bolf EL, Sprague BL, Carr FE. A Linkage between thyroid and breast cancer: a common etiology?. Cancer Epidemiol Biomarkers Prev. 2019;28(4):643–649. doi: 10.1158/1055-9965.EPI-18-0877
- Wilkenfeld SR, Lin C, Frigo DE. Communication between genomic and non-genomic signaling events coordinate steroid hormone actions. Steroids. 2018;133:2–7. doi: 10.1016/j.steroids.2017.11.005
- Vellon L, Menendez JA, Lupu R. A bidirectional “alpha(v)beta(3) integrin-ERK1/ERK2 MAPK” connection regulates the proliferation of breast cancer cells. Mol Carcinog. 2006;45(10):795–804. doi: 10.1002/mc.20242
- Tang HY, Lin H-Y, Zhang S, et al. Thyroid hormone causes mitogen-activated protein kinase-dependent phosphorylation of the nuclear estrogen receptor. Endocrinology. 2004;145(7):3265–3272. doi: 10.1210/en.2004-0308
- Davis PJ, Lin H-Y, Mousa SA, et al. Overlapping nongenomic and genomic actions of thyroid hormone and steroids. Steroids. 2011;76(9):829–833. doi: 10.1016/j.steroids.2011.02.012
- Kabos P, Finlay-Schultz J, Li C, et al. Patient-derived luminal breast cancer xenografts retain hormone receptor heterogeneity and help define unique estrogen-dependent gene signatures. Breast Cancer Res Treat. 2012;135(2):415–432. doi: 10.1007/s10549-012-2164-8
- Astashchanka A, Shroka TM, Jacobsen BM. Mucin 2 (MUC2) modulates the aggressiveness of breast cancer. Breast Cancer Res Treat. 2019;173(2):289–299. doi: 10.1007/s10549-018-4989-2
- D’Amato NC, Gordon MA, Babbs B, et al. Cooperative Dynamics of AR and ER activity in breast cancer. Mol Cancer Res. 2016;14(11):1054–1067. doi: 10.1158/1541-7786.MCR-16-0167
- Wahdan-Alaswad R, Fan Z, Edgerton SM, et al. Glucose promotes breast cancer aggression and reduces metformin efficacy. Cell Cycle. 2013;12(24):3759–3769. doi: 10.4161/cc.26641
- Siddiqui RA, Zerouga M, Wu M, et al. Anticancer properties of propofol-docosahexaenoate and propofol-eicosapentaenoate on breast cancer cells. Breast Cancer Res. 2005;7(5):R645–54. doi: 10.1186/bcr1036
- Wahdan-Alaswad RS, Cochrane DR, Spoelstra NS, et al. Metformin-induced killing of triple-negative breast cancer cells is mediated by reduction in fatty acid synthase via miRNA-193b. Horm Cancer. 2014;5(6):374–389. doi: 10.1007/s12672-014-0188-8
- Kim D, Langmead B, Salzberg SL. HISAT: a fast spliced aligner with low memory requirements. Nat Methods. 2015;12(4):357–360. doi: 10.1038/nmeth.3317
- Robinson MD, McCarthy DJ, Smyth GK. edgeR: a Bioconductor package for differential expression analysis of digital gene expression data. Bioinformatics. 2010;26(1):139–140. doi: 10.1093/bioinformatics/btp616
- Subramanian A, Tamayo P, Mootha VK, et al. Gene set enrichment analysis: a knowledge-based approach for interpreting genome-wide expression profiles. Proc Natl Acad Sci U S A. 2005;102(43):15545–15550. doi: 10.1073/pnas.0506580102
- Kenny PA, Lee GY, Myers CA, et al. The morphologies of breast cancer cell lines in three-dimensional assays correlate with their profiles of gene expression. Mol Oncol. 2007;1(1):84–96. doi: 10.1016/j.molonc.2007.02.004
- Debald M, Schildberg FA, Linke A, et al. Specific expression of k63-linked ubiquitination of calmodulin-like protein 5 in breast cancer of premenopausal patients. J Cancer Res Clin Oncol. 2013;139(12):2125–2132. doi: 10.1007/s00432-013-1541-y
- Wei CY, Tan Q-X, Zhu X, et al. Expression of CDKN1A/p21 and TGFBR2 in breast cancer and their prognostic significance. Int J Clin Exp Pathol. 2015;8(11):14619–14629.
- Cheng X, Xia W, Yang J-Y, et al. Activation of p21(CIP1/WAF1) in mammary epithelium accelerates mammary tumorigenesis and promotes lung metastasis. Biochem Biophys Res Commun. 2010;403(1):103–107. doi: 10.1016/j.bbrc.2010.10.126
- Hawthorne VS, Huang W-C, Neal CL, et al. ErbB2-mediated src and signal transducer and activator of transcription 3 activation leads to transcriptional up-regulation of p21Cip1 and chemoresistance in breast cancer cells. Mol Cancer Res. 2009;7(4):592–600. doi: 10.1158/1541-7786.MCR-08-0316
- Beatson GT. On the treatment of inoperable cases of carcinoma of the mamma: suggestions for a new method of treatment, with illustrative cases. Trans Med Chir Soc Edinb. 1896;15:153–179.
- Attwooll C, Lazzerini Denchi E, Helin K. The E2F family: specific functions and overlapping interests. EMBO J. 2004;23(24):4709–4716. doi: 10.1038/sj.emboj.7600481
- Nevins JR. The Rb/E2F pathway and cancer. Hum Mol Genet. 2001;10(7):699–703. doi: 10.1093/hmg/10.7.699
- Trimarchi JM, Lees JA. Sibling rivalry in the E2F family. Nat Rev Mol Cell Biol. 2002;3(1):11–20. doi: 10.1038/nrm714
- Hollern DP, Swiatnicki MR, Rennhack JP, et al. E2F1 drives breast cancer metastasis by regulating the target gene FGF13 and altering cell migration. Sci Rep. 2019;9(1):10718. doi: 10.1038/s41598-019-47218-0