
 ?Mathematical formulae have been encoded as MathML and are displayed in this HTML version using MathJax in order to improve their display. Uncheck the box to turn MathJax off. This feature requires Javascript. Click on a formula to zoom.
ABSTRACT
Identifying robust breast cancer subtypes will help to reveal the cancer heterogeneity. However, previous breast cancer subtypes were based on population-level quantitative gene expression, which is affected by batch effects and cannot be applied to individuals. We detected differential gene expression, genomic, and epigenomic alterations to identify driver differential expression at the individual level. The individual driver differential expression reflected the breast cancer patients’ heterogeneity and revealed four subtypes. Mesenchymal subtype as the most aggressive subtype harbored deletion and downregulated expression of genes in chromosome 11q23 region. Specifically, silencing of the SDHD gene in 11q23 promoted the invasion and migration of breast cancer cells in vitro by the epithelial–mesenchymal transition. The immunologically hot subtype displayed an immune-hot microenvironment, including high T-cell infiltration and upregulated PD-1 and CTLA4. Luminal and genomic-unstable subtypes showed opposite macrophage polarization, which may be regulated by the ligand–receptor pairs of CD99. The integration of multi-omics data at the individual level provides a powerful framework for elucidating the heterogeneity of breast cancer.
Introduction
Breast cancer is a highly heterogeneous cancer and seriously influences women’s health [Citation1]. The discovery of molecular subtypes is crucial for precision therapy and improving survival for breast cancer patients. Current classification systems primarily utilize gene expression profiles to categorize breast cancer into molecular subtypes, each with its own prognosis and therapeutic implications [Citation2]. However, gene expression is inherently dynamic and sensitive to the noise and influenced by batch effects and platform types [Citation3]. Besides, the clustering-based approaches need a pre-trained dataset for prediction of new samples, making the assignment of subtype to a tumor highly dependent on the composition of other tumors in a reference set [Citation4]. Paquet and Hallett developed a method that compared expression measurements of subtype-specific genes to the levels of other genes within each tumor sample [Citation5]. This method has indicated that the gene expression rank has superior robustness in different technologies. Relative expression orderings (REOs) of gene pairs are within-sample orders between two genes, which are stable in normal and widely reversed in the cancer condition [Citation6]. An important application of REOs is to detect individual differential expression based on reversed REOs within a single sample. The REO-based methods allow researchers to explore differentially expressed or methylated genes and pave the way to connect multi-omics alterations at the individual level [Citation7,Citation8].
The development of breast cancer is accompanied with multi-omics molecular abnormalities, such as the genome, epigenome, and transcriptome. Patients with TP53 mutations or CCND1 amplification showed differential expression of the corresponding genes [Citation9,Citation10]. The BRCA1 gene is also frequently mutated or hypermethylated with reduced mRNA expression in breast cancer [Citation11]. With the advantage of high-throughput sequencing and large-scale studies, integrating multi-omics data has emerged as a comprehensive method for the prediction of clinical outcomes and identification of subtypes in cancer studies [Citation12]. Dimensionality reduction and unsupervised clustering methods have been widely used to analyze multi-omics data, such as The Cancer Genome Atlas (TCGA) [Citation13,Citation14]. These research processed each omics data as a separate entity and performed analyses on population-level gene expression, which is affected by the batch effects [Citation15]. Krug et al. yielded drivers by significant correlation between copy number alteration and gene expression at population-level [Citation16]. However, this approach might overlook significant alterations in a subset of samples.
To reveal molecular subtypes of breast cancer at the individual level, we propose a framework for integrating individual multi-omics data. Here, we make a supposition that differentially expressed genes with mutation, copy number alteration (CNA) or DNA methylation play driver roles in a breast cancer patient [Citation17]. For the convenience of description, driver differential expression (DDE) refers to these differentially expressed genes. Based on DDE, we can reveal novel breast cancer subtypes, which may provide a new insight into the heterogeneity of breast cancer.
Material and methods
Pre-processing of individual multi-omics profile
Table S1 shows the statistics of samples and probes/genes in TCGA multi-omics data. See Supplementary Information for details.
Permutation test
We implemented the “curveball” algorithm which provides a fast null model for binary matrices according to Strona et al. [Citation18]. In each permutation, the trade between two genes was performed for five times the number of genes. For each molecular characterization platform, the permutation process was repeated to produce 1,000 random profiles, respectively. Then, the integration process was repeated for 10,000 times to obtain a random DDE profile.
Cancer-related genes, transcription factor, protein–protein interaction and immune checkpoint genes
Cancer-related genes were compiled from the genes defined by the Cancer Gene Census [Citation19]. Transcription factor and target genes were downloaded from EMTRegulome [Citation20]. Protein–protein interactions (PPIs) were downloaded from PathwayCommon version 12 [Citation21]. PPIs labeled as “interact with” were used for constructing network. Immune checkpoint genes were obtained from Auslander et al. [Citation22].
Identification of breast cancer subtypes and subtype-specific genes
We retained DDEs observed in over 10% of breast cancer patients for hierarchical clustering using Ward linkage and Euclidean distance. To pinpoint subtype-specific genes, we began with the hypergeometric test, identifying individual DDEs over-represented in each subtype (P < 0.05). Subsequently, differential gene expressions unique to a single subtype were deemed subtype-specific genes via the Fisher’s exact test. We used Multiple Correspondence Analysis (MCA) to detect the top subtype-specific genes with the FactoMineR R package. Both samples and subtype-specific genes appeared as points within a two-dimensional Euclidean space. The center points for subtypes were established using the median sample coordinates in each subtype. The formula to score the distance from a gene to a subtype i was as follows:
where is the Euclidean distance between a gene point and the center point;
is the number of breast cancer subtypes, which equals four in this study.
Classification of the independent dataset using the random forest
We individualized the bulk expression profile from GSE176078 using the RankComp method. This was done with parameters and adjacent samples of TCGA identical to those in preprocessing. Initially, TCGA was split randomly into training and validation datasets in a seven-to-three ratio, maintaining the relative proportions of the four subtype labels. After this, a parameter grid consisting of “mtry” and “ntree” trained the random forest. The CVM R package evaluated the model’s performance in the test dataset through a confusion matrix.
Single-cell analysis using Seurat
See Supplementary Information for details.
Cell-Cell communication analysis
See Supplementary Information for details.
Cell culture and transfection
See Supplementary Information for details.
Real-time quantitative RT-PCR
See Supplementary Information for details.
Western blot
See Supplementary Information for details.
Wound-healing assay
See Supplementary Information for details.
EdU cell proliferation assay
See Supplementary Information for details.
Cell migration and invasion assays
See Supplementary Information for details.
Immunofluorescence staining
See Supplementary Information for details.
Statistics
The statistical analyses in this study were performed by R 4.0.4. For categorical variables, the Fisher’s exact test and the Chi-squared test were used to analyze contingency tables. For quantitative data, Student’s two-sided T-test and Wilcoxon’s rank-sum test were used to estimate statistical significance for normally distributed variables and non-normally distributed variables, respectively. For comparisons of more than two groups, Kruskal–Wallis test was used as nonparametric methods.
Results
Analytic pipeline
Figure S1 describes the flowchart of our study. First, datasets from TCGA breast cancer by four molecular characterization platforms were downloaded for normalization and pre-processed to obtain multi-omics alterations in individuals (step1 in Figure S1 and Table S1). We identified individual DDE in patients using the following patterns: upregulation of expression is consistent with copy number gain and hypomethylation; conversely, copy number deletion and hypermethylation are consistent with downregulation; somatic mutations are consistent with differential expression regardless of the direction (step2 in Figure S1). Based on the individual DDE, we identified breast cancer subtypes using the hierarchical clustering. Subtypes were characterized by subtype-specific genes, clinical features, and immune microenvironment. Key subtype-specific genes were further validated by biological experiments (step3 in Figure S1). Finally, we explored interactions between immune cells and tumor cells at the single-cell level in an independent dataset (step4 in Figure S1).
Evaluating the reliability of individual driver differential expression
Using 132 adjacent breast samples from TCGA as controls, we identified individual differential expression for 960 breast cancer samples. Each sample had an average of 1,926 differentially expressed genes, 426 genes with CNA, five genes with non-silent mutations, and 1,233 differentially methylated genes. Furthermore, 7.3% of differentially expressed genes per sample were identified as individual DDE. The number of individual DDE was positively correlated with their number of individually differentially expressed genes (R = 0.73, P < 2.2e-16, Pearson correlation test, ). JAM3, CCL11, and SCN4B showed alterations in over 50% of samples (). Differential expression of known oncogenes in breast cancer, such as ATM and BRCA2, was predominantly driven by CNA (73.23%) and DNA methylation (84.62%), respectively (). Only differential expression of TP53 was associated with mutations (). Genes with DDE were enriched in known cancer-related genes and transcription factors (P < 0.05, one-sided Fisher’s exact test, ). Additionally, individual DDEs were enriched in top 10% of genes with the highest degree, betweenness, and closeness in PPI network (P < 0.05, Fisher’s exact test, ).
Figure 1. Assessing the reliability of individual DDE. (a) scatter plot with marginal density curves showing the number of differential expression and DDE. (b) scatter pie plot illustrating fractions of mutations, CNA, and differential methylation for genes. (c) ternary plot analyzing the percentage of the mutation, CNA and differential methylation of genes. (d) odds ratio of DDE in census cancer genes, TF, and top genes in PPI network. (e) intersection between non-DDE and targets of transcription factors with DDE for each sample. The regulatory model is showed in central circle. The size of intersection and P-values are showed by bar plots in the inner and outer ring, respectively. (f) line charts displaying the ratios of deletions to gains and hypomethylation to hypermethylation in upregulation, downregulation, and non-differential expression. (g-l) distribution of interaction sizes between differential expression and genomic or epigenomic alterations based on permutation analysis. Black arrows indicate the actual intersection sizes. (m) ratio of mutation types within upregulation and downregulation. P-values were calculated by the Wilcoxon rank-sum test. (n) percentage of mutation types in non-differentially expressed and downregulated TP53.
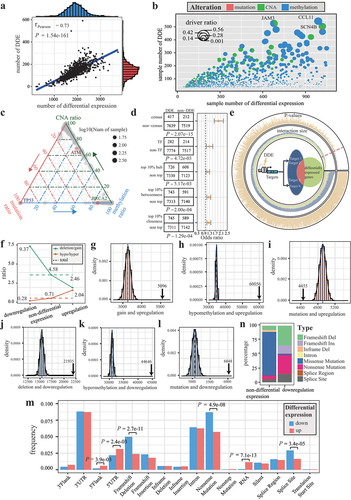
We found that individual differential expression without genomic or epigenomic alterations was significantly enriched in target genes of transcription factors with DDE in 93.75% of breast cancer patients (P < 0.05, hypergeometric test, ). DNA hypermethylation and copy number deletion were commonly seen in individually downregulated genes. In contrast, upregulated genes were often associated with hypomethylation or copy number gains (). The correlation between differential expression and CNA and methylation was stronger than the permutation (P < 0.05, permutations test, ). Notably, there was a significant negative correlation between mutations and upregulation (P < 0.05, permutations test, ). We found significantly more mutations at the 5’ end of upregulated genes when considering the effect of mutations on proteins (). Mutations that affect transcript integrity, such as frameshift deletion and splice site mutations, were enriched in downregulated genes. The TP53 gene exemplified the relationship between mutation type and differential expression. In cases with downregulated TP53, the frameshift deletion mutation emerged as the predominant type (34.94%), succeeded by nonsense mutation (32.53%) ().
Identifying breast cancer subtypes with distinct molecular features
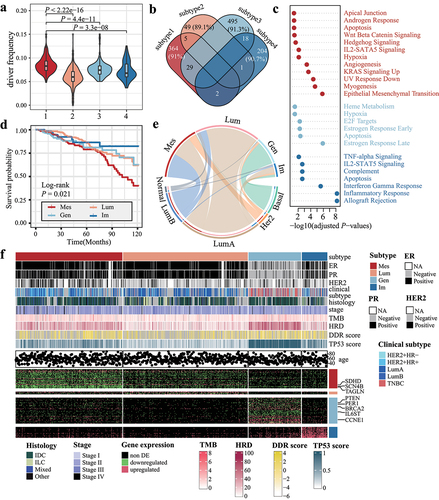
Based on the DDE found in at least 10% of the samples and the Dindex score, we identified four optimal subtypes (Figure S2). Of the 960 breast cancer samples analyzed, 331 belonged to subtype 1, 387 to subtype 2, 163 to subtype 3, and 79 to subtype 4.
Patients in subtype 1 had the highest median fraction of DDE (8.3%) among subtypes (). For each subtype, 91.0%, 89.1%, 91.3%, and 90.7% of the over-represented genes were specific, respectively (). Subtype-specific genes were enriched in several cancer hallmark pathways except for subtype 2-specific genes (adjusted P < 0.05, hypergeometric test, ). Subtype 1-specific genes were enriched in epithelial–mesenchymal transition (EMT) and angiogenesis. Notably, subtype 4-specific genes were observed to be enriched in immune-related pathways, including inflammatory and interferon gamma response. Within subtype 3, there was a noticeable differential expression of cancer hallmark genes associated with DNA damage and repair (DDR), including PTEN and BRCA2 ( bottom). Additionally, 87.7% of patients in subtype 3 had TP53 mutation regardless of TP53 expression (Figure S3). Subtype 3 also had higher DNA instability-related score, including non-silent tumor mutation burden, homologous recombination deficiency score, DDR score, and TP53 score (P < 0.001, Kruskal–Wallis test, and Table S2). Taken together, we named subtype 1 to subtype 4 as mesenchymal (Mes), luminal (Lum), genomic-unstable (Gen), and immunologically hot (Im).
Figure 2. Distinct molecular and clinical features among breast cancer subtypes. (a) violin plot showing the distribution of DDE fraction across breast cancer subtypes. (b) the relationships among over-represented genes are displayed in a venn plot. Percentages in each tile represent the proportion of subtype-specific genes. (c) GO functional enrichment analysis for subtype-specific genes. (d) Kaplan–Meier survival curves for subtypes. (e) the Chord plot displays the number of samples shared between our subtypes (upper semicircle) and PAM50 classification (lower semicircle). The size of the arc is proportional to the number of samples. (f) summary of clinical features (top) and subtype-specific genes (bottom) corresponding to each subtype.
Prognostic and pathological characterizations of breast cancer subtypes
The four breast cancer subtypes are correlated with 10-year overall survival (OS) (P = 0.021, Log-rank test, ). The Mes subtype has the worst prognosis among the four subtypes, while the Im subtype had a more favorable prognosis (OS HR = 2.3, 95% CI: [1.04, 5.0], P = 0.04, univariate Cox hazard). However, the Kaplan – Meier survival analysis indicated that the differences in 10-year survival among PAM50 subtypes were marginal significant (P = 0.087, Log-rank test, Figure S4). Basal breast cancer made up 88.3% of Gen samples. 82.3% of the Lum samples were identified as luminal-A. The Im subtype was diverse, comprising luminal-A, basal, her2-positive, and normal-like (accounted for 46.8%, 19.0%, 15.2%, and 10.1%, respectively). The Mes subtype included both luminal-A and luminal-B samples (38.7% and 45.2%, ). In a combined validation with 7,356 breast cancer samples, the Gen subtype exhibited the worst overall survival, while the Mes subtype demonstrated the shortest distant metastasis-free survival (Figure S5A-D). The Mes and Gen subtypes were also observed to have worse recurrence-free survival when compared to the Lum and Im subtypes (Figure S5E-F). In terms of the association with PAM50 classification, Luminal-A constituted 75.11% of the Lum subtype (Figure S6). The overlap of samples between the Gen subtype and basal subtype reached 89.93% of the Gen subtype.
Moreover, there were significant differences in the pathological ER, PR, and HER2 status across our subtypes (P < 0.001, top). Specifically, we found that patients in the Gen subtype tended to be triple-negative, ductal breast cancer, and younger than other subtypes (Table S2). Moreover, the Mes subtype was associated with stage IV and mixed ductal and lobular carcinoma, consistent with the worst survival.
Deletion of chromosome 11q23 region is a prognostic factor in breast cancer
Using the MCA and the frequency of differential expression, we identified the top subtype-specific genes for each subtype. The distances in MCA between samples and DDE offer a measure of their similarity. In the two-dimensional plot, the four subtypes are displayed, with Mes subtype-specific genes labeled (). The VIM gene and JAM3 gene are cell adhesion-related genes and associated with the functional enrichment of the Mes subtype. indicates that subtype-specific genes in Lum and Im subtype are dominated by differential methylation. In contrast, Mes and Gen subtypes had CNA-driven differential expression. We found that four Mes subtype-specific genes, including TAGLN, SCN4B, CRYAB, and SDHD, were located on the long arm of chromosome 11 (11q23) and driven by copy number deletion ().
Figure 3. Top subtype-specific genes reveal prognosis-related DDE. (a) the MCA plot illustrates a global distance between subtype-specific genes and samples. The top 10 Mes subtype-specific genes are labeled and represented by black points. (b) scatter pie plot illustrates the distribution of the top 10 subtype-specific genes for each subtype; the coordinates of the pies indicate the frequencies of differential expression and DDE. (c) OncoPrint diagram displays the DDE patterns for four Mes subtype-specific genes located in the chromosome 11q23 region. (d) Half-violin plots showing the expression levels of Mes subtype-specific genes in the 11q23 region. (e) Kaplan–Meier survival curves and risk tables for patients in the METABRIC dataset, categorized based on the presence or absence of deletions in the 11q23 region.
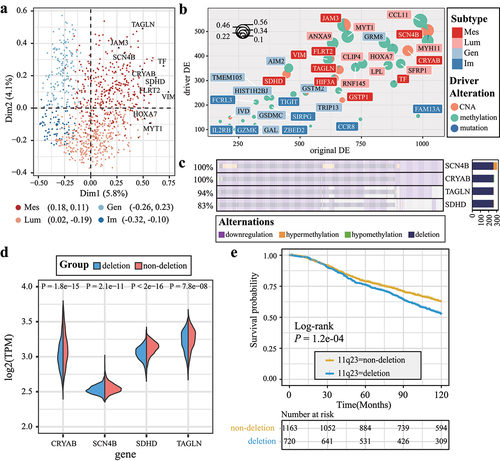
To confirm the survival relevance of 11q23 deletion, we explored CNA and gene expression from the METABRIC breast cancer dataset. Patients with 11q23 deletion exhibited worse survival (P = 1.2e-04, Log-rank test, ). Furthermore, TAGLN, SCN4B, CRYAB, and SDHD were all differentially downregulated in 11q23-deleted samples when compared to samples with diploid 11q23 (P < 0.001, Wilcoxon rank-sum test, ). Specifically, the SDHD gene was the most significantly downregulated gene among four genes (P < 2.2e-16, Wilcoxon rank-sum test, ).
Subtype-specific drivers promote cancer metastasis by inducing EMT
We conducted in vitro assays on Mes subtype and Gen subtype-specific genes, SDHD and GAL, to investigate their potential roles as drivers. qRT-PCR showed that silencing SDHD by siRNA led to decreased ZO-1 and increased CDH2 (N-Cadherin) in MCF-7 cell line (). Inhibition of SDHD in MCF-7 cells significantly reduced the protein level of epithelial markers, including ZO-1, E-Cadherin and upregulated mesenchymal marker, N-Cadherin (). Double immunofluorescence analysis also showed that si-SDHD could promote the EMT progression (). These results suggested that silencing SDHD induces EMT. In addition, through the EdU assay, we found that silencing SDHD significantly enhanced the proliferation ability of MCF-7 cells (). Moreover, silencing SDHD promoted wound healing and increased the migration and invasion of MCF-7 cells ().
Figure 4. SDHD promotes invasion and migration of MCF-7 cells. (a) qRT-PCR showed knockdown effect of the si-SDHD and expression of EMT related markers. n = 6. (b) the effect of si-SDHD on EMT related protein level was evaluated by western blot analysis. n = 3. (c) immunofluorescence staining of ZO-1 and N-cadherin suggested the mesenchymal transition after silencing of SDHD. bar = 20 μm; n = 5. (d) EdU fluorescent staining indicated that si-SDHD promoted the proliferation of MCF-7 cell. bar = 50 μm; n = 5. (e-f) wound healing (bar = 200 μm; n = 6) and transwall assays (bar = 100 μm; n = 5) showed that si-SDHD facilitated cell migration and invasion. (g-h) overexpression of SDHD and relative expression of ZO-1 and CDH2 were confirmed by qRT-PCR (n = 6) and western blot (n = 3). (i) ZO-1 and N-cadherin expression in MCF-7 were assessed by immunofluorescence. bar = 20 μm; n = 5. (j) the proliferation ability of MCF-7 was analyzed by EdU experiment. bar = 50 μm; n = 5. (k-l) wound healing assays (bar = 200 μm; n = 6) and transwall (bar = 100 μm; n = 5) were performed to investigate the cell migration after transfected by SDHD. *P < 0.05; **P < 0.01.
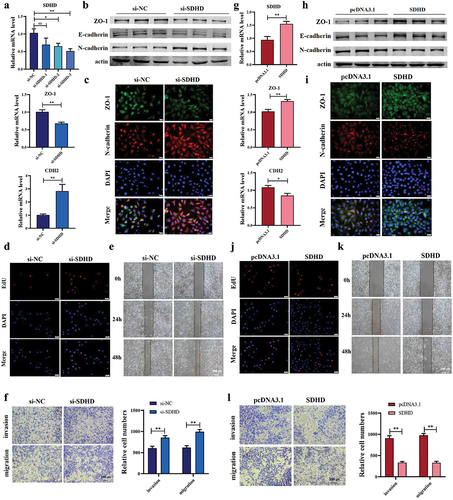
Next, we transfected SDHD overexpression plasmid into MCF-7 cells to further determine its effect on EMT progress. As shown in , overexpression of SDHD increased the expression of epithelial markers, ZO-1, and E-cadherin, whereas inhibited the expression of mesenchymal marker N-cadherin. Furthermore, the enhanced expression of SDHD inhibited the EMT and proliferation in MCF-7 cells (). We also found that forced expression of SDHD blunted the wound healing, invasion, and migration of MCF-7 cells ().
To evaluate the role of GAL, we transfected MDA-MB-231 cells with a GAL overexpression plasmid. qRT-PCR confirmed the GAL overexpression in MDA-MB-231 cells (Figure S7A). The overexpression of GAL led to a decrease in the relative mRNA expression levels of ZO-1 and an increase in CDH2 (N-Cadherin) expression (Figure S7B). Additionally, transwell assays revealed that the overexpression of GAL promoted invasion and migration of breast cancer cells (Figure S7C). Collectively, these data suggest that upregulation of GAL is associated with the metastatic capability of Gen subtype breast cancer.
Different immune cell infiltration in breast cancer subtypes
Tumor purity varied across subtypes (P < 0.001, Wilcoxon rank-sum test, ). The Im subtype displayed the lowest tumor purity, the highest stromal score, and immune score (P < 0.001, Wilcoxon rank-sum test, ). Our analysis of the relative immune cell fractions showed high infiltration of lymphocytes, especially T cells and B cells, in all Im samples. However, the infiltration of macrophages was low (). There was a significant negative correlation between the relative fractions of lymphocytes and macrophages in all samples (R = −0.87, P < 2.2e-16, Pearson correlation). Im samples appeared in the right upper corner, indicating a hot immune microenvironment with both more macrophages and CD8-positive T cells (). Specifically, the Mes and Lum subtypes showed higher infiltration of M2 macrophages than the Im subtype (Figure S8). Furthermore, there was a significant negative correlation between M1 and M2 macrophages in all subtypes, except for the Im subtype (P < 0.05, Pearson correlation, ). The Tumor Immune Dysfunction and Exclusion (TIDE) indicated that the Im subtype displayed higher TIDE scores and a lower responding ratio (Figure S9A and Table S4). Similarity Analysis (SA) matrix of Submap revealed a trend wherein the Gen and Im subtypes appeared to be more enriched within the CR/PR response categories (Figure S9B).
Figure 5. Breast cancer subtypes are enriched in different tumor-infiltrating immune cells. (a-b) the violin plots show the estimation of tumor purity using the (a) ESTIMATE and (b) ABSOLUTE method. The x-axes represent the four breast cancer subtypes, and the y-axes represent tumor purities. (c) immune scores and (d) stromal scores are estimated using the ESTIMATE method for breast cancer subtypes. (e) the heatmap displays the aggregated relative fraction of immune cell types. (f) the scatter plot shows the ratio of CD8+ T cell to macrophage for breast cancer subtypes. Correlation coefficients for each subtype are displayed in the upper-left and right-lower corner. (g) the scatter plot illustrates the ratio of M1 to M2 macrophage fraction for breast cancer subtypes. (h) the performance of the random forest model is displayed using a confusion matrix. The overall percentages are in the middle of each tile. (i) predicted subtype labels, clinical subtype, ER, and HER2 status of bulk samples from GSE180286. (j) the proportions of M1 and M2 macrophage. Gen samples are indicated with asterisks at the bottom.
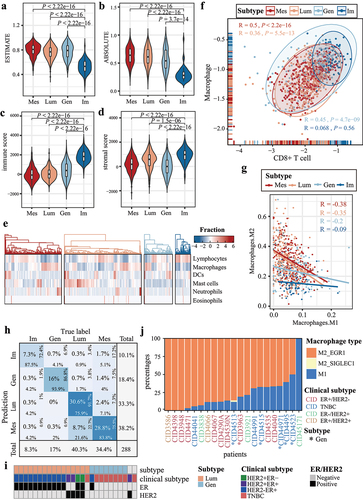
To validate differences in immune cell infiltration at the single-cell level, we analyzed the GSE176078 dataset which contained 24 matched bulk and single-cell RNA-sequencing data. We developed a random forest model based on bulk individual differential expression. As shown in , the random forest model reached mean 82.7% accuracy (sum of principal diagonal). Twenty-four bulk breast tumors were classified as 16 Lum and eight Gen samples. Seven TNBC samples were identified as Gen (). The significant overlap between TNBC and Gen samples supported the accuracy of random forest model (P = 1.8e-04, hypergeometric test). In the matched single-cell dataset, uniform manifold approximation and projection (UMAP) visualization showed a distinct separation of cancer epithelial cells by patients. However, stromal and immune cells across tumors clustered together without batch correction (Figure S10). Gen samples showed higher infiltration of M1 macrophage than Lum samples, which was consistent with the bulk-level (P = 1.3e-02, Wilcoxon rank-sum test, ).
Identifying key signaling pathways regulating macrophage infiltration
Cancer cells could promote macrophage polarization to stimulate breast tumor progression [Citation23]. Here, cancer epithelial cells were clustered into 11 single-cell clusters (). Interestingly, proportions of cell types highlighted a strong representation of distinct major lineages between Lum and Gen subtypes (). Further GO functional enrichment analysis revealed that genes highly expressed in Lum samples were enriched in myeloid leukocyte differentiation (). Besides, both the ESR1 and ERBB2 genes were highly expressed in clusters from Lum samples ( left). In contrast, Lum subtype-specific downregulated gene LDHB, and Gen subtype-specific upregulated gene S100A9, were significantly highly expressed in clusters from Gen samples ( right).
Figure 6. Cancer cell subsets in Lum subtype and Gen subtype regulate macrophage polarization. (a) UMAP representation of cancer epithelial cells. Blue and orange circles indicate Lum and Gen subtype, respectively. (b) the proportions of cancer cell clusters. Columns represent samples and are colored by clinical subtypes. Gen samples are indicated with asterisks at the bottom. (c) the top 10 most significant GO biological processes for highly expressed genes in Lum cancer cells. (d-e) expression of ESR1, ERBB2, and highly expressed genes in (d) subtypes and (e) clusters. (f) cell-to-cell communications occurring within and across cell types. Edge widths indicate cell–cell interaction strengths and are colored according to cell types. (g) scatter plot showing interaction strengths among cells. (h) significant interactions originating from cancer cells targeting to macrophages.
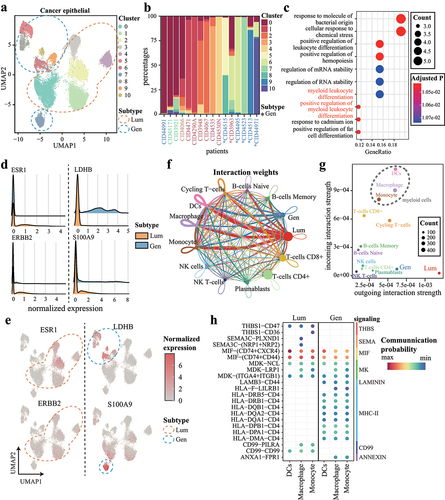
Finally, we explored the cell–cell communication pathways through which cancer cells regulate macrophages. The CellChat revealed an interaction between Lum cancer cells and myeloid cells, which included monocytes, macrophages, and dendritic cells (DCs) (). Among these cell populations, T-cell subsets and myeloid cells functioned mainly as receivers (). Both the Lum and Gen subtypes showed regulation of myeloid cells via the MIF and midkine pathways (P < 0.01, one-sided permutation test by CellChat, ). THBS, SEMA, and CD99 signaling were activated in the Lum subtype but were absent in the Gen subtype. In contrast, MHC-II, ANNEXIN, and LAMNIN signaling were specific to the Gen subtype (). The high communication probability of MIF, CD99, and PILRA suggested the regulatory role in the macrophage polarization. We found a significant correlation between CD99 expression and key M2 macrophage markers, including PPARG, ARG1, TGFB1, and MARCO (Figure S11). Pearson correlation analysis showed a significant positive relationship between CD99 and PPARG (R = 0.51, P < 0.05). Furthermore, in silico analysis using the JASPAR database, we predicted that the expression of CD99 is likely regulated by the M2 transcription factor PPARG [Citation24].
Discussion
Breast cancer is highly heterogeneous and exhibits a variety of multi-omics alterations. Given that cancer heterogeneity is not well described at the population and single-omics levels, our study integrated genomic and epigenomic alterations to identify differential expression at the individual level. Using the DDE profile, we identified new breast cancer subtypes with distinct molecular and clinical features. We highlighted that Mes subtype was the most aggressive subtype, which was driven by copy number deletion and downregulation of SDHD in the chromosomal 11q23 region. The Im subtype presented an “immune-hot” microenvironment. Furthermore, single-cell analysis highlighted the potential role of MIF and CD99 signaling pathways in regulating macrophage polarization in Lum and Gen subtype.
Samples with fewer driver differential expression may be more “normal-like” and represent an earlier stage in cancer progression [Citation25,Citation26]. We found that samples in the Lum subtype exhibited the fewest number of drivers, suggesting they might represent an earlier cancer phase. Following the Lum subtype, we observed that Im subtype samples displayed upregulation of FOXP3 and SIRPG, and downregulation of tumor suppressor CDKN1C. These drivers of Im subtype are known to regulate T-cell function [Citation27]. Subsequently, the Mes subtype samples showed downregulation of SDHD and SCN4B, which have been identified as Mes specific drivers. Samples in the Gen subtype emerged and were predominantly driven by autophagy and metabolic genes, including PXN, IVD, and GRM8 (Figure S12). Based on these findings, we speculate on a potential sequence for subtype progression, where later Mes, Gen, and Im subtypes may emerge from the Lum subtype as new drivers occur.
The 11q23-q24 deletion has been reported in various tumors, suggesting the presence of a tumor suppressor gene at that chromosomal region [Citation28,Citation29]. Our study identified four potential tumor suppressors in 11q23 region, including SDHD, TAGLN, SCN4B, and CRYAB. The enzyme succinate dehydrogenase, which consists of four nuclear encoded subunits including SDHD, has also been implicated in promoting angiogenesis and metastasis by macrophage metabolism reprogramming [Citation23]. Our results suggest that SDHD could be a driver gene in breast cancer metastasis by a macrophage-independent pathway.
In this study, we used MCF7 cell lines to validate our findings. MCF7 is one of the most extensively utilized cell lines to represent luminal breast cancer, a subtype that constitutes a significant proportion of our Mes samples. Additionally, MCF7 cells exhibit a relatively weak metastatic potential, which allows us to more accurately observe alterations in invasive capabilities following experimental manipulations [Citation30]. Then, we consulted the Cancer Cell Line Encyclopedia (CCLE) to assess both the copy number and expression level of the SDHD gene in various breast cancer cell lines. We found that MCF7 cells display haploinsufficiency of SDHD. Our hypothesis is that SDHD knockdown in MCF7 cells would effectively mimic the complete deletion of the SDHD gene, thereby providing a meaningful model for examining the biological consequences of SDHD loss [Citation31]
Previous research has categorized tumors as either “hot” or “cold”, representing high or low levels of immune infiltration, respectively [Citation32]. In our study, Mes subtype displayed composite signatures reflecting an M2 macrophage dominated and low TILs. The Lum subtype had more mast cells and M2 macrophages, indicating the important role of mast cells in luminal subtype [Citation33]. Our research highlights the potential regulatory roles of the CD99 and PILRA interactions between Lum cancer cells and macrophages. TIDE and Submap supported that Im subtype was associated with immunotherapy response. However, it is crucial to note that the TIDE algorithm was originally developed to predict immunotherapy response in melanoma and lung cancer [Citation34]. In fact, Im subtype was classified mostly as the CTL-high group. TIDE prediction scores of CTL-high tumors are dependent on the T-cell dysfunction signature, which is oppositely correlated with exhausted T-cell signature in breast cancer and other cancers like melanoma. This diversity impacts the interpretation of TIDE scores for breast cancer subtype. Further clinical tests on breast cancer were needed to elucidate the association between Im subtype and immunotherapy response.
BRCA gene pathogenic variants are known to increase the risks of breast cancer, which shows aggressive clinicopathological features [Citation35]. The PARP inhibitors, olaparib and talazoparib, have received FDA approval to treat metastatic breast cancer caused by a BRCA mutation. BRCA1 methylation has been detected in tumors of 25% to 30% of TNBCs and has been associated with HRD [Citation36]. Meta-analysis showed that BRCA1 gene hypermethylation should be suspected in all breast cancer patients with advanced disease stages [Citation37]. Hence, patients with BRCA1 methylation could be treated by PARP inhibitors like those with mutated BRCA1. In our analysis, we found that the frequency of non-silent BRCA mutation is 2.56% in TCGA dataset, while 10.94% breast cancer patients had hypermethylated and downregulated BRCA meanwhile. This finding expands the potential patient population that could benefit from PARP inhibitor and warrant the initiation of clinical trials to test the efficacy of PARP inhibitors in breast cancer patients with hypermethylated BRCA.
However, there are still some limitations in our study. With more regulatory data including noncoding RNA and chromatin accessibility, our study would identify DDE more comprehensively. Due to the absence of an independent multi-omics dataset, we could not fully validate our multi-omics individualization processes for validation. To approximately reproduce our subtype, we implemented a random forest model based on individual differential expression profile and achieved acceptable performances.
Conclusion
In summary, our study highlights the advantages of individual DDE in the characterization of inter-tumor heterogeneity, which offers an intuitive interpretability. An important application of the individual DDE profile is the identification of novel subtypes. The new breast cancer subtypes suggest different mechanisms in cancer progression and reveal a subtype which is potentially suitable for immunotherapy.
Availability of data and materials
The datasets analyzed during the present study are available from the GDC data portal (https://portal.gdc.cancer.gov/), cbioportal (https://www.cbioportal.org/), and matched bulk and single-cell RNA-seq data of breast cancer are available from the Gene Expression Omnibus (GEO, https://www.ncbi.nlm.nih.gov/geo/query/acc.cgi?acc=GSE176078).
Authors’ contributions
Z.Z., Y.G., and H.L. conceived the study. Z.Z., B.C., Q.D., and M.L. collected the data. T.J., J.G., and X.S. performed the experiments. Z.Z., T.J., B.C., Q.D., M.L., T.C., Y.L., H.H., H.L., and Y.G. analyzed the data. Z.Z. and T.J. wrote the manuscript. All authors contributed to the scientific discussion, reviewed, and edited the manuscript, and agreed on its content. Y.G. and H.L. contributed equally as senior authors.
Supplementary Information_revised.docx
Download MS Word (4.1 MB)Disclosure statement
No potential conflict of interest was reported by the author(s).
Supplementary material
Supplemental data for this article can be accessed online at https://doi.org/10.1080/15384101.2023.2281816.
Additional information
Funding
References
- Bray F, Ferlay J, Soerjomataram I, et al. Global cancer statistics 2018: GLOBOCAN estimates of incidence and mortality worldwide for 36 cancers in 185 countries. CA Cancer J Clin. 2018;68(6):394–424. doi: 10.3322/caac.21492
- Parker JS, Mullins M, Cheang MCU, et al. Supervised risk predictor of breast cancer based on intrinsic subtypes. J Clin Oncol. 2009;27(8):1160–1167. doi: 10.1200/JCO.2008.18.1370
- Larsen MJ, Thomassen M, Tan Q, et al. Microarray-based RNA profiling of breast cancer: batch effect removal improves cross-platform consistency. Biomed Res Int. 2014;2014:1–11. doi: 10.1155/2014/651751
- Staaf J, Ringner M. Making breast cancer molecular subtypes robust? J Natl Cancer Inst. 2015;107(1):386. doi: 10.1093/jnci/dju386
- Paquet ER, Hallett MT. Absolute assignment of breast cancer intrinsic molecular subtype. J Natl Cancer Inst. 2015;107(1):357. doi: 10.1093/jnci/dju357
- Li X, Cai H, Wang X, et al. A rank-based algorithm of differential expression analysis for small cell line data with statistical control. Brief Bioinform. 2019;20(2):482–491. doi: 10.1093/bib/bbx135
- Zhao Z, Guo Y, Liu Y, et al. Individualized lncRNA differential expression profile reveals heterogeneity of breast cancer. Oncogene. 2021;40(27):4604–4614. doi: 10.1038/s41388-021-01883-6
- Yan H, Guan Q, He J, et al. Individualized analysis reveals CpG sites with methylation aberrations in almost all lung adenocarcinoma tissues. J Transl Med. 2017;15(1):26. doi: 10.1186/s12967-017-1122-y
- Parikh N, Hilsenbeck S, Creighton CJ, et al. Effects of TP53 mutational status on gene expression patterns across 10 human cancer types. J Pathol. 2014;232(5):522–533. doi: 10.1002/path.4321
- Lundberg A, Lindström LS, Li J, et al. The long-term prognostic and predictive capacity of cyclin D1 gene amplification in 2305 breast tumours. Breast Cancer Res. 2019;21(1):34. doi: 10.1186/s13058-019-1121-4
- Glodzik D, Bosch A, Hartman J, et al. Comprehensive molecular comparison of BRCA1 hypermethylated and BRCA1 mutated triple negative breast cancers. Nat Commun. 2020;11(1):3747. doi: 10.1038/s41467-020-17537-2
- Rappoport N, Shamir R. Multi-omic and multi-view clustering algorithms: review and cancer benchmark. Nucleic Acids Res. 2018;46(20):10546–10562. doi: 10.1093/nar/gky889
- Tini G, Marchetti L, Priami C, et al. Multi-omics integration—a comparison of unsupervised clustering methodologies. Brief Bioinform. 2019;20(4):1269–1279. doi: 10.1093/bib/bbx167
- Cantini L, Zakeri P, Hernandez C, et al. Benchmarking joint multi-omics dimensionality reduction approaches for the study of cancer. Nat Commun. 2021;12(1):124. doi: 10.1038/s41467-020-20430-7
- Cancer Genome Atlas Research N, Collisson EA, Mills GB, et al. The cancer Genome Atlas pan-cancer analysis project. Nat Genet. 2013;45(10):1113–1120. doi: 10.1038/ng.2764
- Krug K, Jaehnig EJ, Satpathy S, et al. Proteogenomic landscape of breast cancer tumorigenesis and targeted therapy. Cell. 2020;183(5):1436–1456 e31. doi: 10.1016/j.cell.2020.10.036
- Woo HG, Choi J-H, Yoon S, et al. Integrative analysis of genomic and epigenomic regulation of the transcriptome in liver cancer. Nat Commun. 2017;8(1):839. doi: 10.1038/s41467-017-00991-w
- Strona G, Nappo D, Boccacci F, et al. A fast and unbiased procedure to randomize ecological binary matrices with fixed row and column totals. Nat Commun. 2014;5(1):4114. doi: 10.1038/ncomms5114
- Sondka Z, Bamford S, Cole CG, et al. The COSMIC cancer gene census: describing genetic dysfunction across all human cancers. Nat Rev Cancer. 2018;18(11):696–705. doi: 10.1038/s41568-018-0060-1
- Cerami EG, Gross BE, Demir E, et al. Pathway commons, a web resource for biological pathway data. Nucleic Acids Res. 2011;39(Database issue):D685–90. doi: 10.1093/nar/gkq1039
- Zhao Z, Zhou W, Han Y, et al. EMT-Regulome: a database for EMT-related regulatory interactions, motifs and network. Cell Death Dis. 2017;8(6):e2872–e2872. doi: 10.1038/cddis.2017.267
- Auslander N, Zhang G, Lee JS, et al. Robust prediction of response to immune checkpoint blockade therapy in metastatic melanoma. Nat Med. 2018;24(10):1545–1549. doi: 10.1038/s41591-018-0157-9
- Gomez V, Eykyn TR, Mustapha R, et al. Breast cancer–associated macrophages promote tumorigenesis by suppressing succinate dehydrogenase in tumor cells. Sci Signal. 2020;13(652):13(652. doi: 10.1126/scisignal.aax4585
- Castro-Mondragon JA, Riudavets-Puig R, Rauluseviciute I, et al. JASPAR 2022: the 9th release of the open-access database of transcription factor binding profiles. Nucleic Acids Res. 2022;50(D1):D165–D173. doi: 10.1093/nar/gkab1113
- Danielsson F, Skogs M, Huss M, et al. Majority of differentially expressed genes are down-regulated during malignant transformation in a four-stage model. Proc Natl Acad Sci U S A. 2013;110(17):6853–6858. doi: 10.1073/pnas.1216436110
- Vendramin R, Litchfield K, Swanton C. Cancer evolution: Darwin and beyond. EMBO J. 2021;40(18):e108389. doi: 10.15252/embj.2021108389
- McMurchy, Alicia N and Gillies, Jana and Gizzi, Maria Concettaet al. A novel function for FOXP3 in humans: intrinsic regulation of conventional T cells. Blood. 2013;121(8):1265–1275. doi: 10.1182/blood-2012-05-431023
- Ong DC, Ho YM, Rudduck C, et al. LARG at chromosome 11q23 has functional characteristics of a tumor suppressor in human breast and colorectal cancer. Oncogene. 2009;28(47):4189–4200. doi: 10.1038/onc.2009.266
- Bill M, Mrózek K, Kohlschmidt J, et al. Mutational landscape and clinical outcome of patients with de novo acute myeloid leukemia and rearrangements involving 11q23/KMT2A. Proc Natl Acad Sci U S A. 2020;117(42):26340–26346. doi: 10.1073/pnas.2014732117
- Ziegler E, Hansen M-T, Haase M, et al. Generation of MCF-7 cells with aggressive metastatic potential in vitro and in vivo. breast cancer Res treat. Breast Cancer Res Treat. 2014;148(2):269–277. doi: 10.1007/s10549-014-3159-4
- Barretina J, Caponigro G, Stransky N, et al. The cancer cell line Encyclopedia enables predictive modelling of anticancer drug sensitivity. Nature. 2012;483(7391):603–607. doi: 10.1038/nature11003
- Galon J, Bruni D. Approaches to treat immune hot, altered and cold tumours with combination immunotherapies. Nat Rev Drug Discov. 2019;18(3):197–218. doi: 10.1038/s41573-018-0007-y
- Majorini MT, Cancila V, Rigoni A, et al. Infiltrating mast cell–mediated stimulation of estrogen receptor activity in breast cancer cells promotes the luminal phenotype. Cancer Res. 2020;80(11):2311–2324. doi: 10.1158/0008-5472.CAN-19-3596
- Jiang P, Gu S, Pan D, et al. Signatures of T cell dysfunction and exclusion predict cancer immunotherapy response. Nat Med. 2018;24(10):1550–1558. doi: 10.1038/s41591-018-0136-1
- Lee A, Moon BI, Kim TH. BRCA1/BRCA2 pathogenic variant breast cancer: treatment and prevention strategies. Ann Lab Med. 2020;40(2):114–121. doi: 10.3343/alm.2020.40.2.114
- Eikesdal HP, Yndestad S, Elzawahry A, et al. Olaparib monotherapy as primary treatment in unselected triple negative breast cancer. Ann Oncol. 2021;32(2):240–249. doi: 10.1016/j.annonc.2020.11.009
- Ruscito I, Gasparri ML, De Marco MP, et al. The clinical and pathological profile of BRCA1 gene methylated breast cancer women: a meta-analysis. Cancers (Basel). 2021;13(6):1391. doi: 10.3390/cancers13061391