
 ?Mathematical formulae have been encoded as MathML and are displayed in this HTML version using MathJax in order to improve their display. Uncheck the box to turn MathJax off. This feature requires Javascript. Click on a formula to zoom.
ABSTRACT
This paper revisits the question of choice between regionalism and multilateralism in trade relations of Central Asia introduced by Pomfret (Citation2005). Our study is motivated by a significant restoration of economic links between the former Soviet republics following Russian accession to the World Trade Organization (WTO), the creation of the Eurasian Economic Union (EAEU), and the formation of new trade ties with Vietnam, Iran, and Serbia. Above all, there have been substantial commitments made by the three Central Asian republics of Tajikistan, Turkmenistan, and Uzbekistan toward a multilateral system under the WTO rules. To this end, we apply a multi-region gravity model with interdependent trade flows using bilateral trade data of Tajikistan and Uzbekistan to study the ex-ante effects of economic integration with various bilateral, plurilateral, and multilateral partners. Our findings indicate the existence of considerable gains if the aforementioned economies would ascend to the EAEU in comparison to integration with China or Iran. We also document the presence of shared economic links between Tajikistan, Central Asia, and Turkey.
KEYWORDS:
IntroductionFootnote1
After three decades of market transition, the former Soviet republics are yet to abandon collectivist trade ties with each other. In fact, there has been a restoration of trade and economic links between the republics centered around Russia after its accession to the World Trade Organization (WTO) in 2012. The novelty of this phenomenon has been underpinned by a significant expansion of economic cooperation both within and beyond the region. In the former case, Armenia and the Kyrgyz Republic ascended to the Eurasian Economic Union (EAEU) in 2015, while in the latter case, the EAEU negotiated preferential trade agreements with Vietnam (2016),Footnote2 Iran (2019), and Serbia (2021). Most notably, the three Central Asian republics (CARs) of Tajikistan, Turkmenistan, and Uzbekistan have made notable steps toward multilateral integration within the WTO system and in some cases, expressed open interest in joining the EAEU and pursuing closer economic ties with Russia.
The main goal of this paper is to study the ex-ante trade effects of economic integration between Tajikistan, Uzbekistan and potential bilateral, plurilateral, and multilateral partners such as China, the EAEU, Iran, Turkey, a hypothetical SPECA-basedFootnote3 trade union, and WTO.Footnote4 This is because the two abovementioned economies are yet to embark on their trade integration journey with some of their close neighbors. Our empirical study is based on a multi-region gravity model with interdependent trade flows that is estimated using bilateral trade data across 2010–2019. Our findings show that there could be significant and substantial trade gains for the abovementioned economies if they would ascend to the EAEU in comparison to other alternatives such as bilateral preferential treaties with China or Iran. This comes despite significant trade divergenceFootnote5 between Uzbekistan and the EAEU as well as increased trade with China across the studied period. Further, we find that in the case of Tajikistan, there could be substantial gains related to trade integration with Turkey and a hypothetical trade union with the SPECA members.
This paper contributes to the following three strands in the literature. The first strand is related to empirical studies of trade patterns across the former Soviet space and the Warsaw Pact members. In particular, the studies that focus on how trade patterns respond to various institutional changes, e.g. dissolution of the Soviet Union, Czechoslovakia, and Yugoslavia or the fall of the Berlin Wall. Notable examples include, inter alia, Kaminski et al. (Citation1996), Blanchard and Kremer (Citation1997), Djankov and Freund (Citation2002a, Citation2002b), Fidrmuc and Fidrmuc (Citation2003), Redding and Sturm (Citation2008), Head, Mayer, and Ries (Citation2010), Nitsch and Wolf (Citation2013), Mazhikeyev and Edwards (Citation2021). More specifically, the current study follows arguments raised in Head, Mayer, and Ries (Citation2010) and Mazhikeyev and Edwards (Citation2021) about a sticky post-colonial trade adjustment as we study potential integration between the EAEU,Footnote6 Tajikistan, and Uzbekistan. Since our econometric methodology features parallel estimation we are able to study the potential heterogeneity of such post-colonial trade ties. To achieve this, we construct a hypothetical trade union based on the SPECA membership and examine whether the trade of Tajikistan or Uzbekistan with the other CARs features positive complementarity (and its degree) vs. trade with the EAEU members.
Second, our study is linked to the empirical literature studying the effects of bilateral and multilateral forms of economic integration in the post-Soviet space such as WTO accessions, trade unions, and preferential trade agreements: Campos (Citation2004), Babetskaia-Kukharchuk and Maurel (Babetskaia-Kukharchuk and Maurel Citation2004), Jensen and Tarr (Citation2007), De Souza (Citation2011), Tarr (Citation2016), Falkowski (Citation2018), Adarov (Citation2018), Adarov and Ghodsi (Citation2021), Golovko and Sahin (Citation2021), Cieślik and Gurshev (Citation2022), and many others.Footnote7 The featured analysis is closely connected to studies of Babetskaia-Kukharchuk and Maurel (Citation2004), Jensen and Tarr (Citation2007), and De Souza (Citation2011) that investigate potential ex-ante trade creation/divergence effects from Russian and Kazakh accessions to WTO as well as customs union integration between Belarus, Kazakhstan, Russia, and Ukraine. This study uses a gravity model with interdependent trade flows, introduced first in Viaene (Citation1982) in the context of European trade integration, to study feasible trade integration scenarios for Tajikistan and Uzbekistan. In particular, our empirical methodology features a system of equations accounting for potential integration partners. Hence, the paper’s contribution to this strand is mostly empirical as the featured theoretical framework has not been previously used in the context of any of the post-Soviet economies.
Third, this paper is also related to studies that discuss trade development and economic integration issues in the context of CARs. Examples include Sakwa and Webber (Citation1999), Pomfret (Citation2003), Pomfret (Citation2005), Raballand, Kunth, and Auty (Citation2005), Lücke and Rothert (Citation2006), Carrere and Grigoriou (Citation2007), Raballand and Andrésy (Citation2007), Ambrosio (Citation2008), De Haas (Citation2017), Oh, Yuldashev, and Moon (Citation2018), Freeman (Citation2018), and Wen-Chih (Citation2022). In particular, the featured discussion section extends the original analysis of Pomfret (Citation2005) as we investigate the contemporary background in relation to the existing trade patterns, WTO negotiations, and ongoing efforts at regional development cooperation through the Central Asia Regional Economic Cooperation (CAREC) program, SPECA and the Shanghai Cooperation Organization (SCO). Further, our empirical analysis is based on the original datasets from Tajikistan and Uzbekistan that have not been featured in any of the existing empirical studies on this topic.Footnote8 Hence, the current study offers novel insights into trade and integration issues of Central Asian countries through both qualitative and quantitative analyses.
The remainder of the paper is organized as follows. Section 2 discusses the contemporary background in relation to the existing patterns of trade in Central Asia, WTO accession status, as well as regional integration efforts. Section 3 describes our empirical strategy and data. Section 4 reports and interprets our empirical results. Section 5 concludes with policy recommendations and directions for further studies.
Trade patterns, multilateralism and regionalism
This section consists of three parts. First, we discuss trade patterns between the CARs and their main regional trading partners: the Commonwealth of Independent States (CIS),Footnote9 China, and the EAEU. Second, we review the process of WTO accession across Central Asia. Third, we provide a summary of ongoing attempts at regional integration among the CARs by examining the current network of PTAs/FTAs.
Trade patterns
shows trade shares of Kazakhstan, the Kyrgyz Republic, Tajikistan, and Uzbekistan with the CIS members based on historical trade data from 2009–2019 (UN (United Nations) Citation2022; NBT (National Bank of Tajikistan) Citation2022; State Committee on Statistics (State Committee of the Republic of Uzbekistan on Statistics) Citation2022). While the CIS trade cooperation framework remains dysfunctional from the integration point of viewFootnote10 (Sakwa and Webber Citation1999), its members remain to be important destinations for trade. For example, in 2019, about half of Tajik, Kyrgyz, and a third of total Uzbek trade was with the CIS members. In particular, between 2009–2019, Tajikistan’s share of exports with CIS nearly tripled, while exports from Uzbekistan and the Kyrgyz Republic to CIS remained relatively high throughout the decade. At the same time, exports from Kazakhstan to CIS showed moderate growth. Though there has also been a notable trade divergence from CIS as Uzbekistan and the Kyrgyz Republic considerably reduced their import flows away from the block toward China, where bilateral trade between the two aforementioned CARs and China almost doubled (). In the case of Uzbekistan, this appears to be related to both growth of exports and imports, while the Kyrgyz Republic has only seen a significant expansion of imports from China.
Table 1. Trade between CARs and CIS, 2009–2019%).
Table 2. Trade between CARs and China, 2009–2019%).
During this period, CARs forged a starkly different relationship with the EAEU (). For example, Tajikistan expanded its total trade with the EAEU, which was both export and import driven. Whereas economies such as Uzbekistan and the Kyrgyz Republic have seen a considerable trade divergence with the union. Overall, the observed importance of CIS and the EAEU to Tajikistan and Kazakhstan has predominantly hinged on expanding trade with Russia (see , while the Kyrgyz Republic and Uzbekistan increased trade cooperation with China, Iran, and Turkey (. Further, trade flows for Tajikistan and Uzbekistan remained intra-regional as their total trade with large partners such as the European Union (EU) continues to be marginal.Footnote11
Figure 1. Total trade of Tajikistan with the EAEU members, log, 2010–2019.
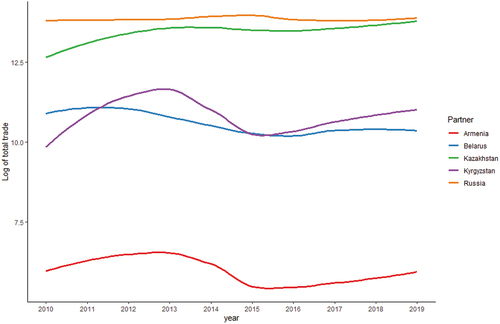
Figure 2. Total trade of Uzbekistan with China, Iran, Russia, and Turkey, log, 2000–2019.
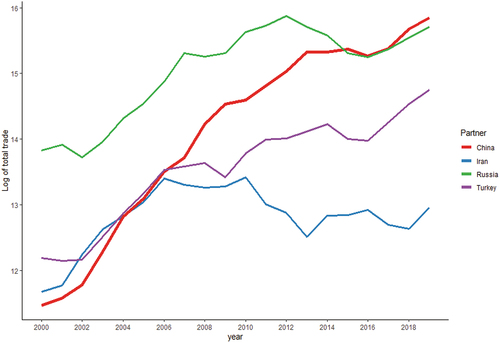
Table 3. Trade between CARs and CU/EAEU, 2010–2019%).
Multilateralism
At the time of writing, three out of five CARs hold WTO membership: Kazakhstan, the Kyrgyz Republic, and Tajikistan. The remaining two economies of Turkmenistan and Uzbekistan are at different stages of the WTO accession procedure (). The first ever CAR to join WTO following the events of 1991 was the Kyrgyz Republic (1998). Its swift accession was predominantly dictated by a combination of factors: i) relatively small economic size, ii) the existence of liberal trade policies such as a low tariff structure and few non-tariff barriers, and iii) untroubling negotiations with the existing WTO members (Pomfret Citation2005). Whereas the later accessions of Kazakhstan and Tajikistan took between 11 and 18 years to complete and were concluded just a few years after Russia’s successful accession.
Table 4. Status of WTO accession negotiations.
Overall, the third decade of market transition has seen significant efforts on behalf of the Central Asian governments to complete the accession procedure after nearly two decades of negotiations. The first CAR to join WTO after Russia was Tajikistan in 2013, the accession was largely accelerated in 2012 with three consecutive Working Party meetings taking place in a single year. The Tajik government undertook significant steps to reform its investment regime (e.g. recognition of foreign companies’ branches registered domestically), tariff and tax reforms (abolishment of retail tax, consolidation of retail and land taxes, VAT relief, etc.), and major good certification overhaul (transforming national standards into technical regulations in accordance with the WTO rules and disciplines) (WTO (World Trade Organization) Citation2012b). While some of the new regulations (such as certification legislation) have been given a very generous implementation window (up to 7 years), the overall commitment to trade reform in the regional context from Tajikistan was rather notable. Given this, the impact of membership on the domestic economy is yet to be fully understood as empirical studies on this topic are pretty much non-existent.
The second CAR to join WTO was Kazakhstan in 2015 after having held 20 Working Party meetings over 1997–2015. Despite the fact, that Kazakhstan has already undertaken a number of significant legislative changes when joining the customs union with Belarus and Russia in 2010, it has made a number of considerable reforms in areas such as currency regulations, pricing and competition policy, taxation, industrial subsidies, licensing, and IP rights protection (WTO (World Trade Organization) Citation2014). The negotiations have enabled bilateral market access between Kazakhstan and some of the largest trading partners in the region: the EU, China, Turkey, and South Korea. Yet, similar to the Tajikistan case, the quantitative assessment of the WTO membership on Kazakh trade activity still remains rather ambiguous.
In 2020, Uzbekistan has resumed negotiations with WTO after nearly 15 years after its last Working Party meeting. Since then, the Working Party has been meeting at a regular pace, holding two meetings in 2020 and 2022. Given the fact that Uzbekistan has been actively expanding its trade geography beyond the former Soviet economic space, WTO membership can potentially bring notable economic benefits. For example, domestic exporters of precious metals and raw cotton would face more favorable terms of trade in their export markets and facilitate access of foreign firms to the domestic market. All in all, post-2016, Uzbekistan has been firmly pursuing large-scale domestic reforms focused on extensive privatization,Footnote12 development of urban infrastructure, rule of law and statistical transparency. As a result, WTO member status has become an important policy priority for the newly established (i.e. post-Karimov) Uzbek government.
In February 2022 Turkmenistan initiated negotiations on the accession after being an observer to the GATT since 1992,Footnote13 which made it the last former Soviet republic to apply for WTO membership.Footnote14 Given that Turkmenistan is by far the most closed economy of the former Soviet republics, the economic impact of WTO membership remains dubious in absence of significant domestic reforms. It is unlikely that negotiations will see significant short-term progress as its domestic economy continues to be largely nontransparentFootnote15 and severely monopolized by the state in critical industries such as gas extraction or petroleum processing.
Regionalism and trade development
The geography of regional agreements focused on trade cooperation across CARs remains highly fragmented and fixated on Russia and Ukraine (). The initial CIS free trade agreement from 1994 has seen a more advanced replacement signed in 2011 by the majority of CARs except for Uzbekistan and Turkmenistan. Taking the number and scope of the existing trade treaties, Tajikistan and Uzbekistan continue to severely lag behind more advanced Kazakhstan and the Kyrgyz Republic, who have benefited from the newly signed bilateral agreements between the EAEU, Iran, Serbia, and Vietnam. Moreover, Tajikistan and Uzbekistan did not manage to enter (more preferable and beneficial) bilateral agreements with the other post-Soviet republics (including each other) such as Belarus, Kazakhstan, Georgia, and Moldova. Overall, the trade integration vector of Central Asia appears to be two-fold: i) progressive (westward) with a focus on the EAEU and Ukraine, and ii) conservative (self-centered) with a strong focus on local autonomy. This is also confirmed by observing the most recently available applied mean tariff rates across CARs (), where Tajikistan and Uzbekistan continue to apply significantly higher external tariffs in comparison to Kazakhstan and the Kyrgyz Republic.
Table 5. Membership in regional PTA/FTA involving CARs.
Table 6. Applied tariff rate (%) across CARs, all products, 2020.
When it comes to membership in the related regional organizations and development assistance programs that focus on economic and trade agendas, multiple entities stand out: EAEU, SPECA, CAREC, and SCO (). In particular, the former customs union between Belarus, Russia, and Kazakhstan has been replaced by the more comprehensive EAEU treaty in 2015 and accessions of Armenia and the Kyrgyz Republic. The existing empirical research points out to the existence of trade divergence across the aforementioned members (De Souza Citation2011; EBRD (European Bank for Reconstruction and Development) Citation2012; Tarr Citation2016) because the sectoral competitiveness of the EUEA members is largely concentrated in the production of relatively homogenous goods (Falkowski Citation2018; Adarov Citation2018) that results in incomplete specialization and intra-industry trade as well as short-lived economic gains across participating economies (Cieślik and Gurshev Citation2022).
Table 7. Participation and membership in the related regional organizations and development programs, extended neighborhood.
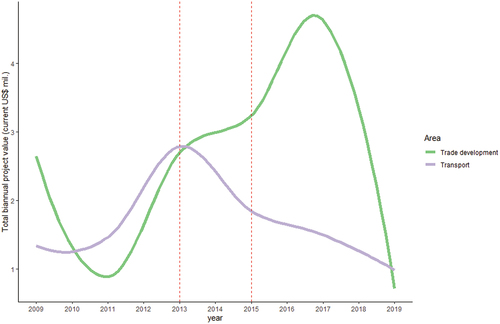
Between 2008–2019 UNECE’s SPECA has seen an increase in biannual funding toward trade facilitation projects (see ) such as Single Window implementation, capacity building for the integration of agricultural quality standards, and SME development in CARs that coincided with Tajikistan and Kazakhstan accessions to WTO in 2013 and 2015. Though, funding of transport and infrastructure-related projects of SPECA have seen a sharp decrease (SPECA (United Nations Special Programme for the Economies of Central Asia) Citation2022). Most importantly, in 2019, the available SPECA project funding in the abovementioned two project tracks reached its lowest recorded point, indicating little interest in the region at the time, which we think is related to the fact that Uzbekistan’s talks with WTO were on hold.
Figure 3. Total value of SPECA projects focused on trade and transportation, 2008–2019.
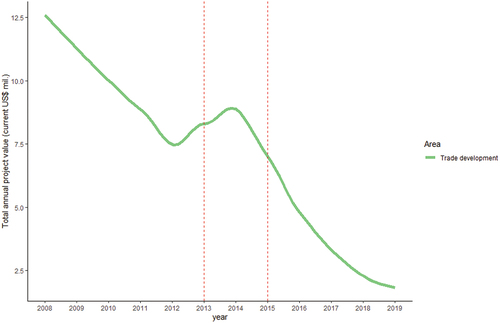
Over a similar period of time, the CAREC program has financed a variety of projects aimed at trade promotion such as customs modernization, capacity building, and technical assistance across CARs (). By far, the largest project that was implemented dealt with an extensive customs reform in Kazakhstan (US$50m over 2007–2015). A typical funding scheme for a project includes financing from at least one institutional investor or donor economy (Asian Development Bank, United States, World Bank) and a given CAR economy, where this project is implemented. Just like the SPECA funding, there has been a 6-fold decrease in the available project funding following the accessions of Tajikistan and Kazakhstan to WTO (CAREC (Central Asia Regional Economic Cooperation Program) Citation2022).
Figure 4. Total value of CAREC funding related to trade development, 2008–2019.
As to SCO, no official information is available about tangible (direct) development support facilitated through the organization by either China, India, or Pakistan to CARs. However, the existing studies indicate that China has been facilitating trade and economic cooperation in Central Asia through various bilateral loan programs (Facon Citation2013; Freeman Citation2018; Wen-Chih Citation2022). In the most recent Moscow declaration signed in 2020, SCO members state their commitment to economic and trade cooperation based on the principles and rules of WTO. As well as the promotion of transport connectivity between China’s BRIFootnote16 and the EAEU (SCO (Shanghai Cooperation Organization) Citation2020). Despite its broad agenda and, perhaps, rather vague economic goals,Footnote17 the organization remains to be the only international dialogue organization featuring nearly all of the relevant major regional partners together with CARs.
Empirical methodology and data
This section comes in two parts. First, we describe the empirical methodology and the estimation approach. Second, we describe our dataset and the explanatory variables employed in the econometric analysis.
Empirical methodology
To study possible integration effects between Tajikistan, Uzbekistan, and the major bilateral, regional, and multilateral trading parties in the region such as China, the EAEU, Iran, SPECA, Turkey, and the WTOFootnote18 members, we employ a variation of the gravity model with interdependent trade flows originally introduced in Viaene (Citation1982).Footnote19 In particular, we construct two identical samples of 80 partners each (). The total number of observations for each sample is 1600 with 2.81% (Uzbekistan) and 25.5% (Tajikistan) of observations accounting for zero trade. As was noted in Section 1 of the paper, domestically sourced data feature larger coverage of close economic neighbors of CARs (Mongolia, Iran, Pakistan), the EU (Croatia, Denmark, Finland), and Latin America (Argentina, Brazil, Ecuador) in comparison to data from DOTS or COMTRADE databases.
Table 8. Partner sample.
We consider the following linear relationship between the bilateral trade flow from exporter
to importer
, for
Uzbekistan, Tajikistan, and
,
:
where the bilateral trade flow is related to trade (either exports or imports) with the fixed number of possible integration partners
. If the effect of the change of
or
on
is positive, there is complementarity or positive interdependence of trade flows. If it is negative, then we have substitution or negative interdependency of trade flows. The response of changes in
and
is measured by parameter
, when
is zero,
is not dependent on trade from partners in
. Further,
and
are output-side real GDPs measured at chained PPPs (2017 mil. USD);
is a commodity export price index (fixed weights, 2012 = 100).
To estimate Equationequation (1)(1)
(1) we form a system of 6 equations in accordance with the considered pool of economies in
and apply the three-stage least squares (3SLS) estimation method.Footnote20 Since we consider a regression system that comprises several individual relationships, it is possible to assume that disturbance terms
are possibly correlated. To test this, we also perform a linear seemingly unrelated regression (SUR) estimation over Equationequation (1)
(1)
(1) . Based on the discussion in Section 2, we consider the following pool of partners ().
Table 9. Pool of potential integration partners.
Data sources
The detailed description of dependent and explanatory variables used in our empirical analysis is provided in . Bilateral cross-country trade data for Tajikistan and Uzbekistan are obtained from the respected national statistical agencies between 2010–2019Footnote21 (NBT (National Bank of Tajikistan) Citation2022; State Committee on Statistics (State Committee of the Republic of Uzbekistan on Statistics) Citation2022).
Table 10. Variable definitions and data sources.
Data on the absolute economic size of trading partners and bilateral distance are sourced from the Penn World Table 10.0 (Feenstra, Inklaar, and Timmer Citation2015) and GeoDist databases (Mayer and Zignago Citation2011). Finally, the commodity export price index (2012 = 100) is obtained from the Commodity Terms of Trade database (IMF (International Monetary Fund) Citation2022). Because export price data for Uzbekistan is largely unavailable we construct a synthetic export price index () for Uzbekistan using a weighted average of SPECA member’s price indices based on annual export sharesFootnote22 from SPECA members to Uzbekistan across the studied period, the exact weights used for the computation are: Afghanistan (0.24), Azerbaijan (0.01), Kazakhstan (0.56), Kyrgyz Republic (0.07), Tajikistan (0.06), Turkmenistan (0.04). When studying pairwise correlations we did not detect severe correlation among the variables used in Equationequation (1)
(1)
(1) .
Estimation results
In this section we report and interpret two sets of our empirical results. First, we report estimation results from Equationequation (1)(1)
(1) via the 3SLS method. Second, we report the results based on the SUR approach.
Baseline results
First, we present empirical results for the total trade flows, and then, report the results based on unilateral export and import modes. presents the 3SLS estimation results from the bilateral trade of Uzbekistan, where we find trade complementarity with the EAEU, China, and Turkey (column ). In the case of EAEU, a unit increase (US$1 mil.) in the total import or export trade with the EAEU has a complementary and significant (
) impact on bilateral trade flows (+US$0.077 mil.). Similarly, import and export with China (Mainland and Hong Kong) feature significant but lower complementarity impact (+US$0.022 mil.). Third, trade with Turkey carries a weakly significant (
) complementary impact (+US$0.036 mil.). And in the other cases (SPECA, IRAN, WTO) our results do not find any interdependence between the bilateral trade of Uzbekistan and the abovementioned partners. Finally, the self-constructed price index (for 790 observations, where Uzbekistan acts as an exporter) does not play any role in the results.
Table 11. Uzbekistan, 3SLS, bilateral trade, 2010–2019.
We now turn to the 3SLS estimation results based on bilateral trade from Tajikistan (), where find trade complementarity of Tajik trade with the EAEU (+US$0.047 mil.), SPECA (+US$0.009 mil.), and Turkey (+US$0.098 mil.). Further, the exporter-side price index has a negative and significant () impact on bilateral trade flows, which could be related to the existing costs connected to either exporting from Tajikistan (e.g. customs procedures, transportation, or export tariffs) or the relatively low ability of domestic producers to engage in price competition (high marginal costs). In the remaining cases (CHINA, IRAN, WTO) our results do not find any interdependence between Tajikistan and the aforementioned partners. In this context, Tajikistan’s trade does exhibit complementarity with Central Asia, which could signal the persistence of post-Soviet economic links. Interestingly, the presented analysis in does not find any effects of trade substitution between any of the featured trade partners as well as trade complementarity with Iran.
Table 12. Tajikistan, 3SLS, bilateral trade, 2010–2019.
shows alpha estimates based on the unilateral data samples, where we decompose trade flows into exports and imports. Across the considered partners for both Tajikistan and Uzbekistan, the alpha estimates favor potential integration with the EAEU (both export and import modes). However, in the case of Tajikistan, this complementarity appears to be skewed toward imports, whereas in the case of Uzbekistan, it is reversed and favors exports. Next, Tajikistan features unilateral export complementarity with the SPECA members, whereas Uzbekistan does not. Further, our results indicate significant trade complementarity with China for both CARs, where such an arrangement benefits exports from Tajikistan, and both exports and imports for Uzbekistan. Finally, in the unilateral case of exports, we detect strong complementarity between Tajikistan’s exports and Turkey.
Table 13. Alpha estimates for unilateral export and import modes, 3SLS, 2010–2019.
Robustness
Since we consider a regression system that comprises several individual relationships, it is probable to assume that disturbance terms are correlated. To test this, we perform a linear seemingly unrelated regression (SUR) estimation over Equationequation (1)
(1)
(1) . The obtained results via SUR for Uzbekistan and Tajikistan are reported in , the estimated parameters on all of the considered variables are very similar to the original 3SLS estimates (). Hence, we conclude that the original results hold in the case of disturbance term correlation.
Table 14. Uzbekistan, SUR, bilateral trade, 2010–2019.
Table 15. Tajikistan, SUR, bilateral trade, 2010–2019.
Conclusion
By the third decade of market transition, some of the Central Asian economies have accepted obligations imposed by the WTO system and pursued policies aimed at trade promotion with their neighbors. The timing of this policy shift, in comparison to its original antipodal state documented by Pomfret (Citation2005), comes after the establishment of a customs union between Belarus, Kazakhstan, and Russia (2010) and Russian accession to the WTO (2012). Furthermore, there has been a considerable extension of economic integration following the EAEU enlargement (2015) and the establishment of new preferential treaties with Vietnam (2016), Iran (2019), and Serbia (2021). Though, the pace of regional and multilateral integration has been starkly different across the CARs. This is especially noticeable when looking at the PTA/FTA membership involving the republics. Economies such as Tajikistan and Uzbekistan have adopted conservative and autonomous trade policies, whereas Kazakhstan and the Kyrgyz Republic have embraced more progressive terms of trade that resulted in a much tighter integration within the post-Soviet economic space.
Our findings are threefold. First, we show that there could be significant and substantial trade gains for both Tajikistan and Uzbekistan if they would ascend to the EAEU in comparison to other alternatives such as bilateral treaties with China or Iran. This complements the original findings of Head, Mayer, and Ries (Citation2010) and Mazhikeyev and Edwards (Citation2021) about the existence of sticky trade links between Russia and the former Soviet republics. Further, we find that only Tajikistan shares a weak complementary trade link with the other CARs. Second, in the case of Tajikistan, we find the existence of potential export-oriented integration between Central Asia and Turkey. Third, despite potentially significant gains from the EAEU membership, trade with China remains a feasible alternative for both Tajikistan and Uzbekistan.
The discussed results and their implications should be treated with caution. Not only due to the employed theory and empirical approaches, but also because of the ongoing geopolitical developments in the region. In particular, the latter may have implications connected to how trade is conducted with Russia and the EAEU for decades to come.
As for the specific question of the choice between regionalism and multilateralism in trade policy relations, the verdict from Central Asia appears to be evolving. While regionalism remains highly attractive, the preferential trading arrangements are now formalized through the prism of the WTO rules, which continue to be the best framework to develop international economic relations.
Disclosure statement
No potential conflict of interest was reported by the author(s).
Additional information
Funding
Notes
1. We thank Saroj Aryal Kumar, Sarhad Hamza, Jan Jakub Michałek, Mahmut Akarsu, and two anonymous referees for helpful comments and discussions. This research was funded in whole by National Science Center, Poland under PRELUDIUM 20 grant nr. 2021/41/N/HS4/00759. For the purpose of Open Access, the author has applied a CC-BY public copyright license to any Author Accepted Manuscript (AAM) version arising from this submission. Datasets and estimation codes are publicly available at https://sites.google.com/view/oleggurshev/data.
2. Year in brackets denotes entry into force. The actual signing of the agreements between the EAEU and the listed examples was: Vietnam (2015), Iran (2018), and Serbia (2019). Further, the EAEU has been actively negotiating a preferential trade agreement with Singapore since 2019.
3. Refers to the United Nations Special Programme for the Economies of Central Asia.
4. Despite Tajikistan’s WTO accession in 2013, goods market access was only given to 13 members (WTO (World Trade Organization) Citation2012a).
5. We discuss recent trade patterns across CARs in Section 2 of the paper.
6. In this context, the EAEU can be thought of as Russia or the former colonizer because its economy constituted approximately 79.1% of the total EAEU trade between 2010–2019 (annual average), more analysis on this topic can be found in Adarov (Citation2018), Adarov and Ghodsi (Citation2021), Cieślik and Gurshev (Citation2022).
7. See also related studies of Tsygankov (Citation2003), Trenin (Citation2011), Libman and Vinokurov (Citation2011), Dragneva and Wolczuk (Citation2012), Konopelko (Citation2018), Czerewacz-Filipowicz (Citation2019) that discuss, inter alia, the role of the European Union in Central Asia, China’s Belt and Road Initiative (BRI), and Russia’s approach to the Eurasian integration.
8. In particular, our data are more detailed than DOTS or COMTRADE databases in covering CAR trade with important regional partners (Iran, Mongolia, Pakistan), the European Union (Croatia, Denmark, Finland), and Latin America (Argentina, Brazil, Ecuador).
9. We construct our CIS estimates using the following set of countries: Armenia, Azerbaijan, Belarus, Kazakhstan, Kyrgyz Republic, Moldova, Russia, Uzbekistan, and Ukraine. We include Ukraine because its withdrawal from the organization was not immediate and was officially initiated only in mid-2018, whereas Turkmenistan does not hold membership.
10. The last significant integration treaty on the CIS Free Trade Area was signed more than a decade ago in 2011 and has yet to be fully adopted by some of the CIS members, i.e. Tajikistan and Uzbekistan (see discussion of below).
11. Despite Tajikistan’s accession to WTO in 2013, the total annual value of trade with the EU has decreased from 7.9 to 5.3% from 2010–2019, whereas Uzbekistan’s share of total trade with the EU oscillated between 9.4 and 13%.
12. Since then, Uzbekistan has been auctioning off stakes in large state-owned enterprises such as gold mines, food processing plants, and real estate.
13. This comes despite Turkmenistan’s adherence to the concept of permanent positive neutrality for three decades of its market transition.
14. The official application to join the WTO under Article XII of the Marrakesh Agreement was officially received from Turkmenistan on 24 November 2021.
15. Turkmenistan’s trade and economic data continues to be the least accessible across the post-Soviet space.
16. China’s bilateral development assistance to CARs has been directed through a variety of BRI-related projects rather than SCO due to institutional constraints (Ahmad Citation2018). Most recent estimates (2018–2019 data) of the possible total value of Chinese projects in CARs by Vakulchuk et al. (Citation2019) point to a value of around US$136 mil., with the majority of that financial support, concentrated in Kazakhstan (US$90 mil.).
17. It has to be noted, that SCO traces its origins to border demarcation issues between China and the Soviet Union (Ambrosio Citation2008; De Haas Citation2017). Hence, the economic agenda was introduced into the organization at a much later stage.
18. This paper treats WTO as ROW as the only countries that are missing WTO membership in our sample are: Belarus, Azerbaijan, Iran, Serbia, and Syria.
19. The original contribution of Viaene (Citation1982) considers separate unilateral specifications for the determination for import and export flows, whereas our approach primarily concerns the bilateral setting and includes variables related to and
in a single equation. Further, we also report unilateral estimates for alpha based on import and export modes.
20. The control set is implemented as an exogenous set of variables to the complete system of structural equations.
21. This period is chosen due to the data availability from Tajikistan.
22. Computed as , where
Afghanistan, Azerbaijan, Kazakhstan, Kyrgyz Republic, Tajikistan, Turkmenistan,
Uzbekistan, and
To obtain the final weights, we then compute the average share for a given SPECA economy across 2010–2019.
References
- Adarov, A. 2018. “Eurasian Economic Integration: Impact Evaluation Using the Gravity Model and the Synthetic Control Methods.” WIIW Working Paper 150. doi: 10.4337/9781782544760
- Adarov, A., and M. Ghodsi. 2021. “The Impact of the Eurasian Economic Union–Iran Preferential Trade Agreement on Mutual Trade at Aggregate and Sectoral Levels.” Eurasian Economic Review 11 (1): 125–157. doi:10.1007/s40822-020-00161-2.
- Ahmad, I. 2018. “Shanghai Cooperation Organization: China, Russia, and Regionalism in Central Asia.” In Initiatives of Regional Integration in Asia in Comparative Perspective, 119–135. Dordrecht: Springer. doi:10.1007/978-94-024-1211-6_6.
- Ambrosio, T. 2008. “Catching the ‘Shanghai Spirit’: How the Shanghai Cooperation Organization Promotes Authoritarian Norms in Central Asia.” Europe-Asia studies 60 (8): 1321–1344. doi:10.1080/09668130802292143.
- Babetskaia-Kukharchuk, O., and M. Maurel. 2004. “Russia’s Accession to the WTO: The Potential for Trade Increase.” Journal of Comparative Economics 32 (4): 680–699. doi:10.1016/j.jce.2004.08.005.
- Blanchard, O., and M. Kremer. 1997. “Disorganization.” The Quarterly Journal of Economics 112 (4): 1091–1126. doi:10.1162/003355300555439.
- Campos, N. F. 2004. “What Does WTO Membership Kindle in Transition Economies?: An Empirical Investigation.” Journal of Economic Integration 19 (2): 395–415. doi:10.11130/jei.2004.19.2.395.
- CAREC (Central Asia Regional Economic Cooperation Program). 2022. CAREC Project List Database. accessed November, 2022. https://www.carecprogram.org/?page_id=1726.
- Carrere, C., and C. Grigoriou. 2007. “Landlockedness, Infrastructure and Trade: New Estimates for Central Asian Countries.” World Bank Policy Research Working Paper no. 4335.
- Cieślik, A., and O. Gurshev. 2022. “Friends with or Without Benefits? An Empirical Evaluation of Bilateral Trade and Economic Integration Between Some of the Post-Soviet Economies.” Eurasian Economic Review 12 (4): 769–795. doi:10.1007/s40822-022-00213-9.
- Czerewacz-Filipowicz, K. 2019. “The Eurasian Economic Union as an Element of the Belt and Road Initiative.” Comparative Economic Research 22 (2): 23–37. doi:10.2478/cer-2019-0010.
- De Haas, M. 2017. “Relations of Central Asia with the Shanghai Cooperation Organization and the Collective Security Treaty Organization.” The Journal of Slavic Military Studies 30 (1): 1–16. doi:10.1080/13518046.2017.1271642.
- De Souza, V. L. 2011. “An Initial Estimation of the Economic Effects of the Creation of the EurAsec Customs Union on Its Members.” World Bank Economic Premise 47: 1–7.
- Djankov, S., and C. Freund. 2002a. “Trade Flows in the Former Soviet Union, 1987 to 1996.” Journal of Comparative Economics 30 (1): 76–90. doi:10.1006/jcec.2001.1752.
- Djankov, S., and C. Freund. 2002b. “New Borders: Evidence from the Former Soviet Union.” Weltwirtschaftliches Archiv 138 (3): 493–508. doi:10.1007/BF02707951.
- Dragneva, R., and K. Wolczuk. 2012. “Russia, the Eurasian Customs Union and the EU: Cooperation, Stagnation or Rivalry?” Chatham House Briefing Paper REP BP 1. doi:10.2139/ssrn.2125913
- EBRD (European Bank for Reconstruction and Development). 2012. Transition Report 2012: Integration Across Borders. London: European Bank for Reconstruction and Development.
- Facon, I. 2013. “Moscow’s Global Foreign and Security Strategy: Does the Shanghai Cooperation Organization Meet Russian Interests?” Asian Survey 53 (3): 461–483. doi:10.1525/as.2013.53.3.461.
- Falkowski, K. 2018. “Long-Term Comparative Advantages of the Eurasian Economic Union Member States in International Trade.” International Journal of Management and Economics 53 (4): 27–49. doi:10.1515/ijme-2017-0024.
- Feenstra, R. C., R. Inklaar, and M. P. Timmer. 2015. “The Next Generation of the Penn World Table.” The American Economic Review 105 (10): 3150–3182. doi:10.1257/aer.20130954.
- Fidrmuc, J., and J. Fidrmuc. 2003. “Disintegration and Trade.” Review of International Economics 11 (5): 811–829. doi:10.1046/j.1467-9396.2003.00419.x.
- Freeman, C. P. 2018. “New Strategies for an Old Rivalry? China-Russia Relations in Central Asia After the Energy Boom.” The Pacific Review 31 (5): 635–654. doi:10.1080/09512748.2017.1398775.
- Golovko, A., and H. Sahin. 2021. “Analysis of International Trade Integration of Eurasian Countries: Gravity Model Approach.” Eurasian Economic Review 11 (3): 519–548. doi:10.1007/s40822-021-00168-3.
- Head, K., T. Mayer, and J. Ries. 2010. “The Erosion of Colonial Trade Linkages After Independence.” Journal of International Economics 81 (1): 1–14. doi:10.1016/j.jinteco.2010.01.002.
- IMF (International Monetary Fund). 2022. Commodity terms of trade database (accessed July, 2022). https://data.imf.org/?sk=2CDDCCB8-0B59-43E9-B6A0-59210D5605D2
- Jensen, J., and D. G. Tarr. 2007. “The Impact of Kazakhstan Accession to the World Trade Organization: A Quantitative Assessment.” World Bank Publications 4142 1 (1): 1–53.
- Kaminski, B., Z. K. Wang, A. L. Winters, A. Sapir, and I P. Szekely. 1996. “Export Performance in Transition Economies.” Economic Policy 11 (23): 421–442. doi:10.2307/1344709.
- Konopelko, A. 2018. “Eurasian Economic Union: A Challenge for EU Policy Towards Kazakhstan.” Asia Europe Journal 16 (1): 1–17. doi:10.1007/s10308-017-0480-7.
- Libman, A., and E. Vinokurov. 2011. “Is It Really Different? Patterns of Regionalization in Post-Soviet Central Asia.” Post-Communist Economies 23 (4): 469–492. doi:10.1080/14631377.2011.623392.
- Lücke, M., and J. Rothert. 2006. “Central Asia’s Comparative Advantage in International Trade.” Kiel Economic Policy Papers 6.
- Mayer, T., and S. Zignago. 2011. “Notes on Cepii’s Distances Measures: The GeoDist Database.” CEPII Working Paper 2011-25. doi: 10.2139/ssrn.1994531
- Mazhikeyev, A., and T. H. Edwards. 2021. “Post-Colonial Trade Between Russia and Former Soviet Republics: Back to Big Brother?” Economic Change and Restructuring 54 (3): 877–918. doi:10.1007/s10644-020-09302-8.
- NBT (National Bank of Tajikistan). 2022. “The analytical table of export - import of the goods on the countries”. Accessed June 2022. https://nbt.tj/en/payments_balance/analytical_table.php
- Nitsch, V., and N. Wolf. 2013. “Tear Down This Wall: On the Persistence of Borders in Trade.” Canadian Journal of Economics/Revue Canadienne d’Économique 46 (1): 154–179. doi:10.1111/caje.12002.
- Oh, J., B. Yuldashev, and S. H. Moon. 2018. “Where is Uzbekistan’s Trade and Where Should It Be Directed? Gravity Analyses for Being Doubly Landlocked.” International Area Studies Review 21 (1): 68–84. doi:10.1177/2233865917745959.
- Pomfret, R. 2003. “Trade and Exchange Rate Policies in Formerly Centrally Planned Economies.” The World Economy 26 (4): 585–612. doi:10.1111/1467-9701.00538.
- Pomfret, R. 2005. “Trade Policies in Central Asia After EU Enlargement and Before Russian WTO Accession: Regionalism and Integration into the World Economy.” Economic Systems 29 (1): 32–58. doi:10.1016/j.ecosys.2005.01.002.
- Raballand, G., and A. Andrésy. 2007. “Why Should Trade Between Central Asia and China Continue to Expand?” Asia Europe Journal 5 (2): 235–252. doi:10.1007/s10308-007-0115-5.
- Raballand, G., A. Kunth, and R. Auty. 2005. “Central Asia’s Transport Cost Burden and Its Impact on Trade.” Economic Systems 29 (1): 6–31. doi:10.1016/j.ecosys.2005.02.004.
- Redding, S. J., and D. M. Sturm. 2008. “The Costs of Remoteness: Evidence from German Division and Reunification.” The American Economic Review 98 (5): 1766–1797. doi:10.1257/aer.98.5.1766.
- Sakwa, R., and M. Webber. 1999. “The Commonwealth of Independent States, 1991–1998: Stagnation and Survival.” Europe-Asia studies 51 (3): 379–415. doi:10.1080/09668139998912.
- SCO (Shanghai Cooperation Organization). 2020. “The Moscow declaration of the council of heads of state of the shanghai cooperation organization.” Shanghai Cooperation Organization, November 10 2020. Accessed August, 2022. http://eng.sectsco.org/load/690349/
- SPECA (United Nations Special Programme for the Economies of Central Asia). 2022. Speca work plans database (accessed August, 2022). https://unece.org/speca-work-plans
- State Committee on Statistics (State Committee of the Republic of Uzbekistan on Statistics) 2022. Merchandise trade data (accessed June, 2022). https://stat.uz/en/official-statistics/merchandise-trade
- Tarr, D. G. 2016. “The Eurasian Economic Union of Russia, Belarus, Kazakhstan, Armenia, and the Kyrgyz Republic: Can It Succeed Where Its Predecessor Failed?” Eastern European Economics 54 (1): 1–22. doi:10.1080/00128775.2015.1105672.
- Trenin, D. V. 2011. Post-Imperium: A Eurasian Story. Washington D.C.: Brookings Institution Press.
- Tsygankov, A. P. 2003. “Mastering Space in Eurasia: Russia’s Geopolitical Thinking After the Soviet Break-Up.” Communist and post-communist studies 36 (1): 101–127. doi:10.1016/S0967-067X(02)00055-7.
- UN (United Nations). 2022. COMTRADE database (accessed August, 2022). https://comtrade.un.org/data/
- Vakulchuk, R., I. Øverland, F. Aminjonov, A. Abylkasymova, B. Eshchanov, and D. Moldokanov. 2019. “BRI in Central Asia: Overview of Chinese Projects.” Central Asia Regional Data Review 20 (1): 1–5.
- Viaene, J. M. 1982. “A Customs Union Between Spain and the EEC: An Attempt at Quantification of the Long-Term Effects in a General Equilibrium Framework.” European economic review 18 (2): 345–368. doi:10.1016/S0014-2921(82)80045-7.
- Wen-Chih, Chao. 2022. “The Political Economy of China’s Rising Role in the Shanghai Cooperation Organization (SCO): Leading with Balance.” The Chinese Economy 55 (4): 293–302. doi:10.1080/10971475.2021.1972548.
- World Bank. 2022. World development indicators database (accessed August, 2022). https://databank.worldbank.org/source/world-development-indicators
- WTO (World Trade Organization). 2012a. “Working party seals the deal on Tajikistan’s accession negotiations.” World Trade Organization, 26 October 2012. Accessed July, 2022. https://www.wto.org/english/news_e/news12_e/acc_tjk_26oct12_e.htm
- WTO (World Trade Organization). 2012b. “Working party on the accession of the republic of Tajikistan submission № WT/AC/TJK/24.” World Trade Organization, 19 June 2012. Accessed August, 2022. https://docs.wto.org/dol2fe/Pages/SS/directdoc.aspx?filename=Q:/WT/ACC/TJK24A1.pdf&Open=True
- WTO (World Trade Organization). 2014. “Working party on the accession of Kazakhstan submission № WT/AC/KAZ/87.” World Trade Organization, 8 September 2014. Accessed August, 2022. https://docs.wto.org/dol2fe/Pages/SS/directdoc.aspx?filename=q:/WT/ACC/KAZ87.pdf&Open=True
- WTO (World Trade Organization). 2022a. WTO accessions database (accessed August, 2022). https://www.wto.org/english/thewto_e/acc_e/acc_e.htm
- WTO (World Trade Organization). 2022b. Regional trade agreements database (accessed August, 2022). https://rtais.wto.org/UI/PublicMaintainRTAHome.aspx