
Abstract
Objective: There is limited knowledge of the long-term medical consequences for occupants injured in car crashes in various impact directions. Thus, the objective was to evaluate whether injuries leading to permanent medical impairment differ depending on impact direction.
Methods: In total, 36,743 injured occupants in car crashes that occurred between 1995 and 2011 were included. All initial injuries (n = 61,440) were classified according to the Abbreviated Injury Scale (AIS) 2005. Injured car occupants were followed for at least 3 years to assess permanent medical impairment. The data were divided into different groups according to impact direction and levels of permanent impairment. The risk of permanent medical impairment was established for different body regions and injury severity levels, according to AIS.
Results: It was found that almost 12% of all car occupants sustained a permanent medical impairment. Given an injury, car occupants involved in rollover crashes had the highest overall risk to sustain a permanent medical impairment. Half of the head injuries leading to long-term consequences occurred in frontal impacts. Far-side occupants had almost the same risk as near-side occupants. Occupants who sustained a permanent medical impairment from cervical spine injuries had similar risk in all impact directions (13%) except from rollover (17%). However, these injuries occurred more often in rear crashes. Most of the injuries leading to long-term consequences were classified as minor injuries by AIS for all impact directions.
Conclusions: Studying crash data from a perspective of medical impairment is important to identify injuries that might not be prioritized only considering the AIS but might lead to lower quality of life for the occupant and also costs for society. These results can be used for road transport system strategies and for making priority decisions in vehicle design.
Introduction
When studying different kinds of injury severity, in the form of fatal, severe, and slightly injured car occupants, different types of crash distributions will be found. Bédard et al. (Citation2002) found that more than 65% of all fatal crashes in the United States involved a frontal impact. In one third of the crashes the occupant was fatally injured in a side impact and only 3.5% were injured in a rear impact. Based on Swedish crash data, single-vehicle crashes account for most casualties regardless of injury severity (Stigson et al. Citation2011). Focusing on fatal and serious injuries (Abbreviated Injury Scale [AIS] 2+), almost a third of all passenger car crashes are head-on crashes. However, this crash type only accounts for less than 10% if injuries with risk of long-term consequences (permanent medical impairment) are considered. Crashes at intersections and rear crashes account for significant higher proportion of crashes leading to injuries with a risk of permanent medical impairment.
Injuries tend to be more severe in side impacts than in front and rear-end collisions. A driver involved in a side impact has a fatality risk twice as high as that of drivers involved in frontal impacts (Farmer et al. Citation1997). Near-side occupants are at higher risk than far-side occupants and account for more than 70% of all side impact injuries (Laberge-Nadeau et al. Citation2009). The risk of severe or fatal injury is more than twice as high for a near-side occupant than for a far-side occupant. Occupant-to-occupant interaction has also been identified as a risk factor (Newland et al. Citation2008; Stigson and Kullgren Citation2011).
Road accidents constitute a major public health issue. As the number of fatalities decreases, focus on nonfatal outcomes leading to long-term consequences becomes more essential, due both to the consequences for the injured occupant and to the high societal cost. Focusing on nonfatal injuries leading to medical impairment, the vast majority are AIS 1 injuries (Bohman et al. Citation2014; Gustafsson et al. Citation2015). In Sweden, AIS 1 cervical spine injuries account for more than 50% of all traffic injuries leading to long‐term consequences. Kullgren et al. (Citation2013) have shown that 43% of all cervical spine injuries with long‐term symptoms occurred in rear impacts and 39 and 18%, respectively, occurred in frontal and side impacts. However, the risk of permanent medical impairment was almost the same regardless of impact direction. To the authors' knowledge, no study has shown risk for long-term consequences for various impact directions for all type of injuries. The objective was therefore to compare injury patterns and long-term medical consequences for car occupants involved in crashes with different impact directions.
Methods
Car crashes reported to Folksam, one of the largest insurance companies in Sweden with an approximately 22% market share, were included. Crashes occurring between 1995 and 2010 in which at least one car occupant was injured were randomly selected (approximately 30,000 out of approximately 150,000). The Folksam policy holders well represent the Swedish population with respect to age, gender, socioeconomic parameters, geographical area, etc. Each year Folksam handles approximately 50,000 motor vehicle claims, and approximately 10,000 persons annually report bodily injuries after a collision in a motor vehicle insured by Folksam. In total 61,440 diagnoses distributed among 36,743 injured car occupants were included. The analysis focuses exclusively on injured car occupants, excluding fatalities (218). Both the method and the data used in the present study were used and described in Gustafsson et al. (Citation2015).
Initial Injury Diagnosis Coding
The occupants' injury data were taken from medical and/or claim files at Folksam. For minor injuries (AIS 1), such as external contusions, muscle strains, or small lacerations, where the inconvenience of the injury soon passed and the injured person had no further claims, no further medical files were requested. For all other injuries, medical files were collected and stored in the claim files. All initial diagnoses, including self-reported minor injuries, were classified according to AIS-2005 (Association for the Advancement of Automotive Medicine Citation2005). The classification was made by a group of 5 AIS-trained persons with an average experience of more than 10 years. The injuries are categorized according to the 9 body regions of AIS-2005, except for the region spine, which are further divided into cervical, thoracic, and lumbar spine. The external group includes all lacerations, contusions, abrasions, and burns, independent of their location on the body, as used in the study by Malm et al. (Citation2008). It is known from Malm et al. (Citation2008) that given an injury, there are differences in risk for permanent medical impairment (PMI) regarding the cervical, thoracic, and lumbar spine.
Table 1 Characteristics of the data set, including average number of injuries per occupant, mean age, median age, age range, and gender by impact directions
Assessing Medical Impairment
If an injured occupant has still not recovered from the injury, the injury is assessed by consultant medical doctors based on documented medical files. They determine the amount of medical impairment with the help of grading rules called Grading Medical Impairment (Sveriges Försäkringsförbund Citation2013). These rules are used by all Swedish insurance companies. When assessing the injury, all patient records before and after the car crash are available, so the estimated degree of impairment is the functional reduction originating from the car crash. A degree of permanent medical impairment is assessed between 1 and 99% regardless of the claimant's profession or hobbies. If the medical impairment is above 10%, or at the injured occupant's request, the case is also assessed by a public commission (Swedish Road Traffic Injuries Commission), which makes its own examination of the case. If an injured occupant received several diagnoses that resulted in medical impairment, a cumulative value of impairment was set. In 586 cases the injured occupant received more than one diagnosis that resulted in medical impairment from the same occurrence. Because the study aims to compare risk for PMI given a diagnosis, no consideration has been given to cumulative impairment values. The PMI values used are for single diagnoses. The medical impairment grade is initially temporary and becomes permanent when further improvement is unlikely. This usually happens after about 3 years, but may take longer; for example, if the person affected is a growing child, where it is hard to decide whether any further improvement will occur. In a few cases the degree of medical impairment can be set directly after the injury; for example, if the patient incurs an amputation of a hand. If an injured occupant stopped being assessed before a permanent medical impairment grade was set—for example, died from natural causes—the last set grade of medical impairment was used.
Degree of Medical Impairment
In the present study, a PMI with at least an impairment degree of 1% or more, respectively 10% or more (PMI 1+ and PMI10+, respectively), were used as measurements. Though PMI 1+ includes all levels of impairments, a PMI10+ results in persistent symptoms affecting activities of daily living of a person connected to at least one of the following aspects; loss of motion, pain, and cognitive influence. Examples of medical impairment grades are up to 18% for whiplash-associated disorders (WAD), 8% for amputation of the distal phalanx of the thumb, between 1 and 40% for extremity joint injuries, and between 20 and 97% for spinal cord injuries.
Analysis
To study the influence of impact direction, the data set was divided into subgroups: frontal, side, rear, rollover, and other/unknown. The side impacts were further classified as near- or far-side depending on the position of the case occupant in relation to the side of the impact (near-side when occupant is adjacent to intruding structure). In 553 of the side impacts the position of the occupant was unknown and therefore no further classification was made. Classification of the impact direction was made based on information from car reports and photos in the claim files. Gustafsson et al. (Citation2015) have shown that long-term outcomes were dependent on both gender and age. To study the influence of age, the data set was also divided into 4 subgroups regarding the occupant's age: 18–29, 30–44, 45–59, and 60 years of age and above. The groups were also separated by gender. Bohman et al. (Citation2014) have shown that younger occupants (0–12 years) have different injury distributions compared to adults. The risk of injuries resulting in PMI was lower for children. Occupants below 18 years of age are included but are not reported as a discrete subgroup due to the low number of cases. In 280 cases out of the 36,753, the age was unknown and in 125 cases gender was unknown.
Risk for PMI is calculated by dividing the number of injuries resulting in medical impairment at a certain level (i.e., PMI 1+ or PMI 10+) by the number of initial injuries for that body region. Because it is not known how many uninjured car occupants were involved in car crashes, no absolute risk for PMI can be ascertained from the present study. Presented risk for PMI is thus “in the event of an injury/diagnosis.” To estimate confidence intervals for the risk of a sustained diagnosis resulting in PMI to a specific body region or a specific AIS severity, exact binomial confidence intervals (95%) were derived. Fisher's exact test was used to analyze whether there was a difference in proportions of diagnoses between the categories. In all analyses, 95% confidence intervals were used and P values from Fisher's exact tests were calculated using SPSS 20 (IBM Citation2013).
Results
Of the 36,743 injured occupants, 11.8% received a PMI 1+ and of these 56.5% were females and 43.5% males (). In total, 5,121 of 61,440 initial injuries resulted in PMI 1+. The occupants who sustained PMI 1+ were significantly older. Most of the occupants were injured in rear impacts (43.2%), followed by frontal (32.7%), side impacts (12.9%), and rollover (4.9%). Occupants involved in rollover sustained a significantly higher number of initial injuries (3.3 injuries/occupant). Furthermore, these occupants were in general younger and to a greater extent males. Occupants involved in rear impacts sustained the lowest number of initial injuries (1.4 injuries/occupant).
Both the initial injury distributions as well as injuries leading to PMI 1+ differ within the subgroups as well as between the subgroups. For example, in frontal impacts head injuries account for less than 3% of all injuries. However, they account for much higher proportion (22%) of injuries leading to a higher degree of PMI (PMI 10+;Table A, see online supplement). In rear impacts the proportion of injuries leading to PMI 10+ was mainly cervical spine injuries (96%). In the event of an injury, rollover crashes caused the highest overall risk to sustain a PMI 1+ (17.7 ± 1.8%). The injury risk in the other impact directions were as follows: Frontal 11.7± 0.6%, near-side 10.8 ± 1.1%, far-side 12.5 ± 1.8%, rear 11.5 ± 0.5%, and other/unknown 13.1 ± 1.4%.
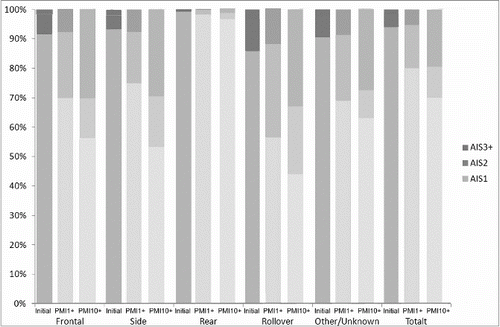
Most of the injuries leading to long-term consequences both on PMI 1+ and PMI 10+ level were minor injuries, AIS 1 (80 and 70%, respectively; ). Except from rear impact, around one third of the total number of severely impaired occupants (PMI 10+) sustained an injury classified as AIS 3+. In general, occupants who sustained injuries to the lower extremities followed by upper extremities had the highest risk for PMI 1+. Cervical spine injuries follow by head injuries were the most common among severe impairing injuries, PMI 10+ (). Half of the head injuries leading to long-term consequences, both PMI 1+ and PMI10+, occurred in frontal impacts.
Table 2 Number of initial injuries and proportion in percentage of permanent medical impairment (PMI 1+) and severe permanent medical impairment (PMI 10+)
Far-side occupants had the same risk of PMI 1+ as near-side occupants, although near-side occupant tend to have a higher risk for both upper and lower extremities. In rear impacts the number of injuries to the spine (cervical, thoracic, and lumbar) accounts for a majority of the injuries (84.1% of initial injuries, 95.8% of PMI 1+, 97.0% of PMI 10+). Two thirds of the initial injuries in rear impacts were cervical spine injuries, which is more than 2 times higher than in the other impact directions. However, the risk for PMI 1+ regarding cervical spine injuries was similar in all impact directions (13%) except from rollover (17.2 ± 2.3%, P < 0.001; ). WADs (AIS 1 cervical spine) represent 64% of all injuries leading to PMI 1+. The risk was higher for cervical spine injuries in rollovers, for both spine injuries when WAD was included as well as cervical spine fractures compared to other impact directions. However, most of the cervical spine injuries that lead to PMI 1+ occurred more often in rear impacts followed by frontal impacts.
When studying fractures to the spine, some interesting findings were observed. In general, a high proportion of spine fractures lead to PMI 1+ (48%; Table B, see online supplement). The proportion of fractures to the spine was higher in rollover compared to other impact types (approximately 3% compared to 1%). An indication of a higher proportion of PMI 1+ for spine fractures (cervical, thoracic, and lumbar spine) was found in far-side impacts compared to all other impact types, though this was not significant.
Discussion
To understand the factors associated with injuries with long‐term consequences is important, both to improve knowledge regarding variations in injury mechanism and to identify the highest priorities for development of countermeasures to reduce injuries. Targets have been set for fatalities for many years and results have been promising, with a substantial reduction of fatalities (European Transport Safety Council Citation2011). In a simple situation, targets and actions to reduce and eliminate deaths in road traffic crashes would also address serious injuries and injuries with long‐term consequences. However, efforts from the car industry have resulted in a much higher reduction of seriously and fatally injured occupants than injuries with long‐term consequences (Folksam Citation2013). Injuries classified as AIS 1 include a majority of both initial injuries as well as injuries leading to PMI 1+, mostly because of the high number of WADs. In total WAD represent 64% of all injuries leading to PMI 1+. Only a fifth of injuries leading to PMI 1+ were AIS 2+ injuries. The corresponding figure for PMI 10+ was a third. AIS 3+ is often specified as a relevant level of injury in the car industry. By applying the same method on this data set, 95% of injuries leading to PMI 1+ and 80% of injuries leading to PMI 10+ would not have been detected because they were classified as AIS 1 and AIS 2. As Tingvall et al. (Citation2013) have shown, a target set on MAIS 3+ injuries and fatalities would result in a potential risk for neglecting problems that might lead to impairments.
There are limited data available that reveal the actual risk of sustaining PMI. The present study was based on the insurance policyholders' claim reports to their insurance company (Folksam). Such reports are mandatory in order to receive payment for expenses and occupant injuries. Therefore, less-injured occupants are also included in the present study. This makes the data more accurate and prevents overestimation of the risk for PMI, which could occur otherwise. However, it is not known how many uninjured car occupants were involved in car crashes. No absolute risk for PMI can be ascertained from the present study and therefore the presented risk for PMI is thus in the event of an injury/diagnosis. Knowledge about injury prevention regarding long-term medical consequences is limited. Few have the possibility to follow an initial injury over time to establish possible long-term consequences. In the present study, the aim was to examine the whole spectrum of injuries and therefore self-reported injuries are both important and substantial. Insurance claims represent a higher amount of at least AIS 1 injuries, especially cervical strain injuries, compared to hospital data. Approximately half of all injuries in car collisions are reported as cervical strain injuries compared to a quarter of injured car occupants attending hospital (Fredlund Citation2006; Gustafsson et al. Citation2015; Malm et al. Citation2008).
In retrospective surveys like the present study, underreporting due to memory distortion and overreporting due to exaggeration may bias the analyses (Harel et al. Citation1994; Mock et al. Citation1999). Other studies have shown acceptable reliability in self-administered reports of specific injury details, such as the body part injured, but self-administered reports have been found to not correspond sufficiently to medical records (Valuri et al. Citation2005).
Rollover has been identified as a high risk factor. Car occupants involved in rollover crashes had the highest overall risk to sustain a permanent medical impairment, which is the same when severe and fatal injuries are considered (NHTSA Citation2010). Rollover crashes often occur at high speed and as a result of another event, causing whole or partial ejection from the seat belt (if belted) or the car. Occupant ejection or contact to vehicle interior, in combination with roof crush, has increases the risk of serious injuries (Funk et al. Citation2012). To provide protection in rollovers, car manufacturers have added side curtain airbags. Curtains that deploy in rollover crashes show a statistically significant effect in first-event rollovers: The estimated fatality reduction is 41.3% (confidence bounds, 22.5 to 55.5%; Kahane Citation2014). Analyses should be repeated in about 3 or 4 years, when there will be considerably more data available.
The present study shows that far-side occupants had the same risk as near-side occupants. Near-side occupants had a higher proportion of AIS 1 injuries leading to PMI 10+ than far-side occupants. The opposite relation was found by comparing AIS 2+ injuries leading to PMI 10+. One possible explanation for this could be that a higher crash severity is needed to injure a far-side occupant. Furthermore, far-side occupants have almost the same risk for PMI on PMI 1+ and even higher risk for PMI on PMI10+ compared to near-side occupants among lower extremity injuries. The center console has previously been identified as a possible cause for pelvis, hip, and femur fractures for far-side occupants (Banglmaier et al. Citation2003; Tencer et al. Citation2007). It could be a contributing reason for the high risk for PMI among lower extremity injuries among side occupants. As previous studies have pointed out, injury protection for far-side occupants needs to be addressed (Bostrom et al. Citation2008).
Rear impacts differ from the other impact directions, which could be explained by the lower crash severity. It is known from previous studies that the crash severity in all crashes is on average more than 2 times higher in frontal crashes compare to rear impacts (Stigson et al. 2009).
A high number of spine fractures regardless of the impact direction were found in the present study. Previous studies have shown that the most common types of spine fractures are compression fractures and burst fractures (Rao et al. Citation2014). Burst fractures were found to be more common for occupants restrained by 3-point seat belts than unbelted or restrained by 2-point belts, indicating that this might be an injury to address for future restraint systems. Based on German data, Müller et al (Citation2014) compared occupants who sustained spine fractures with occupants who sustained other injuries and found that the distribution of impact direction differed. Occupants with spine fracture were more often involved in a multiple collision or in a rollover. Furthermore, Ridella and Eigen (Citation2008) found that the spine was the most commonly injured body region in rollover crashes. In the present study, the proportion of cervical spine fractures was higher in rollover than in other impact directions. However, the highest risk for PMI for spine fractures was found in far-side impacts. These findings show the same trend as for serious spine injuries where the risk of injury was highest in rollover followed by far-side crashes (Funk et al. Citation2012). Furthermore, side impacts compared to frontal impacts have been shown to generate a higher risk of cervical spine fracture (Stein et al. Citation2011). The association of increasing age and risk of cervical spine fracture was more pronounced in frontal impacts. In general, occupants who sustained PMI in the present study were significant older. Gustafsson et al. (Citation2015) showed that both age and gender affect the risk of PMI following car crashes. However, the correlation of older age and impairment risk was not as clear as has been found for fatality risk in a car crash (Augenstein et al. Citation2005; Bédard et al. Citation2002; Braver and Trempel Citation2004).
Injury outcome for various impact directions has been studied previously, often based on police-reported crashes with injuries classified as minor, serious, and fatal. In addition, outcomes for injury severity according to the AIS have been studied. The present study is a first attempt to provide insight regarding injuries resulting in PMI with respect to impact direction. These injuries should be assessed in the future with a relevant tool. With the development of a more biofidelic spine, a portion of the whiplash injuries have been addressed (Davidsson et al. Citation1998). Further development of head injury criteria, such as BrIC, for frontal and side impact dummies can hopefully address part of the head injuries leading to PMI (Takhounts et al. Citation2013). Regarding spine fractures and injuries to upper and lower extremities finite element human body models, such as Total Human Model for Safety and Global Human Body Models Consortium, might be valuable tools in the future.
Because the aim was to study long-term impairment, fatalities were excluded. Fatality risks and distributions of fatalities are well known from previous research and are well documented in national injury statistics. It is, however, important to consider injuries leading to both fatality and permanent medical impairment in order to design a safe road transport system.
There are other scales predicting long-term consequences, such as the Injury Impairment Scale (Association for the Advancement of Automotive Medicine Citation1994) and the Functional Capacity Index (MacKenzie et al. Citation1996) that produce one single score for each injury diagnosis. This appears to be very attractive, but there are many problems to overcome. The impairment outcome from an injury varies substantially from person to person concerning risk as well as severity of impairment. Attempts to combine risk and severity into one single score (such as Injury Impairment Scale or Functional Capacity Index) would probably simplify the impairment outcome but the advantage with PMI is that the risk of impairment can be calculated for various degrees of impairment. Risk for PMI, which has been used in the present study, is based on a national system where pain and physical and/or mental dysfunction are assessed by medical specialists in the absence of internationally accepted measurements. There is an urgent need to establish a predictive impairment scale that could be accepted internationally and not only mirror the initial AIS outcome.
Most of the injuries leading to long-term consequences on both PMI 1+ and PMI10+ levels were classified as minor injuries by AIS (56–98% and 44–96%, respectively) for all impact directions. Hence, there is a need to address impairment to a higher extent in injury classification. The proportion of rollover was relatively low (5%). However, being in a rollover crash means a high risk of permanent medical impairment (17.7 ± 1.8% compared to an average of the other crash types of 11.5 ± 0.3%). Half of the head injuries leading to long-term consequences, both PMI 1+ and PMI10+, occurred in frontal impacts. Therefore, further efforts to reduce head injuries in frontal impacts are needed. Injuries to the cervical spine were the most common impairing injury for all impact directions on PMI 1+ and PMI10+ levels, followed by extremity and/or head injuries, depending on impairment level. The majority of spine injuries occurred in rear impacts, but the risk of permanent medical impairment was almost the same regardless of impact direction. Furthermore, a high proportion of spine fractures lead to permanent medical impairment. Therefore, it is important that the car industry offer occupant protection for spine injuries in all impact directions.
Supplemental Materials
Supplemental data for this article can be accessed on the publisher's website
Appendix
Download PDF (38.9 KB)References
- Association for the Advancement of Automotive Medicine (AAAM). Injury Impairment Scale (IIS). Des Plaines, IL: Author; 1994.
- Association for the Advancement of Automotive Medicine. Abbreviated Injury Scale. Barrington, IL: Author; 2005.
- Augenstein J, Digges K, Bahouth G, Dalmotas D, Perdeck E, Stratton J. Investigation of the performance of safety systems for protection of the elderly. Annu Proc Assoc Adv Automot Med. 2005;49:361–369.
- Banglmaier RF, Rouhana SW, Beillas P, Yang KH. Lower extremity injuries in lateral impact: a retrospective study. Annu Proc Assoc Adv Automot Med. 2003;47:425–444.
- Bédard M, Guyatt GH, Stones MJ, Hirdes JP. The independent contribution of driver, crash, and vehicle characteristics to driver fatalities. Accid Anal Prev. 2002;34:717–727.
- Bohman K, Stigson H, Krafft M. Long-term medical consequences for child occupants 0 to 12 years injured in car crashes. Traffic Inj Prev. 2014;15:370–378.
- Bostrom O, Gabler HC, Digges K, Fildes B, Sunnevang C. Injury reduction opportunities of far side impact countermeasures. Ann Adv Automot Med. 2008;52:289–300.
- Braver ER, Trempel RE. Are older drivers actually at higher risk of involvement in collisions resulting in deaths or non-fatal injuries among their passengers and other road users? Inj Prev. 2004;10:27–32.
- Davidsson J, Svensson MY, Flogård A, et al. BioRID I—a new biofidelic rear impact dummy. Paper presented at: International Conference on the Biomechanics of Impact (IRCOBI); 1998; Göteborg, Sweden.
- European Transport Safety Council. 2010 Road Safety Target Outcome: 100 000 Fewer Deaths Since 2001. Brussels, Belgium: Author; 2011.
- Farmer CM, Braver ER, Mitter EL. Two-vehicle side impact crashes: the relationship of vehicle and crash characteristics to injury severity. Accid Anal Prev. 1997;29:399–406.
- Folksam. How safe is your car? Paper presented at: Tylösands Seminariet; 2013; Halmstad, Sweden.
- Fredlund T. Svår Eller Allvarlig Skada—En Jämförelse av Tre Definitioner [Severe or Serious Injury - A Comparison of Three Definitions]. Stockholm, Sweden: Vägverket; 2006 (in Swedish).
- Funk JR, Cormier JM, Manoogian SJ. Comparison of risk factors for cervical spine, head, serious, and fatal injury in rollover crashes. Accid Anal Prev. 2012;45:67–74.
- Gustafsson M, Stigson H, Krafft M, Kullgren A. Risk of permanent medical impairment (RPMI) in car crashes correlated to age and gender. Traffic Inj Prev. 2015;16:353–361.
- Harel Y, Overpeck MD, Jones DH, et al. The effects of recall on estimating annual nonfatal injury rates for children and adolescents. Am J Public Health. 1994;84:599–605.
- IBM. IBM SPSS software [CT500]. Author; 2013. Available at: http://www-03.ibm.com/software/products/en/spss-stats-standard/. Accessed: August 24, 2014.
- Kahane CJ. Updated Estimates of Fatality Reduction by Curtain and Side Air Bags in Side Impacts and Preliminary Analyses of Rollover Curtains. Washington, DC: NHTSA; 2014. Report No. DOT HS 811 882.
- Kullgren A, Stigson H, Krafft M. Development of whiplash associated disorders for male and female car occupants in cars launched since the 80s in different impact directions. Paper presented at: International IRCOBI Conference on the Biomechanics of Injury; 2013; Gothenburg, Sweden.
- Laberge-Nadeau C, Bellavance F, Messier S, Vezina L, Pichette F. Occupant injury severity from lateral collisions: a literature review. J Safety Res. 2009;40:427–435.
- MacKenzie EJ, Damiano A, Miller T, Luchter S. The development of the Functional Capacity Index. J Trauma. 1996;41:799–807.
- Malm S, Krafft M, Kullgren A, Ydenius A, Tingvall C. Risk of permanent medical impairment (RPMI) in road traffic accidents. Annu Proc Assoc Adv Automot Med. 2008;52:93–100.
- Mock C, Acheampong F, Adjei S, Koepsell T. The effect of recall on estimation of incidence rates for injury in Ghana. Int J Epidemiol. 1999;28:750–755.
- Müller CW, Otte D, Decker S, et al. Vertebral fractures in motor vehicle accidents—a medical and technical analysis of 33,015 injured front-seat occupants. Accid Anal Prev. 2014;66C:15–19.
- Newland C, Belcher T, Bostrom O, et al. Occupant-to-occupant interaction and impact injury risk in side impact crashes. Stapp Car Crash J. 2008;52:327–347.
- NHTSA. Traffic Safety Facts: 2008 Data. Washington, DC: Author; 2010. DOT HS 811 368, 12.
- Rao RD, Berry C, Yoganandan N, Agarwal A. Occupant and crash characteristics in thoracic and lumbar spine injuries resulting from motor vehicle collisions. Spine J. 2014
- Ridella SA, Eigen AM. Biomechanical investigation of injury mechanisms in rollover crashes from the ciren database. Paper presented at: Proceedings of the 2008 International IRCOBI Conference on the Biomechanics of Impact; September 17–19, 2008; Bern, Switzerland.
- Stein DM, Kufera JA, Ho SM, et al. Occupant and crash characteristics for case occupants with cervical spine injuries sustained in motor vehicle collisions. J Trauma. 2011;70:299–309.
- Stigson H, Kullgren A. Effect of side impact protection in reducing injuries. Paper presented at: 22th International Conference on the Enhanced Safety Vehicles (ESV); 2011; Washington, DC.
- Stigson H, Kullgren A, Krafft M. Use of car crashes resulting in injuries to identify system weaknesses. Paper presented at: 22th International Conference on the Enhanced Safety Vehicles (ESV); 2011; Washington, DC.
- Stigson H, Ydenius A, Kullgren A. Variation in crash severity depending on different vehicle types and objects as collision partner. Int J Crashworthiness. 2009;14:613–622.
- Sveriges Försäkringsförbund. Medicinsk Invaliditet-Skador 2013 [Insurance Sweden Medical Impairment 2013]. Stockholm, Sweden: Author; 2013 (in Swedish). Available at: http://www.svenskforsakring.se/PageFiles/3123/Medicinsk_invaliditet_skador_rev_jan2014.pdf. Accessed April 30, 2015.
- Takhounts EG, Craig MJ, Moorhouse K, McFadden J, Hasija V. Development of brain injury criteria (BrIC). Stapp Car Crash J. 2013;57:243–266.
- Tencer AF, Kaufman R, Huber P, Mock C, Rout ML. Reducing primary and secondary impact loads on the pelvis during side impact. Traffic Inj Prev. 2007;8:101–106.
- Tingvall C, Ifver J, Krafft M, et al. The consequences of adopting a MAIS 3 injury target for road safety in the EU, a comparison with targets based on fatalities and long-term consequences. Paper presented at: International IRCOBI Conference on the Biomechanics of Injury; 2013; Gothenburg, Sweden.
- Valuri G, Stevenson M, Finch C, Hamer P, Elliott B. The validity of a four week self-recall of sports injuries. Inj Prev. 2005;11(3):135–137.