
 ?Mathematical formulae have been encoded as MathML and are displayed in this HTML version using MathJax in order to improve their display. Uncheck the box to turn MathJax off. This feature requires Javascript. Click on a formula to zoom.
ABSTRACT
Objective: A multiharm approach for analyzing crash and injury data was developed for the ultimate purpose of getting a richer picture of motor vehicle crash outcomes for identifying research opportunities in crash safety.
Methods: Methods were illustrated using a retrospective analysis of 69,597 occupant cases from NASS CDS from 2005 to 2015. Occupant cases were analyzed by frequency and severity of outcome: fatality, injury by Abbreviated Injury Scale (AIS), number of cases, attributable fatality, disability, and injury costs. Comparative analysis variables included precrash scenario, impact type, and injured body region.
Results: Crash and injury prevention opportunities vary depending on the search parameters. For example, occupants in rear-end crash scenarios were more frequent than in any other precrash configuration, yet there were significantly more fatalities and serious injury cases in control loss, road departure, and opposite direction crashes. Fatality is most frequently associated with head and thorax injury, and disability is primarily associated with extremity injury. Costs attributed to specific body regions are more evenly distributed, dominated by injuries to the head, thorax, and extremities but with contributions from all body regions. Though AIS 3+ can be used as a single measure of harm, an analysis based on multiple measures of harm gives a much more detailed picture of the risk presented by a particular injury or set of crash conditions.
Conclusions: The developed methods represent a new approach to crash data mining that is expected to be useful for the identification of research priorities and opportunities for reduction of crashes and injuries. As the pace of crash safety improvement accelerates with innovations in both active and passive safety, these techniques for combining outcome measures for insights beyond fatality and serious injury will be increasingly valuable.
Introduction
The analysis of real-world crashes and injuries is essential for crash injury prevention efforts. Focused crash epidemiology studies can contribute to every stage of research and crash safety improvement, including research on human behavior and physical injury mechanisms, injury risk definition, benefits estimation, and in the development of representative test configurations. However, crash data can also be used to obtain a broad picture of crash risks and outcomes for the identification of research and injury prevention opportunities and priorities.
Previous efforts to use retrospective crash data to identify potential areas of safety improvement for injury and crash reduction have used a variety of single outcome measures including fatality and injury metrics based on the Abbreviated Injury Scale (AIS; Gennarelli and Wodzin Citation2006). Each occupant's maximum severity injury on the AIS severity scale, the MAIS, is often used as a single severity output, whereas systems such as the Injury Severity Scale (ISS) make use of mathematical combinations of the severity score of multiple injuries (Baker et al. Citation1974). The societal cost of injury based on AIS severity was estimated as a harm score by Malliaris et al. (Citation1985), though more recent estimates of cost by AIS codes are specific to body region and injury type (Blincoe et al. Citation2015; Eigen and Martin Citation2005). Isolated estimates of mortality and disability can also be made based on AIS-coded injuries (Eigen and Martin Citation2005; MacKenzie et al. Citation1994; Malm et al. Citation2008; Weaver et al. Citation2013).
Different safety priorities emerge depending on the injury measures and search categories used for crash data analysis. None of the individual injury measures alone gives a full picture of the societal or individual harm associated with specific injuries or crash conditions: a multiharm perspective is needed to get a detailed and nuanced understanding of the risk and negative outcomes associated with particular injuries and particular sets of crash conditions.
A multiharm perspective on crash data analysis may increase in importance if fatality rates in modern vehicles continue to fall as they have overall over the last decade (National Center for Statistics and Analysis Citation2016). Though fatality reduction is still of utmost importance with more than 30,000 deaths on U.S. roadways per year, the importance of injury reduction among survivors is increasingly urgent. Furthermore, technological innovations are making ever more focused improvements in vehicle safety possible: crash avoidance technology can target specific crash types such as lane change collisions, and modern anthropomorphic test devices (i.e., crash test dummies) are offering opportunities to evaluate protection in an expanding number of crash configurations. The THOR-50M and WorldSID dummies, for example, are now capable of predicting injury in nonpure impact directions where previous dummies were ineffective, increasing the relevance of data on oblique crashes. Protection to specific body regions is also increasing as vehicle protection is optimized to prevent particular injuries and test dummy measurement capabilities are increasing. The THOR-50M lower extremity, for example, can measure complex loading of the ankle (NHTSA Citation2016). This growing capability to focus vehicle safety improvements on very specific crash safety and injury risks increases the potential for detailed real-world crash data to identify and prioritize the most critical vehicle safety and occupant protection needs.
The current study provides a framework for a multiharm analysis of retrospective crash data, presenting methods to take a broad look at crash data for the purpose of identifying opportunities for safety improvement in occupant crashes. Though methods in this article are illustrated using an 11-year retrospective analysis of U.S. motor vehicle occupant crashes, these principles can be applied to any broad search of injury data.
Methods
Source data
Analysis was based on cases from NASS CDS from 2005 to 2015. Occupant cases where injury details were unknown were excluded by limiting cases to those where the number of injuries (INJNUM) was between 0 and 96. Noncrash injuries, such as inhalation and drowning, and occupants who had only these injuries were excluded from the analysis. Injuries of unknown severity and occupants with only these injuries were also excluded from the analysis. Cases where age or crash conditions were unknown were only excluded for analyses based on those variables. All analyses were performed on weighted case data. Fatal cases were reweighted so that the total weighted number of fatalities matched the total number of CDS-applicable fatalities in the Fatality Analysis Reporting System (FARS) during the same time period.
Harm measures
Fatality
Fatality was determined by the CDS treatment variable (TREATMNT), which indicates death within 30 days of crash as a consequence of crash injuries (NHTSA Citation2015a).
AIS
Cases were sorted by injury severity according to the AIS, Version 1990/98 Update (Association for the Advancement of Automotive Medicine [AAAM] Citation1998), because the majority of hard-coded cases in the 2005–2015 NASS CDS data set were initially coded with that version. Cases from 2010 and later, hard-coded in NASS CDS using the NHTSA Injury Coding Manual that was based on AAAM's 2005 AIS (Update 2008; AAAM Citation2008), were converted to correspond to Version 1990/98 Update codes based on the values supplied in the CDS files, mapped as recommended in the AIS 2005 coding manual. Additionally, for bilateral injuries coded in the newer version of AIS where the recommended AIS 1990/Update 1998–equivalent code is a single injury, 2 separate injuries were included in the current analysis. For example, instead of directly converting an AIS 2005 bilateral traumatic amputation of the upper extremities at the elbow (AIS 711002.5) to a single AIS 1998 AIS 3 amputation of the upper extremity (AIS 711000.3), the current analysis includes two instances of the AIS 1998 code for the occupant. For AIS 2005 codes that do not have a recommended AIS 1990/Update 1998 translation code, the hard-coded AIS 2005 AIS injury severity was used directly to categorize the injury severity of the case by MAIS and to identify the body region of the injury. Converting to the older system reduced the number of cases that needed to be translated, minimizing the potential loss of detail and accuracy that is inherent in conversion of injury codes between coding systems.
Analyses of MAIS are based on each occupant's most serious injury on the AIS severity scale, with AIS 6 being greatest. MAIS analyses aggregating cases by severe or worse (MAIS 4+), serious or worse (MAIS 3+), and moderate or worse (MAIS 2+) all include fatal cases regardless of coded MAIS.
Disability
The Functional Capacity Index (FCI) is a measure of predicted disability at 1-year postinjury. Each 7-digit AIS code is assigned an FCI from 0 to 100%, where 0 is no disability and 100 is complete disability (MacKenzie et al. Citation1996; Segui-Gomez Citation1996). These values were developed based on evaluation of how each injury affects categories of function (mobility, cognition, etc.) and the relative importance of each category of function. Each occupant's overall FCI is equal to his highest FCI injury. An occupant's FCI does not reflect observed or documented disability for that occupant but rather the percentage of disability that would be expected given his AIS-coded injuries. The magnitude of the total FCI across a group of occupants represents the total number of people that are expected to be completely disabled. In reality, of course, the FCI is an estimate of the sum of the partial disabilities of individuals with a wide range of disabling injuries.
In the current study, the disability analysis was performed on all occupants aged 18 and older as an aggregate group because age-specific disability estimates are not available. Although the FCI framework and disability estimates were developed based on patients aged 18 to 34, the method can be applied to occupants older than this range under the assumption that the resulting disability estimates may, in some cases, underestimate the total disability (M. Segui-Gomez, Directorate General for Traffic of Spain, personal communication, October 4, 2011).
Cost
Each occupant was assigned an estimated cost based on 7-digit AIS codes (Blincoe et al. Citation2015). For cases from 2010 and later, hard-coded in AIS 2005, the translated AIS 1990/Update 1998 code was used if available. If no equivalent AIS 1990/Update 1998 code was recommended, the regions, structure type, specific structure, and AIS severity digits of the untranslated AIS 2005 code were used. Where injury categories were ambiguous, categorization of AIS-coded injuries into the cost-study injury bins was done in consultation with the authors of the original study (T. Miller, Pacific Institute for Research and Evaluation, personal communication, February 12, 2015). Injuries coded as burns with AIS severity 3 or 4 were assigned the cost associated with AIS 2 burns, because there were no costs available for these higher severities. For nonfatal cases, each coded injury is keyed to a cost that includes medical and emergency services, lost household and wage work, and legal and insurance costs in 2010 dollars. This total does not include property damage or values associated with lost quality of life. A per occupant cost is then set to each occupant's highest cost injury. A cost of $1,381,984 is applied to fatal cases. Uninjured occupants were assigned a cost of $0 in the current study.
As with the estimated disability resulting from an occupant's injuries, the estimated cost associated with an individual does not reflect actual or documented medical costs but rather an estimate of costs expected given the individual's AIS-coded injuries.
Attributable fatality
In potentially fatal cases, the contribution of individual injury types to the resulting death can be estimated with the “attributable fatality” method developed by Hasija et al. (Citation2006). Using that methodology, the probability of fatality (p(fatal)) can be modeled as a generalized logistic function Equation Equation1(1)
(1) :
(1)
(1) and MR1, MR2, and MR3 are the “mortality rank” (MR) values corresponding to the top 3 injuries, respectively, and a0, a1, a2, a3, and d are function parameters. In this way, the probability of fatality is calculated based on each occupant's 3 most serious injuries. Calculation of the fatalities attributable to a particular body region is a 3-step process:
| 1. | The expected number of fatalities in a data set is estimated by summing the p(fatal) for all occupants. | ||||
| 2. | All injuries to the body region of interest are deleted, p(fatal) is recalculated for each case, and a revised expected number of fatalities is estimated by summing the recalculated p(fatal) for all occupants. | ||||
| 3. | The difference between the expected number of fatalities (from 1) and the revised expected number of fatalities absent injuries to the body region of interest (from 2) is the number of fatalities attributable to injuries in the given body region. | ||||
MR values for AIS 2+ injuries were optimized along with the 5 function parameters using fatal and nonfatal MAIS 3+ cases from the Crash Injury Research and Engineering Network database, following the methodology described by Hasija et al. (Citation2006; Martin and Eppinger Citation2003). The optimization methodology and the resulting injury MR values and function parameters are detailed in the Appendix (see online supplement).
Other attributable methods
Following a procedure similar to Martin's attributable fatality method, the proportion of disability and cost that can be attributed to different body parts was estimated. These attributable disability and attributable cost estimates represent the total disability and total cost that would be prevented if disability from injuries to a particular body region were completely eliminated.
Analysis subgroups
Precrash scenario
Cases were classified according to the Volpe-developed precrash scenario typology (Swanson et al. Citation2016). The typology defines precrash scenarios that are determined by vehicle movements and critical events occurring immediately prior to a crash. Crashes that did not fall into the defined scenario subgroups were not included in the analysis.
Impact type
Rollovers were identified as those with primary damage from overturn (TDD1 = “O”). Other occupant cases analyzed in NASS CDS were sorted by impact direction using Collision Damage Classification describing damage distribution (Society of Automotive Engineers Citation1980). This classification is based on the area of first contact as well as on principal direction of force and area of greatest deformation or contact (Table A-3, see online supplement). The categories used include frontal oblique crashes following previously defined methods (NHTSA Citation2015b) as well as frontal, side, and rear crashes.
Injury body region
Body region categories correspond to the AIS-coded body region with the exception of face and neck injuries (which were combined into one bin) and spinal injuries (which were separated by level). For cases from NASS CDS 2010 and later, hard-coded with AIS 2005, the categorization was based on the body region and specific structure digits in the translated 1990/1998 Update AIS code. For AIS 2005 codes without a recommended AIS 1990/Update 1998 translation code, the hard-coded body region and specific structure digits were used to bin the injury by body region.
Analysis
Analysis was performed on weighted data using survey analysis procedures in SAS 9.3 (SAS Institute Inc., Cary, NC). With the exception of fatality analyses, standard deviation is shown for weighted estimates of totals and standard error is shown for weighted estimates of rates or averages. No error estimation was made for estimates made based on the attributable methods or for fatality data, which had been reweighted using FARS. Rates and totals estimated based on data bins of fewer than 10 raw cases are not shown in the plots because the reliability of these estimates is questionable.
Where pairs of injury rate values were compared, confidence intervals for the magnitude of the difference between the compared injury rate values were estimated using methods proposed by Stucki and Biss (Citation2000). To identify statistically significant differences, 90% confidence intervals for the difference between pairs of injury rates were estimated as
where t is the t value for a 2-tailed test at α = .10. For complex survey data such as NASS CDS, the degrees of freedom for determining the t value are estimated by the number of primary sampling units minus the number of strata (Lohr Citation2010). NASS CDS cases are sampled in 12 strata with 27 primary sampling units in the included data years in the current study, resulting in 15 degrees of freedom. Confidence intervals that do not include zero indicate that the compared injury rates were identified as significantly different.
Results
After exclusion of 28,722 NASS CDS occupants with non-crash-related or undefined injuries, there were 69,597 2005–2015 NASS CDS occupants remaining in the data set, including 2,499 fatalities and 104 zero-weight cases. Of these cases, 46,123 were hard-coded with AIS 1990/Update 1998 codes and the remaining 23,474 were hard-coded with AIS 2005. These cases represented 29,721,931 weighted occupants, including 259,560 fatalities after reweighting to correspond to the total number of CDS-applicable fatalities in FARS during the same time period.
Crash, injury, and fatality frequency is shown in by the following precrash scenario groups: control loss, road departure, lane change, opposite directions, rear end, left turn across path, and crossing paths. Analyzing the frequency of crashes by precrash scenario for all occupants (using the left-side axis) can render quite different results than when analysis is limited to injured occupants (using the right-side axis). For example, occupants were involved in rear-end crashes more frequently than any other crash type at more than 600,000 occupants in CDS-eligible crashes annually, yet relatively few occupants sustained MAIS 3+ or fatal injuries in rear-end crashes compared to other scenarios such as control loss, road departure, or opposite direction crashes.
Figure 1. Average annual number of occupants in crashes by precrash scenario and injury severity.
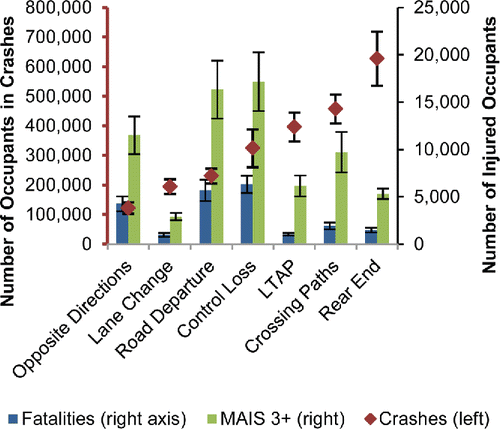
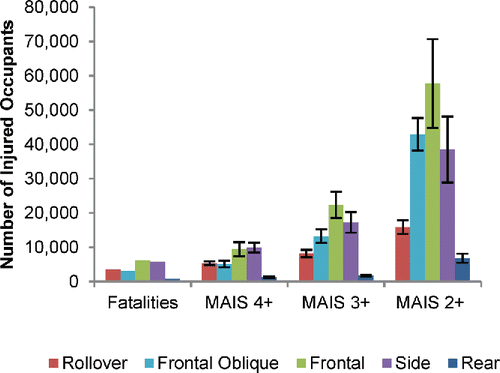
Injury frequency by impact type () provides different information than by precrash scenario. Even the “rear” impact type category, defined by the direction of the crash for the subject occupant's vehicle, includes a different set of crashes than the “rear-end” precrash scenario category, which includes both the striking vehicle and the struck vehicle. The rear impact type category, which covers occupants who could be affected by improvements in rear impact protection, includes 758 fatalities and 1,732 MAIS 3+ cases. The rear-end precrash scenario group, which applies to the occupants in all involved vehicles that would benefit from prevention of the crash, includes 1,495 fatalities and 5,329 MAIS 3+ cases. Similarly, the rollover impact type category includes some, but not all, of the cases in the control loss and road departure precrash categories.
Figure 2. Average annual number of injured occupants by impact type and injury severity.
Analysis by injury and fatality rate rather than by frequency provides yet another perspective on the results (). Though more occupants are injured at the MAIS 2+ or 3+ levels in frontal, frontal oblique, and side impact crashes than in rollover crashes (as shown in ), the rate of injury in rollover crashes is significantly higher than in any other impact type at all severity levels. For example, the difference between the point estimates of MAIS 4+ injury rate in rollovers and side impacts (5.2 and 1.9%, respectively) is 3.3% (confidence interval, 1.5–5.0%).
Figure 3. Rate of occupant injury by impact type and injury severity.
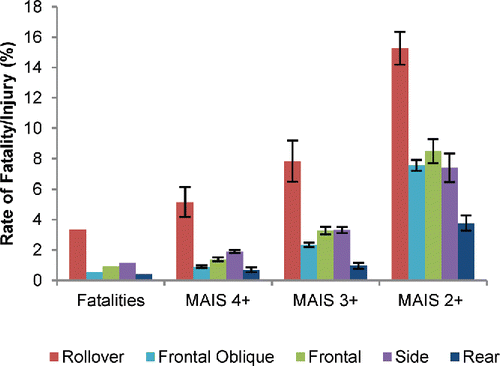
For nonrollover crashes, the relative rates of injury for different impact types vary by the MAIS injury severity level considered (). The rate of MAIS 2+ injury in side impact (7.4%), for example, is similar to that in frontal crashes (8.5%) or frontal oblique crashes (7.6%), but side impact occupants have a significantly higher rate of MAIS 4+ injuries than do frontal or frontal oblique occupants (1.9% versus 1.4% and 0.9%, respectively). Confidence intervals indicate that the rate of MAIS 4+ injury is 0.2 to 0.8% higher for side impact occupants than frontal occupants and 0.8 to 1.2% higher for side impact occupants than frontal oblique occupants.
Other measures of injury outcome, compared against the same categories of precrash scenario or impact type, can offer additional detail on the relative harm of different categories of crash type. Examples of the cost and disability associated with each impact type category are shown in Figures A-1 and A-2 (see online supplement).
Injury frequency and rate by impact direction can be further disaggregated by body region, which is particularly useful for identifying opportunities for improved occupant protection. shows the rate of AIS 3+ injury by body region for each of the impact type categories, from front to back: rear, rollover, side, frontal oblique, and frontal. Cervical and thoracic/lumbar spine injuries are labeled as C-spine and T/L-spine, respectively, and upper and lower extremity injuries are labeled as UE and LE, respectively. shows, as indicated by the arrow, that 1.1% of occupants in frontal impacts sustained at least one serious lower extremity injury. This plot illustrates the relative frequency of serious thoracic, head, and lower extremity injury across all impact types and highlights the elevated rate of injury to many body regions in rollover crashes. Regardless of impact direction, serious thoracic and head injuries are at least twice and up to 17 times as frequent as serious face/neck, abdomen, cervical spine, or thoracic/lumbar spine injuries. No results are shown for face/neck injuries in rear impacts because this bin contained fewer than 10 raw cases. Tabulated values for are shown in Tables A-4–A-7 (see online supplement).
Figure 4. Rate of AIS 3+ occupant injury by body region and impact type.
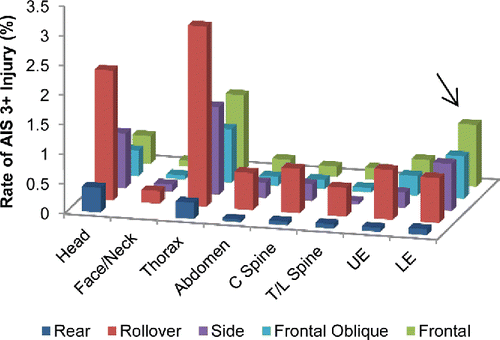
Figure 5. Percentage of estimated fatalities attributable to each body region by impact type.
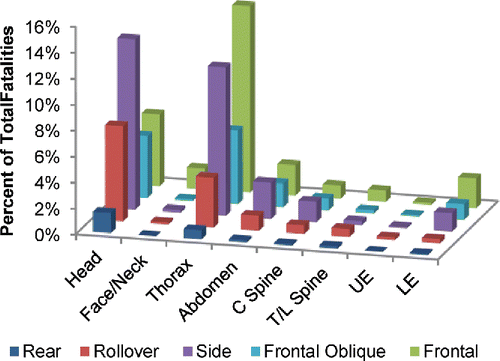
Figure 6. Percentage of disability attributable to each body region by impact type.
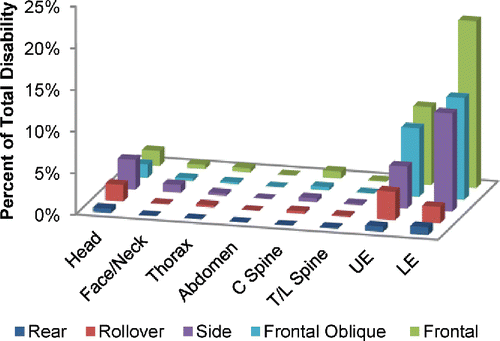
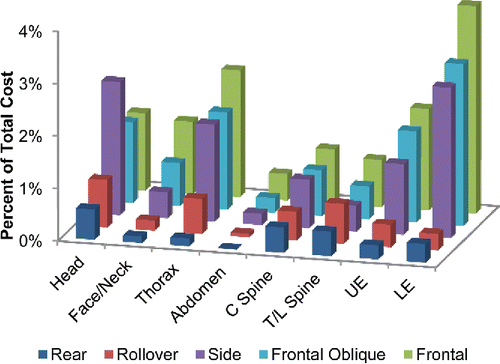
Figure 7. Percentage of total cost attributable to each body region by impact type.
The threat to life posed by injury to different body regions can be compared across impact types using estimated attributable fatality (). The 14.4% of attributable fatalities that are associated with thorax injuries in frontal crashes reflects that elimination of all thorax injuries in frontal crashes would result in an overall 14.4% decrease in fatalities. Though 68.3% of fatalities can be attributed to head or thorax injuries, injuries to the abdomen, lower extremity, and cervical spine also contribute to fatality in some impact directions, accounting for 18.0% of fatalities.
Analysis by attributable disability using the FCI scale presents a dramatically different picture than analysis by AIS severity or by attributable fatality (). Though head injury contributes up to 9.5% of the disability attributable to crashes across impact types, disability is primarily associated with lower and upper extremity injury, which account for 73.8% of the disability attributable to crashes across impact types. Lower extremity injury in frontal crashes alone is associated with 20.1% of the disability in crashes.
Attributable cost analysis shows more distributed results than does attributable fatality or disability analysis (). Though head, thorax, and extremity injuries each account for more than 15% of the attributable cost (accounting for a total of 73.0%), injuries to the face/neck, cervical spine, and thoracic/lumbar spine are associated with 7.3, 9.3, and 7.8%, respectively. Overall, rear impact injuries are associated with a higher proportion of attributable cost compared to other impacts than when other outcome measures are used; 5.9% of attributable cost is associated with rear impacts, whereas only 2.6 and 3.1% of attributable disability and attributable fatality, respectively, are associated with rear impacts.
Discussion
A comprehensive analysis of crash and crash injury data benefits from a multifaceted approach that accounts for both the frequency of crashes and injuries and the severity of crash outcomes. Analysis by varied crash characteristics and harm measures provides a rich picture of the state of motor vehicle crash safety, improving the potential to use crash data to identify opportunities and priorities in crash safety research. Though the current study used retrospective passenger–vehicle occupant crash data to illustrate the advantages of examining data by multiple measures of harm, analysis was limited to a very general comparison of crashes by type or by precrash scenario. It was intended to illustrate the methodology presented rather than to definitively identify research priorities. In fact, no single search or data set can be relied upon to identify all research priorities or opportunities: depending on the purpose of the search, the search may be tuned to focus on different crash, person, or injury characteristics. For example, these same multiharm methods can also be applied to studies that identify injury and crash reduction opportunities among nonoccupants, in crashes involving varied vehicle types, or in predictive studies of future crashes.
Injury severity is often characterized by each occupant's maximum severity injury on the MAIS scale. However, the selection of the severity levels to group together can change the relative importance of different injuries or crash types dramatically. As illustrated in , the rate of MAIS 4+ injury was significantly higher in side impacts than in frontal crashes (by 0.2 to 0.8%), although injury rate at less severe MAIS levels was similar for these two impact types. Similarly, the relative importance of rear impact is greater when MAIS 2+ injury rates are considered than when analysis is focused on higher severity injuries.
As modern crash protection continues to improve, potentially saving an increasing number of lives, it is likely that the importance of cost and disability will also increase. The AIS severity scale is intended to reflect the severity of injury as it relates to mortality but also to dimensions such as treatment cost and duration, disability, and quality of life. Though this scaling concept improves the usefulness of AIS as a single measure of harm, it is often helpful to isolate each of these facets. Other harm measures that can be derived from AIS codes offer more focused assessments of the harm specifically related to mortality (attributable fatality method), disability (FCI), and cost. These measures are particularly helpful in understanding the risk of negative outcome to particular body regions. Though the threat-to-life attributed to head and thorax injuries far outweighs any other body regions (), the extremities are associated with the majority of disability estimated by the FCI scale () and costs are more distributed among body regions (). These outcome measures are all relevant to an analysis of crash research priorities and opportunities. Previous studies have also identified varied distribution of harm among body regions for different harm measures. For example, head and thorax injuries have been identified as the most frequent causes of death among drivers (Ndiaye et al. Citation2009) or among belted light vehicle occupants (Mango and Garthe Citation1998), disability to the extremities and head have been reported to result in the most life years lost to injury in frontal and side crashes (McMurry et al. Citation2015), and substantial costs among all NASS CDS occupants have been attributed to abdominal and spinal injuries as well as to the head, thorax, and extremities (Eigen and Martin Citation2005). However, it is easier to compare the relative importance of these outcomes when these measures are applied to a single data set as in the current methodology.
In comparison to isolated measures of mortality, disability, and cost, the rate of AIS 3+ injury by body region and impact type () does appear to address multiple dimensions of risk, identifying head and thorax injuries as highest risk overall, followed by the extremities, and identifying nontrivial risk of injury to other body regions in most impact directions. These proportions reflect the elevated fatality risk associated with injury to the head and thorax, the elevated disability risk associated with the extremities, and the costs associated with the remaining body regions. Though an AIS 3+ injury analysis lacks the detail provided by a multiharm analysis, it appears to offer a combined measure of the risk of fatality, disability, and cost with an emphasis on fatality. Though this combined measure may offer a reasonably effective single harm metric, an analysis based on multiple measures of harm, including fatality, disability, and cost, as well as severity levels of AIS, gives a much richer picture of the potential risk presented by a particular injury or set of crash conditions.
A broad search for crash safety priorities includes consideration of both crash avoidance and injury protection opportunities. Data analysis by crash parameters such as impact direction and crash severity and injury variables such as body region and injury source is essential to understanding how to better protect occupants in crashes. In contrast, analysis by precrash conditions is necessary to identify how crashes might be prevented altogether. Combined analysis of crash variables and precrash variables on the same data set ( and ) allows the opportunity to understand the relative scope for improvement across these research areas.
Analysis by crash, vehicle, and occupant characteristics can isolate elevated crash and injury risk among cases by characteristics such as occupant age (Figure A-3, see online supplement), restraint use (Figure A-4, see online supplement), or seat position (Figure A-5, see online supplement). Data can also be compared by model year (Figure A-6, see online supplement) to explore the effects of temporal changes in vehicle design. However, disaggregation of case data by multiple variables can reduce the precision of estimates: the more detailed the analysis, the higher the uncertainty in the results. For example, in the current study, the use of a significance level (α) of .10 and the lack of an adjustment of α to account for multiple comparisons results in a relatively generous definition of statistical significance in comparisons of different injury rates. Therefore, results from multiple-variable crash data analyses, including in the current study, should be interpreted carefully. Reporting of standard error for estimates based on weighted data, identification or elimination of analysis bins containing few raw cases, and well-defined statistical difference estimates can all help in the interpretation of results. In the absence of quantitative analysis or sufficient statistical strength, data can be used to flag areas that may warrant additional research but should not be relied on as definitive.
The limitations of source data sets can also affect the reliability of results. Every injury data set has limitations, often resulting from the compromise between large sample size versus more detailed case information. These limitations need to be considered in interpretation of results. For example, in the current study, fatality cases were reweighted because fatalities are believed to be underrepresented in NASS CDS. However, it is also likely that injury information may be less detailed in fatality cases if patients died prior to complete diagnosis. Therefore, the results in this study may underestimate the frequency of the most severe injuries.
Though the current study shows the benefits of a multiharm analysis, each of the injury measurement methods used has limitations. They each reflect injury outcome for a given injury without specificity for age, sex, size, or physical condition. If the outcome results are broken down by these groups, these measurements may not be accurate. For example, per injury costs estimated using occupants of all ages may give inaccurate estimates when applied separately to younger and older occupants. The disability measurement, based on the FCI system, may have additional limitations in that it does not account for the disability associated with some AIS 1 severity injuries such as cervical strain or minor head injuries. Though these injuries are typically considered low severity, disability studies using the risk of permanent medical impairment method have shown that they contribute to a substantial portion of overall disability (Stigson et al. Citation2015). Application of a risk of permanent medical impairment–based disability measurement to NASS CDS data may provide a more realistic estimate of the distribution of disability, particularly in areas such as whiplash-associated disorders. The limitations of each individual injury measure underline the importance of assessing injury harm from multiple perspectives.
Future studies using the methods in this article may also need to incorporate translation to the AIS 2005 injury severity codes. Though the current analysis was based on AIS 1990/Update 1998 severity codes because the majority of cases were coded under this system, cases coded to AIS 2005 version will outnumber those coded to the earlier version in the future.
As innovations in crash testing and crash protection technologies offer potential to reduce crashes and crash injury, an improved understanding of the types of crashes and injuries that are most frequent and present the highest risk of poor outcome is essential to identifying the most important injury reduction opportunities. Combined consideration of the number of affected occupants, as well as isolated estimates of the risk of fatality, disability, and cost, can provide a more detailed picture of potential areas for crash and injury protection improvement than can single injury measures. Though an AIS 3+ injury analysis lacks the detail provided by a multiharm analysis, as a single measure it does appear to reflect the combined risk of fatality, disability, and cost with an emphasis on fatality.
Appendix.docx
Download MS Word (63.4 KB)Acknowledgments
The authors are grateful to Dr. Peter Martin (NHTSA) and Dr. HyunJung Kwon (TRC Inc.) for advice and assistance in the application of the attributable fatality method.
Funding
Funding from the National Highway Traffic Safety Administration is gratefully acknowledged.
References
- Association for the Advancement of Automotive Medicine. The Abbreviated Injury Scale, 1990 Revision Update 98. Des Plaines, IL: Author; 1998.
- Association for the Advancement of Automotive Medicine. Abbreviated Injury Scale 2005 Update 2008. Des Plaines, IL: Author; 2008.
- Baker SP, O'Neill B, Haddon W Jr, Long WB. The injury severity score: a method for describing patients with multiple injuries and evaluating emergency care. J Trauma Acute Care Surg. 1974;14(14):187–196.
- Blincoe L, Miller TR, Zaloshnja E, Lawrence BA. The Economic and Societal Impact of Motor Vehicle Crashes, 2010 (Revised). Washington, DC: NHTSA; 2015. DOT HS 812 013.
- Eigen AM, Martin PG. Identification of real world injury patterns in aid of dummy development. Paper presented at: 19th Technical Conference on the Enhanced Safety of Vehicles; 2005.
- Gennarelli TA, Wodzin E. AIS 2005: a contemporary injury scale. Injury. 2006;37:1083–1091.
- Hasija V, Martin PG, Ridella SA. Ranking injury codes using optimization methodology. Paper presented at: Thirty-fourth International Workshop on Injury Biomechanics Research; 2006.
- Lohr S. Sampling: Design and Analysis. Pacific Grove, CA: Brooks/Cole Cengage Learning; 2010.
- MacKenzie EJ, Damiano AM, Ditunno JF, Luchter S, Miller TR. Development of the Functional Capacity Index (FCI). Washington, DC: NHTSA; 1994.
- MacKenzie EJ, Damiano AM, Miller T, Luchter S. The development of the functional capacity index. J Trauma Acute Care Surg. 1996;41:799–807.
- Malliaris A, Hitchcock R, Hansen M. Harm Causation and Ranking in Car Crashes. Warrendale, PA: Society of Automotive Engineers; 1985. SAE Technical Paper 0148–7191.
- Malm S, Krafft M, Kullgren A, Ydenius A, Tingvall C. Risk of permanent medical impairment (RPMI) in road traffic accidents. Ann Adv Automot Med. 2008;52(52):93–100.
- Mango NK, Garthe E. Why People Die in Motor Vehicle Crashes: Linking Detailed Causes of Death with FARS Data. Warrendale, PA: Society of Automotive Engineers; 1998. SAE Technical Paper 0148-7191.
- Martin PG, Eppinger RH. Ranking of NASS injury codes by survivability. Annu Proc Assoc Adv Automot Med. 2003;47:285–300.
- McMurry TL, Sherwood C, Poplin GS, Segui-Gomez M, Crandall J. Implications of functional capacity loss and fatality for vehicle safety prioritization. Traffic Inj Prev. 2015;16(16):S140–S145.
- National Center for Statistics and Analysis. 2015 Motor Vehicle Crashes: Overview. Washington, DC: NHTSA; 2016. DOT HS 812 318.
- Ndiaye A, Chambost M, Chiron M. The fatal injuries of car drivers. Forensic Sci Int. 2009;184(184):21–27.
- NHTSA. National Automotive Sampling System–Crashworthiness Data System, 2014 Coding and Editing Manual. Washington, DC: Author; 2015a. DOT HS 812 195.
- NHTSA. New Car Assessment Program. Fed Regist. Washington, DC: Author; 2015b; 80 (241, December 16, 2015); Docket No. NHTSA-2015-0119, 2015b.
- NHTSA. THOR 50th Percentile Male Qualification Procedures Manual. 2016. Washington, DC: Author.
- Segui-Gomez M. Application of the Functional Capacity Index to NASS CDS Data. Washington, DC: NHTSA; 1996.
- Society of Automotive Engineers. J224 Collision Deformation Classification Standard. Warrendale, PA: Author; 1980.
- Stigson H, Gustafsson M, Sunnevång C, Krafft M, Kullgren A. Differences in long-term medical consequences depending on impact direction involving passenger cars. Traffic Inj Prev. 2015;16(16):S133–S139.
- Stucki SL, Biss DJ. A study of the NASS-CDS system for injury/fatality rates of occupants in various restraints and a discussion of alternative presentation methods. Annu Proc Assoc Adv Automot Med. 2000;44:93–116.
- Swanson ED, Foderaro F, Yanagisawa M, Najm W, Azeredo P. Statistics of Light-Vehicle Pre-crash Scenarios Based on 2011–2015 National Crash Data. Cambridge, MA: Volpe National Transportation Systems Center; 2016.
- Weaver AA, Barnard RT, Kilgo PD, Martin RS, Stitzel JD. Mortality-based quantification of injury severity for frequently occurring motor vehicle crash injuries. Ann Adv Automot Med. 2013;57(57):235–246.