
Abstract
Objective: Although bus travel is one of the safest modes of transport, a substantial number of bus passengers in London are still injured in collision and harsh maneuver incidents, in particular emergency braking. It is not well understood how these passengers are injured. The objective was to better understand the injury mechanisms and develop countermeasures with a test and assessment procedure to prevent or mitigate these injuries.
Methods: The UK national STATS19 data were used to determine the size of the problem. Data, including CCTV footage, in combination with inspection of current buses, were used to determine injury mechanisms and identify features and areas in buses associated with more injuries.
An assessment system based on visual inspection was developed to encourage a reduction in the number of features associated with injury.
Results: The STATS19 analysis showed that three quarters of all injured casualties occurred in incidents where there was no impact, with this proportion rising for seriously injured casualties. Overrepresentation of older females was also seen.
The CCTV analysis and bus examinations highlighted issues with poorly positioned handrails, lack of compartmentalization (restraint), and objects with sharp edges and corners. It also showed that a much higher proportion of passengers seated in the area close to the middle doors and wheelchair area were injured compared to other areas of the bus. Factors contributing to this result were that this area contained more features associated with injury and that persons with reduced mobility have greater exposure in this area; that is, more vulnerable passengers currently sit in the less safe areas of the bus.
Conclusions: A novel analysis of CCTV footage has enabled a better understanding of injury mechanisms for bus passengers to be developed. In combination with inspection of current buses, this has been used to develop an assessment system to improve the safety of buses in London.
Introduction
This article reports on work performed as part of a project for Transport for London (TfL) to improve the safety of Class I buses and help meet vision zero targets set by the mayor of London: That no one will be killed in an incident involving a London bus by 2030 and that no one will be killed or seriously injured in a road traffic collision in London by 2041. Thirteen safety countermeasures have been investigated, ranging from automated emergency braking, to visual and acoustic conspicuity, to occupant-friendly interiors. This article describes the latter measure.
The objective of the work performed was to better understand bus passenger injury mechanisms and develop countermeasures with an associated assessment procedure to improve the occupant-friendliness of bus interiors. This added passenger protection should help to prevent or mitigate injuries.
Little literature has been published related to bus passenger injury mechanisms, although some information is available about injury epidemiology. In 2015, a systematic review on the epidemiology of noncollision injuries occurring in older people during their use of public buses was performed (Kendrick et al. Citation2015). Kendrick et al. (Citation2015) reported that studies of emergency departments found bruising to be the most common injury, but between 18 and 33% suffered fractures and/or dislocations, with limbs being most commonly injured. In 2016, an analysis of a linked GB national (STATS19) and hospital episode statistics data set for the period 1999 to 2009 focused on older (aged 60+) bus/coach passengers was performed (Barnes et al. Citation2016). As for previous studies, it found that the majority of injuries occurred in non-collision type incidents (Kirk et al. Citation2003). It also found that the main body regions injured were the head/neck (29.5%), upper extremities (22%), and lower extremities (30.5%), and standing was associated with sustaining more injuries, closely followed by being seated. This is in general agreement with previous studies, some of which have identified standing passengers as having higher incidences of injuries (Albrektsen and Thomsen Citation1983; Halpern et al. Citation2005; Nue Moller et al. Citation1982) and some of which identified high incidence rates for seated passengers (Kirk et al. Citation2003).
There are a number of regulations that control the design of Class I bus interiors. The main ones for the UK are United Nations Economic Commission for Europe (UNECE) Regulation No. 107 (UNECE Citation2015) and the UK Public Service Vehicle Accessibility Regulations. These regulations contain requirements related to interior arrangements of the bus, such as the position of handrails, dimensions of gangways, guards for stairs, the dimensions of seats, and, in particular, provisions for wheelchair users and persons with reduced mobility.
Methods and data sources
The methodology consisted of 3 main steps:
Problem size: Analysis of UK national data to determine the number and nature of casualties in the London region.
Injury mechanisms and potential hazards: Analysis of CCTV footage and examination of current buses to understand passenger injury mechanisms better and identify potential hazards and design changes to help mitigate injury.
Assessment procedure: Development of a procedure to assess a bus’s interior safety based on a visual inspection.
Problem size
To determine the size of the problem, analysis of UK national STATS19 accident data for the 10-year period 2006–2015 was performed for bus and coach occupant casualties in the Greater London region. STATS19 contains all road accidents involving human death or personal injury reported to the police. For buses and coaches this includes noncollision accidents in which passengers already aboard a bus/coach are injured and those involving boarding and alighting. Data such as collision circumstances, vehicle details, and casualty injury severity, usually collected by the attending police officer, are recorded (STATS20 Citation2011).
Injury mechanisms and identification of potential hazards
CCTV analysis
To understand injury mechanisms better, bus operator–collected incident data, which included CCTV footage, were analyzed. One hundred ninety-two incidents were selected from data collected between January 2016 and October 2017 by a major bus operator. The incidents were selected in a representative manner based on STATS19 in terms of the proportions of noncollision and collision incidents and, for collision incidents, proportions of object hit (vehicle or vulnerable road user; i.e., pedestrian or cyclist). From observation of the CCTV footage, for passengers who moved substantially, the following parameters were estimated and coded in a database for further analysis:
Passenger action: Seated/standing/boarding/alighting
Location on bus
Bus part contacted by passenger and body part contacted
Injury severity estimate: Contact/slight/moderate. The categories were defined as follows:
^ Noninjured (contact):
• Passengers who showed no visible adverse effect and did not receive medical attention
^ Slightly injured:
• Passengers who showed visible signs of pain and did not receive medical attention; for example, clutching shoulder, rubbing chest
• Passengers who fell to the floor and did not receive medical attention
^ Moderately injured:
• Passengers with symptoms similar to slightly injured but who received professional medical attention at the scene and/or were taken to hospital
• Operator notes record serious injury.
It should be noted that there were no fatalities in the CCTV analysis data set and the slightly and moderately injured categories were defined to align as much as possible with the STATS19 slightly injured and seriously injured categories, respectively. However, it was recognized that, with the definitions used, some casualties in the CCTV moderately injured category may not be included in the STATS19 seriously injured category.
In addition, accelerometer data were available for 70 of the incidents, for which peak decelerations and exposure data—that is, the total number of passengers in each area of the bus—was coded.
Coding of an incident into the database took from 2 to 3 h to a day depending on the following:
Parameters recorded, additional effort required to record exposure data
Capacity and loading of the bus; that is, single- or double-decker and number of passengers on bus
Camera quality and positions/angles relative to passengers of interest on the bus.
For future work, improvements to the database to enhance future analyses are discussed later in the article; for example, recommendations for additional parameters that could be recorded.
Bus examinations
To identify potential injurious features, the interiors of 5 common current bus models were examined visually. Based on the results of the CCTV analysis and the information gathered from bus inspections, potential injurious features (hazards) that an assessment procedure should consider were identified and categorized. In addition, proposals for potential future design solutions were outlined.
Assessment procedure
The aim of the procedure was to assess buses with fewer of the potential hazards identified above as better and encourage improvements that are applicable to different bus designs, while allowing manufacturers design freedom. The assessment procedure was developed using expert judgment in an iterative manner to meet the stated aim, by application to current buses as well as buses with hypothetically modified interiors that reflected the design solutions proposed with fewer potential hazards.
Results
Problem size
Analysis of the STATS19 data set showed that on average about 1,360 bus and coach passengers are injured annually in London (, see online supplement). About three quarters of these occurred in noncollision incidents and the remainder in collisions, about half of which were frontal (). Analysis of the vehicle maneuver field showed that about two thirds of casualties occurred in “going ahead/overtaking” and “slowing or stopping” incidents (, see online supplement). Because these maneuvers are usually associated with braking or a frontal collision, this indicates that two thirds of casualties were likely injured as a result of being thrown to the front of the bus. However, the 20% injured in “moving off” maneuvers, the majority of whom were standing, would likely have fallen toward the rear of the bus. Further analysis of the vehicle maneuver field shows that about 30% of casualties who were boarding or alighting occurred when the bus was moving. This indicates that they were probably transitioning from or to their seats. Analysis of age and gender shows that a high proportion of the seriously injured (about one third) are older women aged 56 years and over (, see online supplement). This large proportion of older women has been observed previously, with likely explanations such as greater exposure of this group and their physiology; that is, more likely to fall over and a lower injury tolerance (Kirk et al. Citation2003). Generally, similar trends have been observed for Great Britain as a whole (Kirk et al. Citation2003) and Europe (ECBOS Citation2003).
Figure 1. Distribution of bus/coach passenger casualties in London 2006–2015 by collision type and first point of impact. Number of casualties 13,611. Data from STATS19.
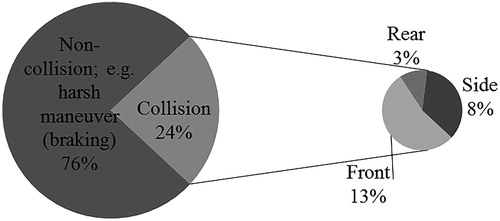
Figure 2. Proportion of standing bus passengers injured by bus area (overall 6%). Data from CCTV analysis (of 70 incidents with exposure data).
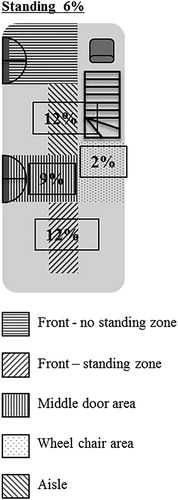
Table 1. Anthropometric relevance of boundary values chosen for the assessment of height of horizontal handrails above the floor.
Injury mechanisms and identification of potential hazards
CCTV analysis
In the 192 incidents examined, 227 passengers were observed to have significant interactions with part of the bus interior or another passenger. For these passengers, 17 were judged to have suffered moderate injury, 70 a slight injury, 112 no injury, and 28 unknown; that is, those for whom it was not possible to estimate injury severity.
The following observations related to injury mechanisms were made for standing and seated passengers:
Standing passengers:
^ The parts of the bus that standing passengers who were injured hit most frequently were the floor (20%), vertical handrails (19%), and partition panels (19%). The head and the chest were the body parts impacted most frequently, with the head receiving most (88%) of the moderate injuries. A number of moderately injured passengers standing in the wheelchair area impacted horizontal handrails positioned at head height.
^ As many as 45% of the passengers who fell or who moved substantially were holding on. For these passengers, some impacted the handrail that they were holding onto.
^ Many standing passengers who fell were transitioning in or out of their seat. These passengers often impacted the vertical handrail between the seat back and ceiling. A large proportion of these passengers were elderly females, possibly because they take longer to transition and are less stable.
Seated passengers:
^ The parts of the bus that seated passengers impacted most frequently were vertical handrails (27%) and the seat in front (27%). For injured seated passengers the parts of the bus hit most frequently were vertical handrails (31%) and horizontal handrails (20%), many of which the coders noted were positioned on the top of the seats in front.
^ The largest proportion of impacts on the lower deck occurred in the middle area (46%), near and around the middle doors and priority seats, with the main object impacted being a vertical handrail, many of which, the coders noted, were positioned directly in front of the seat.
^ No restraint of passengers sitting in the middle seat on the rear row of seats. During harsh braking or collision events, these passengers were usually thrown from their seats and down the aisle in front of them.
^ Little restraint of passengers sitting in forward-facing bay seats, in particular for aisle-seated passengers. These passengers often fell into the aisle unless they managed to grab the vertical handrail positioned at the top of the opposite seat.
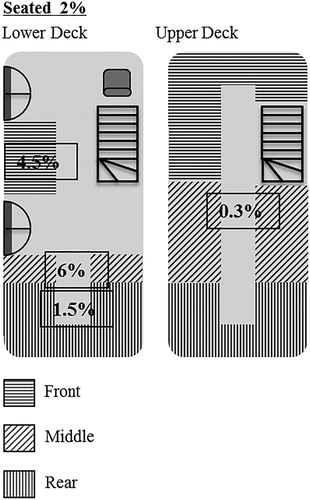
Using the smaller CCTV data set containing the exposure data, the proportion of standing and seated passengers injured was calculated by bus area/passenger location. The results show that a smaller proportion of seated passengers were injured (2%) compared to standing passengers (6%), indicating a smaller risk of injury for seated passengers ( and ). For seated passengers, the results show that a smaller proportion of those seated on the upper deck were injured (0.3%) compared to those seated on the lower deck (1.5–6%), indicating a much smaller risk of injury for passengers seated on the upper deck. It is likely that there are 2 main factors contributing to this. Firstly, generally, there are fewer features with injury-causing potential on the upper deck (see Bus Examination subsection below). Secondly, persons with reduced mobility (PRM), who are generally less injury tolerant, will usually sit on the lower deck because they find it difficult to climb the stairs to the upper deck.
Figure 3. Proportion of seated bus passengers injured by bus area (overall 2%). Data from CCTV analysis (of 70 incidents with exposure data).
Examination of the accelerometer data showed that peak longitudinal decelerations ranged from 0.14 to 0.89 g for noncollision (mainly emergency braking) and vulnerable road user (pedestrian and cyclist) collisions. For collisions with other vehicles, decelerations ranged from 0.59 to 1.65 g.
Bus examinations
For both standing and seated passengers, the bus examinations revealed potential hazards under the following categories:
Handrails mainly in relation to their position. Examples include, for standing passengers, vertical and horizontal handrails in the head impact zone in the wheelchair area (, see online supplement) and, for seated passengers, handrails behind middle doors in alignment with the likely trajectory of an aisle-seated passenger (, see online supplement).
Figure 4. Structure of assessment procedure.
It should be noted that, generally, handrails in roughly these positions are required by regulation. The main regulatory requirement, Regulation 107 (UNECE Citation2015), is for the fitment of an adequate number of handrails such that a standing passenger can reach at least 2, at least 1 of which is not more than 1.5 m above floor level. The exceptions are as follows:
^ The vertical handrail in the wheelchair area for wheelchair lateral support. Regulation permits the fitment of this or a retractable handrail.
^ Some seat back–to-ceiling handrails. TfL has a requirement for London buses for these to be fitted for every seat on the lower deck because of the large number of standing passengers that London buses often carry. This can be more than required by regulation depending on seat spacing.
Restraint; that is, inadequate restraint of a passenger’s movement in the event of a braking or collision event in terms of compartmentalization. Examples include passengers on seats: behind the wheelchair area–no partition to restrain movement; above the rear wheels–seat backs in front not high enough to restrain movement; rear middle seat–nothing to restrain movement; and aisle forward-facing bay seat–passenger falls into aisle (, see online supplement).
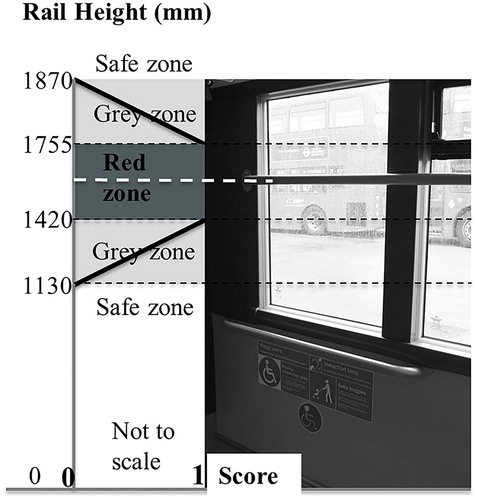
Figure 5. Illustration of sliding scale concept. Top rail in picture is about 1,500 mm above the bus floor and in the red zone (score = 1), whereas the bottom rail is about 1,000 mm above the bus floor and in the safe zone (score = 0). Grey zones, in which the score is scaled linearly from 1 to 0 depending on the height of the rail above the bus floor, are positioned between the red and safe zones.
General injurious features—that is, protrusions, sharp corners, and edges. Examples include protrusions such as bolt heads and sharp corners and edges on items such as steps and passenger information displays (Figure A6, see online supplement).
It should be emphasized that not all of the issues identified above were observed on all of the buses examined. Indeed, many of the buses exhibited good features, although all buses exhibited at least one issue.
It was also observed that seats behind the wheelchair area and middle doors often have features associated with high injury potential, in particular inadequate restraint and handrails in alignment with passenger trajectories. This correlates with the position where a higher risk of injury was observed for seated passengers in the CCTV analysis (6%).
Based on the results described above, proposals for potential design changes to improve safety were outlined:
Solution level 1:
^ Fit partitions in front of exposed seats behind wheelchair and middle door standing areas to provide better restraint for passengers in those seats.
^ Ensure that the partition fitted extends inboard far enough so that handrails associated with it are positioned far enough inwards so that they are not in alignment with a passenger sitting in the aisle seat to reduce likelihood of impact with it in an incident.
Solution level 2:
^ Solution level 1 plus:
• Reposition handrails that are not in the middle bus area, both vertical and horizontal.
• Remove general hazards for standing and seated passengers.
• Improve restraint for standing and seated passengers possibly with the use of high-backed seats; for example:
• Improve the restraint of passengers standing in the middle door area by effectively increasing the height of the partition to the front of this area by the placement of high-backed seats in front of this partition.
• Improve the restraint of passengers seated in the seats positioned above the rear wheels by placing high-backed seats in front of them.
• Provide additional protection for rear-facing seats that have a potential hazard behind; for example, where there is a luggage rack or other hard structure behind an occupant’s head.
Assessment procedure
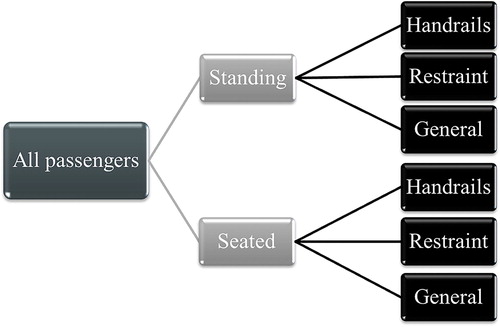
A procedure was developed that identifies potential hazards present in 3 categories (handrails, restraint, and general injurious features) at each standing and seated passenger location on the bus (). The procedure awards a base score of 1 for each potential hazard identified, with weighting applied to increase the score for hazards with greater injury-causing potential and/or exposure. A lower score indicates fewer potential hazards and a safer bus interior. The assessment steps are as follows:
Identify potential hazards in each category at each standing and seated passenger location on the bus. Score 1 point per hazard.
Weight the score for each individual potential hazard identified in each of the 6 categories according to passenger exposure. This step is also used to avoid discontinuities in the assessment system. An example is shown for horizontal handrails for standing passengers (). A base score of 1 is given for each 500-mm length of horizontal handrail (space for one standing passenger). This is weighted between 0 and 1, based on the height of the rail above the floor and anthropometric data (). This weighting was based on the assumption that if a handrail is in the head impact zone (i.e., at head height), it is more likely to be a potential hazard. Hence, the assessment was developed to encourage horizontal handrails to be either below or above this zone. Note that, although the approach is similar, the weighting and underlying assumptions are different for each of the 6 categories of hazards.
Further weight the score for each potential hazard identified in each of the 6 categories and add them to give overall score for the lower deck and upper deck (if appropriate). Further weightings are applied to reflect the following:
The injury potential of the hazard; for example, if the hazard is likely to cause a head injury as opposed to a lower limb injury, a higher weighting is given.
Exposure of the hazard; for example, if the hazard is in an area of the bus with a higher occupancy rate, a higher weighting is given. In addition, additional weighting is applied to hazards to which PRM are likely to be exposed. This is because, generally, PRM have slower reaction times and are less tolerant to injury, which can increase the likelihood of impacting a hazard and being injured.
Further details of the assessment can be found in TfL (Citation2018).
The fully developed assessment procedure was applied to 5 current London buses, including the most common single- and double-deck models in the London fleet and an outlier single-deck model designed to carry a larger number of standing passengers. This resulted in scores ranging from 57 to 88 for the lower deck and 7 to 49 for the upper deck (, see online supplement). Application to 2 current buses hypothetically modified to represent changes to solution levels 1 and 2 showed much lower scores, illustrating that the assessment procedure could easily distinguish the safer modified buses (Table A3, see online supplement). Banding the scores from these assessments suggests that target scores for the lower deck of around 60–90 and 20–30 could be used to encourage solution level 1 and 2 safety improvements, respectively (). To apply the assessment to single- and double-deck buses in a straightforward manner, it is proposed that the assessment be based on the lower deck score, with the proviso for double-deck buses that a minimum score for the upper deck has to be achieved as well. It is intended that the current draft of the procedure will be reviewed further and updates made if necessary.
Table 2. Score bands for application of assessment procedure to 5 current buses and 2 buses hypothetically modified to solution levels 1 and 2.
Discussion
Handrails cause a dilemma: They are needed to help passengers remain standing, but if passengers fall they can be a hazard. There are 2 possible ways to solve this dilemma: The first is to make handrails more impact friendly and the second is to reduce the risk of them being impacted. Research has been performed in the rail industry to investigate occupant protection within rail vehicles. This research has suggested that it may be possible to make handrails more impact friendly through the use of compliant mounts (Payne and Patel Citation2001). Within the project, this idea was investigated using a modeling approach to compare injury criteria values for head impacts against handrails with and without compliant mounts. Unfortunately, the results did not show a consistent reduction in injury criteria values for the handrail with the compliant mount. Therefore, an approach to reduce the risk of handrails being impacted was pursued.
The intended aim of the assessment procedure is to encourage the repositioning of handrails, so that passengers are less likely to impact them if they fall. In theory, removing the handrails could have a similar effect on the score as repositioning them, so this may be an option that manufacturers could be encouraged to take. However, regulatory requirements effectively mandate a minimum number of handrails, so this should help ensure that the intended aim is met.
Currently, low-backed seats are fitted on London buses. There are 2 possible reasons to fit higher-backed seats. The first is to provide additional protection for passengers seated in rear-facing seats, in particular for neck and whiplash-type injuries. The second is to provide better restraint for passengers seated behind the seat, in particular for passengers on seats positioned higher than the one in front; for example, seats above the rear wheels. Work to investigate the fitment of higher-backed seats found the following:
Forward-facing: Generally, higher-backed seats provide better restraint for passengers (the higher the better), although for a seat with a higher back a passenger is more likely to hit his or her head on the back of the seat in front. This should not affect injury levels, provided that the zone that the head may impact is made suitably benign with appropriate padding.
Rear-facing: To provide protection against whiplash-type injury in frontal collisions, the seat back needs to be high enough to support the head. Currently, only coach-style seats have a back high enough to achieve this, and this is challenging to implement in buses due to passenger capacity and bus mass constraints.
The design solutions proposed could have possible drawbacks:
The fitment of partitions (guards) for exposed seats behind the wheelchair area could require that the wheelchair area be made longer to allow sufficient space for a wheelchair user to access it. A longer wheelchair area may reduce the number of seats that can be fitted on the lower deck, which could encourage more passengers to stand, which is undesirable because the CCTV analysis showed a higher risk of injury for standing passengers compared to seated ones. However, it should be noted that, for Class I buses approved via Economic Commission Whole Vehicle Type Approval, as a result of the 06 series of amendments to UNECE Regulation 107 agreed in October 2015, there will be a requirement that guards are fitted for exposed seats, such as those behind the wheelchair area, beginning in 2020 (UNECE Citation2015).
For seats in the area behind the middle doors, repositioning of handrails further inboard could likely impede access to those seats and passenger flow to seats behind because it would narrow the gangway.
The fitment of seats with higher backs could lead to an increase in the mass of the bus. This is undesirable because bus mass is related to fuel economy and emissions. However, higher-backed seats could offer increased safety and greater comfort for passengers.
It may be possible to circumvent some of these possible drawbacks. The approach proposed using an assessment procedure to drive safer designs should allow manufacturers the design freedom to find an optimum design solution with the required safety levels, while considering these possible drawbacks.
The STATS19 analysis indicated that a proportion of passengers were injured transitioning to and from their seats, while the bus was moving. Measures to help address this cohort could include driver training to not move off until all passengers are seated and announcements to ask passengers to remain seated until the bus stops. However, these types of measures would likely increase dwell times at bus stops, which could cause disruption to schedules.
Limitations
The main limitations of this study related to the CCTV analysis. The first was determining injury severity and which body parts were injured. To some extent, the assumption was made that the body part that made the first significant contact was the one that was injured. This could be improved if the bus operator incident data could be linked to other data sets such as hospital episode statistics (HES). Following is a comparison of the percentage of body regions injured reported by Barnes et al. (Citation2016)with the body part that makes first significant contact from the CCTV analysis:
Barnes et al.: Head 30%, chest 9%, upper extremities 22%, lower extremities 30%.
CCTV analysis: Head 30%, chest 27%, upper extremities (arms) 12%, lower extremities 8%.
It might be expected that these should correlate somewhat, but it is seen that the correlation is poor, in particular for the chest, upper extremities (arms), and lower extremities. A possible reason for the difference in the proportions of upper extremities is that the CCTV analysis usually coded shoulder contact in the clavicle area as the chest because the precise location of contact could not easily be seen and Abbreviated Injury Scale coding (which was used for the HES data in Barnes et al.’s paper) associated clavicle bone injuries to the upper extremities. This hypothesis is supported by the difference in the proportion of chest injuries (9%) in Barnes et al. (Citation2016) compared to the CCTV analysis (27%). Indeed, if most of the difference in chest injuries (18%) is assumed to be related to shoulder injuries and added to the arm/upper extremity injuries, the comparison becomes much better. Possible reasons for the differences in the proportions of lower extremity injury are, firstly, that Barnes et al. (Citation2016) considered older passengers (60+) only, who are more likely to receive lower extremity injuries from falling than the population as a whole, and, secondly, that the first significant contact may not be the cause of the principal injury. For further work, linking the CCTV, STATS19, and HES databases should be considered to help provide better information about casualty injuries and allow a better understanding of injury mechanisms.
Another limitation was that for coding of passenger actions, the categories of seated/standing/boarding/alighting as in STATS19 were used. Upon reflection, for further work it would be useful to record additional categories such as transitioning for the period when a passenger is sitting down or standing up or moving to a seat and have markers for seated passengers who are out of position. In addition, for further work, a larger data sample should be collected to improve the statistical relevance of analysis results.
Supplemental Material
Download MS Word (4.2 MB)Acknowledgments
The authors gratefully acknowledge the contributions of stakeholders, especially bus operators and manufacturers, who helped make the research possible.
Additional information
Funding
Related Research Data
References
- Albrektsen S, Thomsen J. A casualty ward analysis of bus passenger accidents. Med Sci Law. 1983;23(2):102–105.
- Barnes J, Morris A, Welsh R, et al. Injuries to older users of buses in the UK. J Public Transp. 2016;8:25–38.
- ECBOS. Enhanced Coach and Bus Occupant Safety. Brussels: European Commission; 2003. Available at: https://trimis.ec.europa.eu/sites/default/files/project/documents/20060727_144009_64237_ECBOS_Final_Report.pdf. Accessed November 5, 2018.
- Halpern P, Siebzehner M, Aladgem D, Sorkine P, Bechar R. Non-collision injuries in public buses: a national survey of a neglected problem. Emerg Med J. 2005;22:108–110.
- Kendrick D, Drummond A, Logan P, Barnes J, Worthington E. Systematic review of the epidemiology of non-collision injuries occurring to older people during use of public buses in high income countries. J Transp Health. 2015;6:394–405.
- Kirk A, Grant R, Bird R. Passenger casualties in non-collision incidents on buses and coaches in Great Britain. Paper presented at: 18th Enhanced Safety of Vehicles Conference, May 19–22, Nagoya, Japan. NHTSA; 2003. Available at: https://www-esv.nhtsa.dot.gov/Proceedings/18/18ESV-000296.pdf. Accessed March 11, 2019.
- Nue Moller B, Grymer F, Christensen ST. Bus accidents. J Traffic Med. 1982;10(4):59–62.
- Payne A, Patel S. Occupant Protection and Egress in Rail Systems (OPERAS). 2001. Available at: http://www.eurailsafe.net/subsites/operas/HTML/Section1/Section1.1frame.htm. Accessed November 5, 2018.
- STATS 20. UK Department for Transport: Instructions for the Completion of Road Accident Reports from Non-Crash Sources. 2011. Available at: https://assets.publishing.service.gov.uk/government/uploads/system/uploads/attachment_data/file/230596/stats20-2011.pdf. Accessed November 5, 2018.
- Transport for London (TfL). Bus Interior Safety Assessment Protocol. 2018. Available at: https://tfl.gov.uk/corporate/publications-and-reports/bus-safety-data#on-this-page-0. Accessed December 5, 2018.
- United Nations Economic Commission for Europe. Proposal for Amendments to the 06 Series of Amendments to Regulation No. 107 (M2 and M3 Vehicles). 2015. Available at: https://www.unece.org/fileadmin/DAM/trans/doc/2015/wp29grsg/ECE-TRANS-WP29-GRSG-2015-34e.pdf. Accessed November 5, 2018.