
Abstract
Objective: The focus of this study is side impact. Though occupant injury assessment and protection in nearside impacts has received considerable attention and safety standards have been promulgated, field studies show that a majority of far-side occupant injuries are focused on the head and thorax. The 50th percentile male Test Device for Human Occupant Restraint (THOR) has been used in oblique and lateral far-side impact sled tests, and regional body accelerations and forces and moments recorded by load cells have been previously reported. The aim of this study is to evaluate the chestband-based deflection responses from these tests.
Methods: The 3-point belt–restrained 50th percentile male THOR dummy was seated upright in a buck consisting of a rigid flat seat, simulated center console, dashboard, far-side side door structure, and armrest. It was designed to conduct pure lateral and oblique impacts. The center console, dashboard, simulated door structure, and armrest were covered with energy-absorbing materials. A center-mounted airbag was mounted to the right side of the seat. Two 59-gage chestbands were routed on the circumference of the thorax, with the upper and lower chestbands at the level of the third and sixth ribs, respectively, following the rib geometry. Oblique and pure lateral far-side impact tests with and without airbags were conducted at 8.3 m/s. Maximum chest deflections were computed by processing temporal contours using custom software and 3 methods: Procedures paralleling human cadaver studies, using the actual anchor point location and actual alignment of the InfraRed Telescoping Rods for the Assessment of Chest Compression (IR-TRACC) in the dummy on each aspect—that is, right or left,—and using the same anchor location of the internal sensor but determining the location of the peak chest deflection on the contour confined to the aspect of the sensor; these were termed the SD, ID, and TD metrics, respectively.
Results: All deformation contours at the upper and lower thorax levels and associated peak deflections are given for all tests. Briefly, the ID metrics were the lowest in magnitude for both pure lateral and oblique modes, regardless of the presence or absence of an airbag. This was followed by the TD metric, and the SD metric produced the greatest deflections.
Conclusion: The chestbands provide a unique opportunity to compute peak deflections that parallel current IR-TRACC-type deflections and allow computation of peak deflections independent of the initial point of attachment to the rib. The differing locations of the peak deflection vectors along the rib contours for different test conditions suggest that a priori attachment is less effective. Further, varying magnitudes of the differences between ID and TD metrics underscore the difficulty in extrapolating ID outputs under different conditions: Pure lateral versus oblique, airbag presence, and thoracic levels. Deflection measurements should, therefore, not be limited to an instrument that can only track from a fixed point. For improved predictions, these results suggest the need to investigate alternative techniques, such as optical methods to improve chest deflection measurements for far-side occupant injury assessment and mitigation.
Introduction
The existing U.S. FMVSS for side impacts and consumer information programs only protect the nearside occupant (FMVSS-214 Citation2008). U.S. FMVSS No. 214 includes 2 dynamic tests to assess occupant protection in side impact crashes: a simulated 90° side impact crash using a 27° crabbed moving deformable barrier at 53.9 km/h and a simulated 75° oblique pole impact crash test at 32 km/h. These tests are also included in the New Car Assessment Program, although the moving deformable barrier test is conducted at 62 km/h (NHTSA Citation2012). However, these tests only assess the performance of nearside occupants; that is, occupants seated directly adjacent to the impacted side of the vehicle.
The real-world studies in the United States using the NASS and Crash Injury Research Engineering Network (CIREN) databases have shown that injuries also occur in the far-side mode; that is, to occupants sitting on the opposite side of the vehicle from the impact location. For example, field data analysis in the 1990s showed that far-side occupant exposure occurs in approximately one third of all crashes regardless of the type of database (descriptive or epidemiological; Augenstein et al. Citation2000). Another study using the NASS database for the years 1993 to 2002 found that far-side impacts accounted for 43% of seriously injured occupants (using the Abbreviated Injury Scale [AIS]; Gabler, Digges, et al. Citation2005).
An analysis of 875 cases from the NASS, CIREN, and Australian National Crash In-depth Study databases showed that far-side crashes contribute 20% to the total crashes, and severe injuries were observed in 60° and 90° crashes (Bahouth et al. Citation2015; Digges et al. Citation2009; Frampton et al. Citation1998; Gabler, Digges, et al. Citation2005; Yoganandan, Fitzharris, et al. Citation2011). The 45° orientation of the sled buck system closely reproduced occupant kinematics for most angled far-side impact scenarios (Arun et al. Citation2017). Based on field studies, 50% of Maximum Abbreviated Injury Scale (MAIS) 3+ injuries in far-side crashes occur at delta-Vs between 7.8 and 11.7 m/s (Gabler, Digges, et al. Citation2005; Gabler, Fitzharris, et al. Citation2005; Yoganandan et al. Citation2014).
The thorax and head are the 2 most commonly injured body regions in this mode. For example, in an analysis of the NASS database for the years 2009–2012, far-side occupant injuries were analyzed for impact vectors corresponding to 260° to 310°s representing the right front passenger and 50° to 100°s for the driver seating position, representative of U.S. driving conditions (Yoganandan et al. Citation2014). The authors reported that, of occupants sustaining injuries scored at the MAIS 2+ level, approximately one half had head injuries and approximately one fifth had thorax injuries. Of occupants sustaining injuries scored at the MAIS 3+ level, approximately one half sustained head and approximately two thirds sustained thorax injuries. Another NASS analysis using the database for the years 1995–2006 also reported that head and thorax injuries dominated the injury spectrum (Bostrom et al. Citation2008). Similar outcomes regarding thorax injuries were reported from international databases (Fildes et al. Citation1994; Thomas and Frampton Citation1999). Other analyses in the late 1990s also showed that the head and chest are the 2 most frequently injured body regions to restrained front outboard far-side occupants. Researchers have emphasized that protecting the thorax/chest should be an important priority for far-side occupant safety (Digges and Dalmotas Citation2001; Gabler, DIgges, et al. Citation2005).
Sled tests using postmortem human surrogates (PMHS) have confirmed the high frequency of thorax injuries. Seven far-side PMHS subjects tested using sled equipment produced rib fractures in all specimens with AIS scores ranging from 2 to 5 (Forman et al. Citation2013). An earlier study conducted by the current authors also showed thorax injuries in all 6 PMHS specimens in far-side sled tests (Pintar et al. Citation2007). Thus, epidemiological and descriptive database analyses from U.S. and international databases and laboratory tests with intact PMHS have revealed that the human thorax is commonly injured in the far-side mode, and any assessment and mitigation efforts should include this body region. This is a focus of the present investigation.
The assessment of injuries to the thorax in physical models is accomplished by a determination of the injury metrics focused on this body region in the dummy. For side impacts in general, studies have used the peak acceleration in the dummy (e.g., spinal and rib accelerations), maximum velocity and chest compression as an integrated metric, and peak chest compression as likely candidates for occupant injury assessment and protection (Kuppa et al. Citation2003; Maltese et al. Citation2002; Pintar et al. Citation1997; Yoganandan et al. Citation2007). This is also true for far-side impacts (Forman et al. Citation2013; Pintar et al. Citation2007). In the cited research and elsewhere, physical models have included the WorldSID dummy and the Test Device for Human Occupant Restraint (THOR). The biofidelity of the THOR was assessed (and compared to WorldSID) with PMHS experiments in the far-side scenario. The comparisons were made based on head, T1, T12, and sacrum excursions; regional body accelerations; and seat belt forces. Correlation and analysis was used to assess the biofidelity using matched pair tests (Umale, Arun, et al. Citation2018). The correlation and analysis score was in the good category for head excursions (0.71 and 0.72) and in the fair category (0.60 and 0.68) for the overall score for the pure lateral and oblique loading cases for the THOR (Umale, Hauschild, et al. 2018). The objective of the present study is to evaluate the chestband-based thorax deflection responses of the THOR dummy in far-side sled tests and provide a more comprehensive assessment of the response of this test device.
Methods
Dummy setup on the sled platform
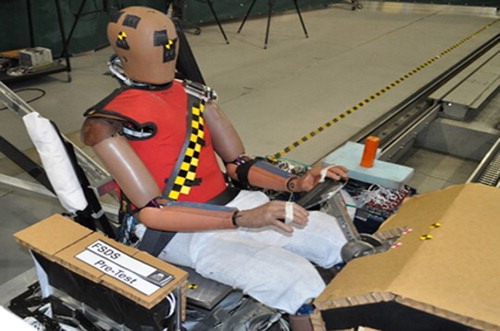
Tests were carried out using the THOR 50th percentile male dummy. The test matrix is given in Table A1 (see online supplement). The specific version used was a THOR Mod Kit w/SD-3, as defined in Parent et al. (Citation2013). The dummy was seated upright in a buck (described in the next paragraph) according to the THOR seating procedures that suggested using tilt sensors (Dang Citation2015). It was restrained using a 3-point belt restraint (1.2-kN pretensioner and 3- to 3.5-kN load-limiting retractor). The buck consisted of a rigid flat seat, a simulated center console, a dashboard, a far-side side door structure, and an armrest. It represented the interior of a small-size U.S. passenger car, and the seat dimensions and belt anchor locations were based on the 2007–2012 Toyota Yaris. The buck was designed such that pure lateral (90°) and oblique (45°) impacts could be conducted with the dummy or any other type of surrogate. The back of the restrained THOR was supported by aluminum bars for the pure lateral tests and horizontal wires for the oblique tests. The center console and dashboard were covered with 25-mm paper honeycomb (152 kPa). The simulated intruded door structure was covered with 50-mm Dow Ethafoam 220 padding. The armrest was covered with 64-mm Armacell Oletex padding. The center-mounted airbag was mounted to the right side of the seat at a location matching the original equipment manufacturer seat (). The far-side door structure was placed 870 mm from the centerline of the seat. The dummy was instrumented with 2 chestbands (Denton Inc., Rochester Hills, MI), which were placed directly on the THOR ribs inside the jacket (Morgan et al. Citation1994). Both had 59 gages. The first (termed the upper) chestband was routed at the level of the third thoracic rib, and the second (termed the lower) chestband was routed at the level of the sixth thoracic rib of the dummy. Oblique and pure lateral (45° and 90°s) sled tests were conducted at a velocity of 8.3 m/s. Two tests with an airbag and 2 tests without an airbag were conducted in the oblique condition.
Figure 1. Picture showing the location of the center-mounted airbag
Instrumentation and chest deflections
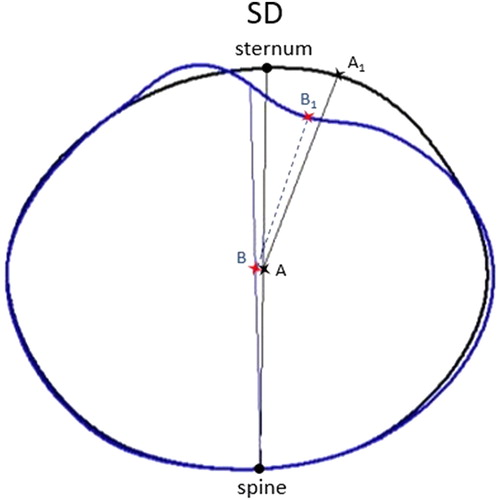
The sled acceleration profile was recorded using an accelerometer (model 73BMEO-750, Entran Devices Inc., Fairfield, NJ) rigidly fixed to the platform of the sled. Data from the sled accelerometer were gathered and processed according to the Society of Automotive Engineers (SAE) J211 specifications (SAE 2014). The temporal deformation contours at the upper and lower thorax levels were computed by processing the strain gauge signals using the following methodology. Signals were filtered using an SAE Class 1000 filter. The contours of chestband shapes were computed at 0.05 ms from curvature signals using custom software (CrashStar; Heather Rhule, personal communication). The spine and sternum locations on the pretest contour were identified based on their actual locations with respect to the strain gages on the chestband. The software requires the user to input one location for reference (the anchor) to determine the location of the origin for the contour output. The gage closest to the spine was used as the anchor. The midpoint of the line joining the spine and sternum points defined the origin and the distance from the spine to the origin was recorded (). The origin was situated in all contours at the same distance from the spine along the spine–sternum line. The deflection of each gage along the contour at each time step was defined as the change in the distance between the line joining this point and the origin in the initial pretest and deformed contours. The gage on the contour that resulted in the largest change in the magnitude from its initial gage-to-origin distance determined the maximum deflection. This deflection was termed as the SS-based deflection (SD).
Figure 2. Calculation method for the SD deflections. A and B refer to the origin in the undeformed and deformed contours. The peak deflection is the difference between the vectors AA1 and BB1. Refer to the text for details.
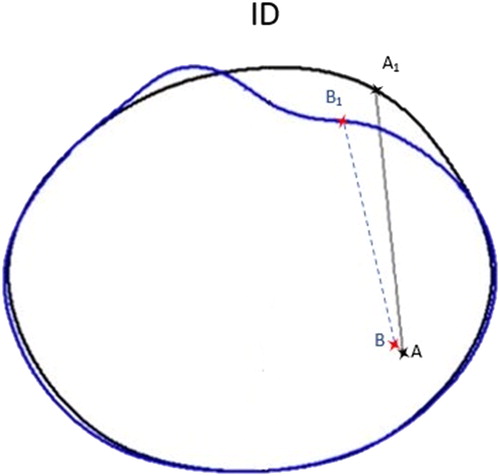
Another type of deflection was computed to represent the chest deflection as measured by the InfraRed Telescoping Rods for the Assessment of Chest Compression (IR-TRACC) device and termed ID (IR-TRACC-based deflection; ). The origin and point on the chest contour in the ID method represented the physical location of the anchor point inside the THOR dummy (origin) and its corresponding attachment point to the rib. Deflection was measured as the difference between these 2 points during the event and determined at the upper and lower chestbands for the left and right sides.
Figure 3. Calculation method for the ID deflections. A and B refer to the origin in the undeformed and deformed contours. The peak deflection is the difference between the vectors AA1 and BB1. Refer to the text for details.
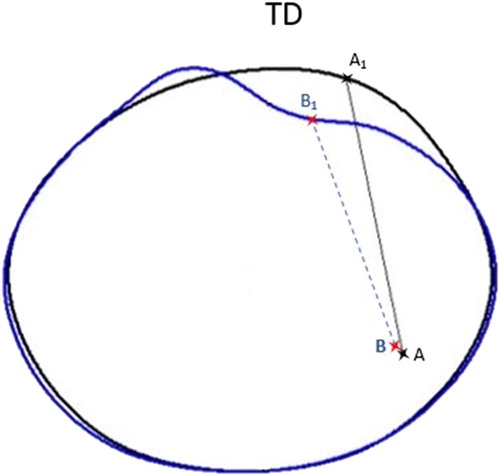
Finally, a third type of deflection was computed, which represented a theoretical sensor-based deflection (TD), which searched the contour for the ideal location of the attachment point of the IR-TRACC to the rib (). In the TD method, the location of the origin was the same as the ID method (corresponding to the anchor point of IR-TRACC); however, the rib-end point was selected as the location on the contour that yielded the largest deflection. The chest deflection was calculated for each point on the contour in a 90° arc spanning from the most lateral point on the rib to the sternum. This limit ensured that the theoretical sensor never crossed the midline of the torso.
Figure 4. Calculation method for the TD deflections. A and B refer to the origin in the undeformed and deformed contours. The peak deflection is the difference between the vectors AA1 and BB1. Refer to the text for details.
Results
and (see online supplement) show the undeformed contour shapes overlaid with the shape of the contour at the peak deformation for the oblique test without and with the airbag, at the upper and lower levels of the thorax, and and (see online supplement) show these contour shapes for the pure lateral test, respectively. Also shown are the origins based on the ID and TD metrics at the left, SD metric, and ID and TD metrics at the right, and the vectors of the peak deflections for each of the 3 metrics for the upper and lower levels of the thorax. As can be seen, the contours associated with the lower thorax level are distinctly different from those for the upper thorax levels, especially in the oblique tests, regardless of the presence or absence of the airbag. compares the various metrics across all test conditions at the upper thorax level, and compares the metrics at the lower thorax level. The SD deflection metrics (middle bars in the figures) consistently had the greatest magnitudes for all tests.
Figure 5. Peak chest deflections at the upper thorax level.
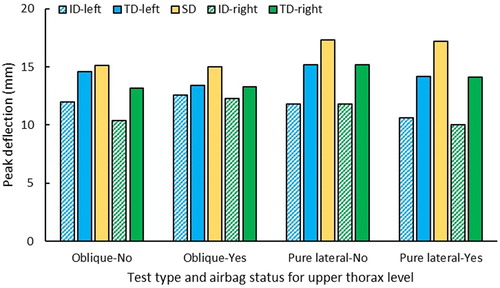
Figure 6. Peak chest deflections at the lower thorax level.
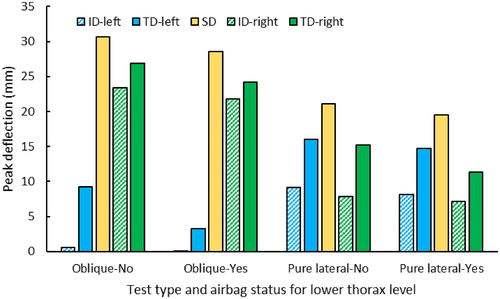
The left and right ID (sensor location) and TD metrics for the oblique tests were lower than the SD metric with and without the airbag. The lower right ID and TD deflections were greater than those for the left side during the oblique tests with and without the airbag. The ID and TD metrics for the lateral tests were less than the SD metric for both left and right sides, with and without the airbag. In the pure lateral tests, the TD metric was greater for the right and left sides than the ID metric, but the deflections between the right and left sides had similar values. The upper thorax had similar trends for the SD, ID, and TD metrics as the lower thorax; however, the maximum values were lower and grouped closer to each other. Typically, the SD was highest, whereas the ID was the lowest value in every case. The percentage differences between the ID and TD metrics, however, were nonuniform across the ensemble. These are discussed below.
Discussion
As stated in the Introduction, this study was focused on the thorax because of its importance to occupant protection in far-side impacts. Because chest deflection has been correlated with injuries to the human thorax in PMHS experiments, this metric was chosen for analysis in the current investigation (Cavanaugh and Yoganandan 2015; Maltese et al. Citation2002; Pintar et al. Citation1997; Shaw et al. Citation2006; Viano Citation1989; Yoganandan et al. Citation2000, Citation2007). Furthermore, the internal sensors in the dummy can record the chest deflections at bilateral locations, and from this perspective the current data analysis is applicable to assess dummy measures for their efficacy. The chestband is proven to be a reliable device in both PMHS and physical dummy models (Kuppa et al. Citation2003; Pintar et al. Citation1997, Citation2007; Shaw et al. Citation2006; Yoganandan et al. Citation2015). The accepted methodologies for the extractions of the peak chest deflections from the chestband signals in pure lateral and oblique side impacts use the spine–sternum line and locate the origin at its midpoint in PMHS and dummy tests (Yoganandan et al. Citation2008, Citation2012; Yoganandan, Pintar, et al. Citation2011). The same methodology was used in this investigation to determine the SD metric. These deflections represent the external deflections of the dummy thorax at the 2 levels where the chestbands were attached to the device.
A query of the CIREN database of far‐side cases with AIS 2+ injuries yielded 122 cases for analysis (Arun et al. Citation2017). They were divided based on the rotation of the vehicle (clockwise and counterclockwise) and injuries to the head, thorax, and pelvis regions. Average vehicle velocities were paired with seat velocities for the thorax injury cases. Whereas the former data are given for the 2 rotations (table 1 in Arun et al. (Citation2017), 10.94 and 9.07 m/s), for this study, the mean seat velocity was computed, and it was 9.3 m/s for clockwise rotation and 7.3 m/s for counterclockwise rotation. The mean seat velocity of 8.3 m/s was selected as the input for the present series of sled tests. The sled pulse is shown in (see online supplement).
An analysis of the NASS-CDS database for the years 2009–2012 showed that the extent zone of Centers for Disease Control and Prevention (CDC) 3+ increased the odds of MAIS 2+ and MAIS 3+ injuries compared to zones 1 to 2 (Yoganandan et al. Citation2014). The placement of the far-side door structure in this study was close to the SAE J224 side deformation classification extent zone 3. The paper honeycomb and foam with the specifications stated previously are routinely used to simulate vehicle paddings and avoid damage to anthropomorphic test device instrumentation from impact with rigid structures (Hauschild et al. Citation2016; Kuppa et al. Citation2003; Maltese et al. Citation2002; Pintar et al. Citation2007).
Three types of deflections were extracted from the temporal contours: SD, TD (left and right), and ID (left and right). The first metric represents the peak deflection based on the spine–sternum line regardless of the aspect, the second metric represents the peak deflections based on the actual anchor location of the sensor (origin) and aspect, and the third metric represents the peak deflections based on the actual anchor location of the sensor (origin) and aspect and its initial attachment to the rib of the dummy; that is, the actual alignment of the sensor from the origin to its tip. The SD metric is expected to produce the most realistic deflections because it is not an a priori choice of the aspect, location, and alignment, and the most constrained variable is the ID metric because all 3 factors are chosen a priori.
The temporal contours extracted from chestband signals are flexible to compute deflections using other approaches, although they may not yield the global maxima. This flexibility was used to obtain the peak deflection that paralleled the sensor-based measurements (ID metric), although actual sensor recordings were not made in these tests. Because 2 sensors are located at the same level of the thorax in the THOR dummy and with separate anchor points, the approach used to obtain the ID metric involved locating separate origins in each contour for the left and right sides. The peak deflections based on the same temporal thoracic deformation contours yielded 2 maximum deflections corresponding to each aspect. These deflections are therefore expected to be different from those for the SD metric, which relied on determining the peak deflections regardless of the aspect. Though the expectation was that the ipsilateral deflection from the sensor-based origin would be the same as the SD metric, it was not consistent for all cases in the present series of experiments. The SD and ID computations were consistent for each location (upper and lower) across each test configuration. This shows that the ipsilateral deflections associated with the ID metric underestimate the true peak deflections and, hence, underpredict the risk of thorax injuries. To fully explore the statistical significance of this comparison, additional tests are necessary, and they are considered as future research topics.
By ignoring the existing physical line of attachment to the rib from its origin, the TD metric also underpredicted the peak deflection, regardless of whether the sensor was on the right or left, pure or oblique impact, and presence or absence of an airbag. Though the aspect is a dummy-based design constraint and the other 2 factors correspond to the principal direction of force and the restraint system, this comparison also shows that locating the sensor at either aspect does not yield the true maximum deflections and, hence, should be considered less efficacious. At the upper level, the ID underpredicted the TD by 27% in pure lateral tests and by 7% oblique tests for the with airbag condition and by 22 and 20%, respectively, for the without airbag condition. At the lower level, the ID underpredicted the TD by 41% in pure lateral tests and by 53% in oblique tests for the with airbag condition and by 46 and 53%, respectively, for the without airbag condition. Data were averaged from left and right sides for the above analysis. These results appear to suggest that improvements can be made in the sensing aspects of the dummy responses, without altering its proven biofidelity responses. As suggested in an earlier study for other test devices (WorldSID and ES2-re), optical methods may be more feasible (Yoganandan, Pintar, et al. Citation2011). This topic needs further exploration before recommending the dummy for far-side occupant protection.
The SD metric data from the duplicate oblique tests without the airbag showed that the difference in peak deflections across all 10 metrics (2 levels, 3 methods, and 2 aspects for 2 metrics) between the repeated tests was within 5% (4.54 ± 2.7%, range 0.96–7.12% for the upper thorax and 5.04 ± 1.0%, range 3.3–6.73% for the lower thorax), and the overall average across all data was 4.8 ± 1.8%. This reinforces the repeatability of the dummy responses even when the deflections are derived from a nonstandard sensor and its potential use in far-side impact protection. Repeated tests were not conducted in the lateral mode.
Limitations of the study include the use of one test device. Though no standards exist for far-side occupant injury assessment and protection, at least 2 devices have the potential, and no test device is currently recommended in the United States in Part 572 of the Code of Federal Regulations (Citation2008), the THOR dummy was selected in this study because of its design features. The WorldSID dummy is another likely candidate for far-side protection (Scherer et al. Citation2009). Its thorax, however, is more simplified with regular geometrical shapes for the ribs, and the THOR dummy better represents the true anatomical features of the human rib cage. The assumption that the ID metric represents the actual IR-TRACC measurement should be validated with additional tests. Other limitations include the number of tests with different types of countermeasures such as airbags, angles, and impact severities. The present results can be used in computational simulations of this dummy to determine the responses using parametric modeling techniques (Maatouki et al. Citation2018). The next series of tests should include actual sensor records.
A 2018 study compared motor vehicle crash risk from different countries focusing on vehicle model years 2003 or later (Flannagan et al. Citation2018). Field data were analyzed using the NASS for the United States, the Cooperative Crash Injury Study from Great Britain, the Véhicule Occupant Infrastructure Etudes de la Sécurité des Usagers de la Route (Vehicle Occupant Infrastructure and Road Users Safety Studies) from France, and the German In-Depth Accident Study from Germany. Data from the European Pan-European Coordinated Accident and Injury Database project that covered 8 European Union countries were included. The risk of injuries in front/side impacts was greater for the U.S. environment. Studies focusing on the far side, such as the present one, should be conducted to discern the specific information for far-side occupants, and this should be a future field-based analysis.
The present data set delineates the far-side response of the THOR dummy under 2 vectors (oblique and pure lateral) with and without the presence of airbags and at 2 locations and levels of the thorax. In addition, these data are directly relatable to the currently located internal sensors in the dummy. The differing locations of the peak deflection vectors along the rib contours for different test conditions suggest that a priori attachment is less efficacious. Further, varying magnitudes of the differences between ID and TD metrics underscore the difficulty in extrapolating ID outputs under different conditions: Pure versus oblique, airbag presence, and thoracic levels. Deflection measurements should therefore not be limited to an instrument that can only track from a fixed point. The present thorax- and deflection-specific results contribute to a better assessment of the THOR dummy responses for far-side occupant protection.
Supplemental Material
Download MS Word (819.7 KB)Acknowledgments
This material is the result of work supported with resources and the use of facilities at the Zablocki VA Medical Center, Milwaukee, Wisconsin, and the Medical College of Wisconsin. The authors thank Dr. Rodney Rudd of NHTSA for his assistance.
Additional information
Funding
Related Research Data
References
- 49 Code of Federal Regulations: 571.214. Washington, DC: U.S. Government Printing Office; 2008. FMVSS-214.
- Arun MWJ, Umale S, Halloway D, Yoganandan N, Pintar FA. Can 1 –DOF sled tests reproduce real world far-side crashes? Paper presented at: IRCOBI Conference; 2017.
- Augenstein J, Perdeck E, Martin P, et al. Injuries to restrained occupants in far-side crashes. Annu Proc Assoc Adv Automot Med. 2000;44:57–66.
- Bahouth GT, Murakhovskiy D, Digges KH, Rist H, Wiik R. Opportunities for reducing far-side casualties. Paper presented at: International Technical Conference on the Enhanced Safety of Vehicles; 2015.
- Bostrom O, Gabler HC, Digges K, Fildes B, Sunnevang C. Injury reduction opportunities of far side impact countermeasures. Ann Adv Automot Med. 2008;52:289–300.
- Cavanaugh JM, Yoganandan N. Thorax injury biomechanics. In: Yoganandan N, Nahum AM, and the Medical College of Wisconsin, eds. Accidental Injury: Biomechanics and Prevention. 3rd ed. New York, NY: Springer; 2015:331–372.
- Dang JC. THOR-50th Percentile Male Metric Driver Dummy Seating & Positioning Procedures. Washington, DC: Docket NHTSA-2015-0119, Dec 9, 2015.
- Digges K, Dalmotas D. Injuries to restrained occupants in far side crashes. Paper presented at: International Conference on Enhanced Safety of Vehicles; 2001; Amsterdam, The Netherlands.
- Digges K, Echemendia C, Fildes BN, Pintar FA. A safety rating for far-side crashes. Paper presented at: International Conference on Enhanced Safety of Vehicles; 2009.
- Fildes B, Vulcan AP, Lane JC. Side impact crashes in Australia. Paper presented at: 14th International Technical Conference on the Enhanced Safety of Vehicles; 1994.
- Flannagan CAC, Balint A, Klinich KD, et al. Comparing motor-vehicle crash risk of EU and U.S. vehicles. Accid Anal Prev. 2018;117:392–397.
- Forman JL, Lopez-Valdes F, Lessley DJ, et al. Occupant kinematics and shoulder belt retention in far-side lateral and oblique collisions: a parametric study. Stapp Car Crash J. 2013;57:343–385.
- Frampton R, Brown R, Thomas P, Fay P. The importance of non-struck-side occupants in collisions. Annu Proc Assoc Adv Automot Med. 1998;42:303–320.
- Gabler H, Digges K, Fildes BN, Sparke L. Side Impact Injury Risk for Belted Far-Side Passenger Vehicle Occupants. Warendale, PA: Society of Automotive Engineers; 2005. SAE Paper No. 2005-01-1287.
- Gabler H, Fitzharris M, Scully J, Fildes BN, Digges K, Sparke L. Far-side impact risk for belted occupants in Australia and the United States. Paper presented at: International Conference on Enhanced Safety of Vehicles; 2005; Gothenburg, Sweden.
- Hauschild HW, Humm JR, Pintar FA, et al. Protection of children in forward-facing child restraint systems during oblique side impact sled tests: intrusion and tether effects. Traffic Inj Prev. 2016;17(Suppl 1):156–162.
- Kuppa S, Eppinger RH, McKoy F, Nguyen T, Pintar FA, Yoganandan N. Development of side impact thoracic injury criteria and their application to the modified ES-2 dummy with rib extensions (ES-2re). Stapp Car Crash J. 2003;47:189–210.
- Maatouki I, Fu S, Zhou Z. Latest FE model development of THOR-50M crash test dummy. Paper presented at: LS-DYNA Conference; 2018; Dearborn, MI.
- Maltese MR, Eppinger RH, Rhule HH, Donnelly BR, Pintar FA, Yoganandan N. Response corridors of human surrogates in lateral impacts. Stapp Car Crash J. 2002;46:321–351.
- Morgan RM, Eppinger RH, Haffner MP, Yoganandan N. Thoracic trauma assessment formulations for restrained drivers in simulated frontal impacts. Paper presented at: Stapp Car Crash Conference; 1994.
- NHTSA. Laboratory Test Procedure for the New Car Assessment Program Side Impact Moving Deformable Barrier Test. Washington, DC: U.S. Department of Transportation, National Highway Traffic Safety Administration; 2012.
- Parent D, Craig M, Ridella SA, McFadden JD. Thoracic biofidelity assessment of the THOR Mod Kit ATD. Paper presented at: 23rd International Technical Conference on the Enhanced Safety of Vehicles; 2013; Seoul, South Korea.
- Pintar FA, Yoganandan N, Hines M, et al. Chestband analysis for side impact. Paper presented at: 41st Stapp Car Crash Conference; 1997.
- Pintar FA, Yoganandan N, Stemper BD, et al. Comparison of PMHS, WorldSID, and THOR-NT responses in simulated far side impact. Stapp Car Crash J. 2007;51:313–360.
- Scherer R, Bortenschlager K, Akiyama A, Tylko S, Hartlieb M, Harigae T. WorldSID production dummy biomechanical responses. Paper presented at: Experimental Safety of Vehicles Conference; 2009; Stuttgart, Germany.
- Shaw JM, Herriott RG, McFadden JD, Donnelly BR, Bolte JH. Oblique and lateral impact response of the PMHS thorax. Stapp Car Crash J. 2006;50:147–167.
- Society of Automotive Engineers. Instrumentation for Impact Test. Warrendale, PA: Author; 2014. Paper No. J211-1.
- Thomas P, Frampton R. Injury patterns in side collisions—a new look with reference to current test methods and injury criteria. Paper presented at: 43rd Stapp Car Cash Conference; 1999.
- Umale S, Arun MW, Hauschild H, Humm J, Yoganandan Y. Quantitative evaluation of THOR, World SID and Hybrid III under far‐side impacts: a finite element study. Paper presented at: IRCOBI Conference; 2018; Athens, Greece.
- Umale S, Hauschild H, Humm JR, Yoganandan N. 2018a. Effectiveness of center-mounted airbag in far-side impacts based on THOR sled tests. Paper presented at: 62nd AAAM Conference; 2018; Nashville, TN.
- Viano DC. Biomechanical responses and injuries to blunt lateral impact. Paper presented at: 33rd Stapp Car Crash Conference; 1989.
- Yoganandan N, Arun MW, Halloway DE, et al. Crash characteristics and injury patterns of restrained front seat occupants in far-side impacts. Traffic Inj Prev. 2014;15(Suppl 1):S27–S34.
- Yoganandan N, Fitzharris M, Pintar FA, et al. Demographics, velocity distributions, and impact type as predictors of AIS 4+ head injuries in motor vehicle crashes. Ann Adv Automot Med. 2011;55:267–280.
- Yoganandan N, Humm JR, Pintar FA, Brasel KH, Rudd RW, Ridella SA. Thoraco-abdominal deflection responses of post mortem human surrogates in side impacts. Stapp Car Crash J. 2012;56:49–64.
- Yoganandan N, Pintar FA, Gennarelli TA, Maltese MR. Patterns of abdominal injuries in frontal and side impacts. Annu Proc Assoc Adv Automot Med. 2000;44:17–36.
- Yoganandan N, Pintar FA, Gennarelli TA, Martin PG, Ridella SA. Chest deflections and injuries in oblique lateral impacts. Traffic Inj Prev. 2008;9:162–167.
- Yoganandan N, Pintar FA, Humm J, Brasel K. Region-specific deflection responses of WorldSID and ES2-re devices in pure lateral and oblique side impacts. Stapp Car Crash J. 2011;56:259–269.
- Yoganandan N, Pintar F, Humm J, Rudd R. Injuries in full-scale vehicle side impact moving deformable barrier and pole tests using postmortem human subjects. Traffic Inj Prev. 2015;16(Suppl 2):S224–S230.
- Yoganandan N, Pintar FA, Stemper BD, Gennarelli TA, Weigelt JA. Biomechanics of side impact: injury criteria, aging occupants, and airbag technology. J Biomech. 2007;40:227–243.
