
Abstract
Objective: The objective of this article is to describe the characteristics of fatal crashes with bicyclists on Swedish roads in rural and urban areas and to investigate the potential of bicycle helmets and different vehicle and road infrastructure interventions to prevent them. The study has a comprehensive approach to provide road authorities and vehicle manufacturers with recommendations for future priorities.
Methods: The Swedish Transport Administration’s (STA) in-depth database of fatal crashes was used for case-by-case analysis of fatal cycling accidents (2006–2016) on rural (n = 82) and urban (n = 102) roads. The database consists of information from the police, medical journals, autopsy reports, accident analyses performed by STA, and witness statements. The potential of helmet use and various vehicle and road infrastructure safety interventions was determined retrospectively for each case by analyzing the chain of events leading to the fatality. The potential of vehicle safety countermeasures was analyzed based on prognoses on their implementation rates in the Swedish vehicle fleet.
Results: The most common accident scenario on rural roads was that the bicyclist was struck while cycling along the side of the road. On urban roads, the majority of accidents occurred in intersections. Most accidents involved a passenger car, but heavy trucks were also common, especially in urban areas. Most accidents occurred in daylight conditions (73%). Almost half (46%) of nonhelmeted bicyclists would have survived with a helmet. It was assessed that nearly 60% of the fatal accidents could be addressed by advanced vehicle safety technologies, especially autonomous emergency braking with the ability to detect bicyclists. With regard to interventions in the road infrastructure, separated paths for bicyclists and bicycle crossings with speed calming measures were found to have the greatest safety potential. Results indicated that 91% of fatally injured bicyclists could potentially be saved with known techniques. However, it will take a long time for such technologies to be widespread.
Conclusions: The majority of fatally injured bicyclists studied could potentially be saved with known techniques. A speedy implementation of important vehicle safety systems is recommended. A fast introduction of effective interventions in the road infrastructure is also necessary, preferably with a plan for prioritization.
Introduction
As a mode of transport and exercise, cycling can play a significant role in achieving several of the United Nations’ Sustainable Development Goals. However, to be able to see the road transport system as sustainable according to Vision Zero, it must be safe for all road users. This is not the case today. Bicyclists are the most frequently injured road user group, in terms of severe injuries, according to the Swedish Transport Administration (STA Citation2018a). Bicyclists account for approximately 8% of all road fatalities in the European Union (European Transport Safety Council Citation2015). The number of road traffic fatalities is decreasing in Europe, especially regarding car occupants, but the number of fatalities among cyclists does not follow the same positive trend (European Transport Safety Council Citation2015; STA Citation2018a). The number of fatally injured car occupants has decreased by 60% since the early 2000s. In contrast, during the same period, the number of fatally injured bicyclists did not decrease (STA Citation2018b). Therefore, further initiatives aimed at reducing the number of fatally injured bicyclists are needed. During the last 5 years, on average 24 bicyclists were fatally injured in Sweden annually (STA Citation2018b), accounting for nearly 8% of all fatalities in the road transport system. The vast majority of bicyclists were struck by a car. Nonetheless, crashes between bicyclists and heavy goods vehicles (HGVs) comprise a high proportion of fatal crashes within urban areas (Malczyk and Bende Citation2018; Talbot et al. Citation2017).
To achieve the traffic safety goals in Sweden, a number of safety performance indicators are used and followed over time (STA Citation2018a). Important indicators for bicyclists are helmet use rates; proportion of safe crossings for pedestrians, bicyclists, and mopeds; and development of the vehicle fleet with regard to active systems for vulnerable road users (VRUs). In crashes between vehicles and VRUs, impact speed is one of the parameters with the highest influence on the risk of fatality and serious injury (Rosen and Sander Citation2010). The Vision Zero guidelines recommend a maximum speed limit of 30 km/h when there is a risk for collision with VRUs (Johansson Citation2008). However, it is possible to adopt further countermeasures. Studies have shown that a combination of speed calming road infrastructure, bicycle helmets, and more protective car fronts may reduce the risk for permanent medical impairment among bicyclists up to 95% (Ohlin et al. Citation2014). In addition to passive safety systems, autonomous emergency braking (AEB) with pedestrian and bicyclist detection has been introduced in cars and has also been shown to be effective (up to 40% reduction; Rosen et al. Citation2010). However, deeper knowledge is needed regarding the effectiveness of vehicle safety technologies aimed at avoiding or mitigating the severity of collisions with bicyclists and of current and future road infrastructure interventions aimed at targeting bicyclists. It is also important to better understand whether accidents today are likely to be prevented in the future and to prioritize among different preventive interventions. A relevant and useful method to identify future safety gaps has been developed and applied by the STA (Strandroth Citation2015; Strandroth et al. Citation2016).
The objectives were to describe the characteristics of fatal crashes with bicyclists on Swedish roads in rural and urban areas and to investigate the potential of bicycle helmet and different vehicle and road infrastructure interventions to prevent them. The study has a holistic approach providing road authorities and vehicle manufacturers with recommendations for future priorities in line with Vision Zero.
Methods
Material
STA’s in-depth database of fatal crashes was used to study fatally injured bicyclists from 2006 to 2016. In total 184 accidents were included. Both single-vehicle crashes and crashes where the cyclist was hit by a motor vehicle were included. The database consists of information from the police, medical journals, autopsy reports, accident analyses performed by STA, and witness statements (Swedish Transport Administration Citation2005). Crash investigators at STA systematically inspect the vehicles involved, the crash scene, and road users involved with the aim to investigate how each accident could have been prevented. In the current study, all fatal crashes were included in the sampling criterion, and the material can therefore be considered to represent typical Swedish cycling fatalities. The accident locations were divided into rural and urban areas. In Sweden, an urban area is defined as an area with houses and with at least 200 inhabitants unless the distance between the houses is more than 200 m. A rural area is a geographic area not defined as urban with a low population density located outside towns and cities.
Potential analysis
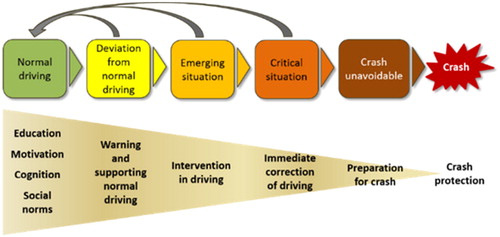
Crashes were studied from a system’s approach perspective, and the potentials of helmet use and several vehicle and infrastructure safety countermeasures were determined retrospectively for each case by analyzing the entire chain of events leading to the fatality, in agreement with previous related studies with different data sets (Rizzi Citation2016; Strandroth et al. Citation2012; ). By using this model, it is possible to avoid double counting of potentials (i.e., a fatality cannot be prevented twice with different interventions) and detailed future estimates can be made by studying crashes from the baseline and apply assumptions regarding the progress of countermeasures.
Figure 1. The chain of events leading up to a crash. From Rizzi (Citation2016). Reprinted with permission.
The countermeasures included in the analysis are listed in the Appendix (Table A, see online supplement). The relevance of road infrastructure interventions was analyzed depending on the road width, traffic flow, and other road characteristics. These interventions were based on previous evaluations (Elvik and Vaa Citation2004) and design principles in Vison Zero (Johansson Citation2008). A safe road transport system focuses on reducing the number of accidents by, for example, speed management (roundabouts, speed cameras, and road humps) and physical separation between motorized vehicle and unprotected road users. Road infrastructure interventions and helmet use were assumed to be implemented immediately and thereby impacting the outcome. Vehicle safety technologies (e.g., electronic stability control, AEB, lane departure warning, and lane-keeping assist) shown to be effective in reducing injuries (Lie et al. Citation2006; Rizzi et al. Citation2014; Sternlund et al. Citation2017) were applied to the crashes to make predictions on fatality reductions in 2030 and 2050 (Appendix, Table A).
As a first step in the analysis, the potential of each of the 3 countermeasure areas—helmet use, infrastructure safety countermeasures, and existing and future vehicle safety systems—was assessed. In addition, the combined potential of the 3 areas was assessed without double counting. Secondly, an estimate was made of which fatal accidents could be avoided in the future, based on predicted implementation rates of existing safety technologies considered to be able to prevent the fatalities (). The model year when a close to 100% fitment rate of each safety technology in new sold vehicles was predicted by a Swedish group of experts, including car manufacturers and senior researchers, led by the STA. For each case, based on the model year of the vehicles involved in the fatal crashes, it was determined whether the vehicle would be fitted with a certain safety technology in 2030 or 2050 that would make it likely to prevent the fatality. The effect of 2 different implementation rates was analyzed, one with a predicted normal rate and the other with a 5-year faster implementation rate. In a last step, the analysis also included a number of other vehicle safety technologies (e.g., AEB VRU on buses or HGVs; ) expected to be relevant; however, no projections of their implementation rates was made. The method used in the present study has been described previously (Kullgren et al. Citation2017; Strandroth et al. Citation2012, Citation2016), and it has been used by the STA to manage the national road traffic safety work and to prioritize among future interventions aimed at achieving Vision Zero.
Table 1. Distribution of fatalities per vehicle type.
Results
Characteristics of the fatal bicycle crashes
Out of the 184 fatally injured bicyclists during 2006–2016 in Sweden, 82 accidents occurred on rural roads and 102 occurred on urban roads. In total 74% were collisions with vehicles, 20% were single bicycle crashes, and 6% were other crash types. The outcome varied for rural and urban areas. In almost half of the cases (46%), the bicyclist was struck by a passenger car, and this share was higher on rural roads. The proportion of bicyclists struck by an HGV was twice as high on urban roads compared to rural roads. The proportion of single bicycle accidents was also twice as high on urban roads ().
Approximately 34% of the accidents occurred in crossings in collisions between a motor vehicle and a bicycle. Of these, a slightly higher proportion occurred when the bicycle was coming from the left compared to from the right (). Twenty-six percent of accidents were longitudinal, in which the bicycle was struck in the rear or while turning left. Six percent occurred in collisions in which the motor vehicle was turning right and the bicycle was moving inside the turn, along its right side (). A large share (43%) of bicyclists were struck on the carriageway (56% on rural roads and 32% on urban roads; ).
Table 2. Distribution of fatalities by accident type.
Among bicyclists on rural roads, the most common accident scenario was being struck while cycling on and along the road, whereas for urban roads it was while crossing the road. In total 43% were killed while crossing the road (51% on urban roads and 33% on rural roads). Less than 10% occurred on bicycle crossings, and none of these cases included any speed calming measures. Only 10 out of the 184 fatalities occurred on roads with separated lanes (Appendix, Table B, see online supplement).
Vehicle frontal impacts were the most common (79%) with a mean estimated collision speed, including passenger cars, buses, light goods vehicles (LGVs), and HGVs, of 65 km/h on rural roads and 40 km/h on urban roads. Nearly 40% of bicyclists were struck from the side and 16% were struck from the front. The share of bicyclists struck from the rear was much larger on rural roads (34%) compared to urban roads (9%; Appendix, Table B).
The majority of fatal accidents occurred in daylight conditions (73%), whereas relatively few occurred in dark lighting conditions (21%). Two out of 3 accidents occurred during leisure time and 1 out of 10 (11%) while commuting to or from work. One out of 4 (24%) accidents occurred under obscure conditions, in which a combination of light, weather, and/or sight distance would complicate detection by vehicle safety sensors. In 1 out of 10 (11%) accidents the bicyclist was partly obscured by other vehicles or objects. The majority of the accidents occurred on dry, nongravel roads (71%; Appendix, Table B).
Regarding intoxicants, 15% of bicyclists were under the influence of alcohol and 2% were under the influence of drugs. Only 3% of drivers of the striking motor vehicles were under the influence of alcohol and none was under the influence of drugs (Appendix, Table B).
The most common fatal injury was to the head (70%), followed by thoracic injuries (15%; Appendix, Table B). The vast majority (75%) of fatally injured bicyclists were not wearing a helmet, and 46% of these would have survived with a helmet.
Analysis of the potentials of countermeasures
It was inferred that 91% of fatalities could have been avoided with relevant interventions regarding road infrastructure, vehicle safety systems, bicycle helmet use, or a combination of different measures (). Assessments indicated that road infrastructure interventions could have prevented 75% of bicyclist fatalities and vehicle-related intervention could have prevented 57%. For 16 of the fatalities (9%) no known intervention could be identified (4 on rural roads and 12 on urban roads). Eleven of these were single accidents and, of these, 3 bicyclists had high blood alcohol concentrations. Furthermore, one was hit from the rear by an HGV, one was struck by a wheel loader, one by a motorcycle, and one by a passenger car.
Table 3. Overview of possible interventions to prevent fatalities.
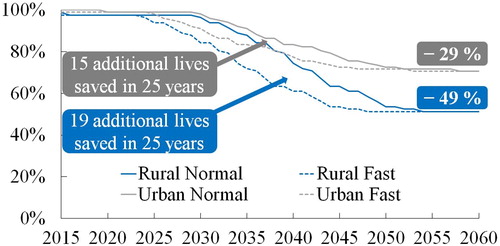
Forty-nine percent of bicyclist fatalities on rural roads and 29% of bicyclist fatalities on urban roads would likely have been prevented if relevant safety systems had been implemented in the whole vehicle fleet. However, this will occur far in the future (in 2050), assuming current implementation rates (). In 2020, 96% of the accident population would not be addressed by the estimated improvements of the safety systems, and by 2030 between 84 and 95% would stilll be left, according to estimates. A faster implementation rate would mean an additional 15 saved lives on urban roads and 19 on rural roads during a 25-year period, compared to the anticipated implementation rate (Appendix, Table A).
Figure 2. Estimate of the future development of fatal injuries among bicyclists on rural and urban roads as an effect of the implementation of vehicle safety technologies listed in the Appendix. Dotted lines = fast implementation rate; solid lines = expected implementation rate.
It was estimated that the vehicle safety technology with the highest potential was AEB for passenger cars with bicyclist detection. With this system available, 30% of fatalities on urban roads and 43% of those on rural roads could likely be avoided. Furthermore, autonomous emergency steering (AES) systems with detection of bicyclists was found to have potential to prevent 10% of fatalities on urban roads and 40% of those on rural roads (Appendix, Table C, see online supplement). Further, it was inferred that other vehicle safety technologies would be relevant: 16% of the bicyclist fatalities (AEB and AES on LGVs, HGVs, and buses, 15%; side radar for HGVs, 1%) could be prevented on rural roads, and 18% (AEB on HGVs, and buses, 6%; side radar for HGVs and buses, 12%) could be prevented on urban roads. Note, however, that no projections related to their implementation rates were made in this study.
Separate bicycle paths outside the carriageway had the potential to prevent approximately 30% of fatalities (46% on rural roads and 17% on urban roads; ). Other effective interventions were bicyclist crossings with speed calming measures for the motor vehicles, which had the potential to address 28% of the fatalities (20% on rural and 35% on urban roads), as well as a lower speed limit, which, in combination with speed calming interventions), had the potential to prevent 15% of fatalities. Roundabouts in combination with bicyclist crossings with speed calming measures were also found to be effective in urban areas in cases where the accident occurred in intersections.
Table 4. Potentials of infrastructure interventions to prevent fatalities.
Discussion
This study used a holistic approach with the aim to investigate the potential of several different types of interventions to prevent fatal bicycle accidents. The findings provide road authorities and vehicle manufacturers with important recommendations for future priorities in order to more effectively reduce bicycle fatalities and to assist them in moving toward Vision Zero. This article demonstrates the importance of studying accidents in detail to order define effective interventions in both rural and urban areas.
The vast majority (74%) of fatalities occurred in collisions with other vehicles, and 1 out of 5 (21%) occurred in single bicycle crashes. Most often the bicyclists were struck by a passenger car (46%), and in these collisions AEB and AES were most often identified as effective interventions. AEB with bicyclist detection is currently relatively common (more than 40% of new sold cars in Sweden; Kullgren and Ydenius Citation2018) and may have large benefits. Currently, AEB systems aimed at avoiding and mitigating car-to-car and car-to-pedestrian collisions are covered in the European New Car Assessment Programme tests. Beginning in 2018, the European New Car Assessment Programme also includes AEB with bicyclist detection in their safety assessments. However, the effect on fatal accidents expected to occur in Sweden by 2030 would be limited assuming the current implementation rate. It is therefore important to speed up the implementation rate; for example, by highlighting such systems in consumer tests and in car fleet policies. Further, legislative actions or economic incentives, such as insurance discounts, might be relevant, possibly in combination with national scrapping programs. In total, it was estimated that 34 lives would be saved in a 25-year period with a 5-year faster implementation rate compared to the expected rate. It should also be noted that the prognoses were made specifically in relation to the Swedish market and therefore they may not apply to other regions of the world.
The results indicate that AEB systems with bicyclist detection on HGVs and LGVs have the potential to address several of the fatal accidents. In urban areas, a relatively large proportion of fatalities occurred in collisions with HGVs and buses, especially in accidents with right turning vehicles. It is difficult to address such accidents by interventions other than side radar; it is possible that warning systems linked to AEB might be relevant. It is important to further study whether such systems could be fitted on LGVs and HGVs.
In total 29% of the crashes occurred in twilight or darkness, which is in line with European data (Uittenbogaard et al. Citation2016). It is therefore recommended that vehicle sensors for AEB or AES be able to detect bicyclists in twilight and darkness. Furthermore, 1 in 4 accidents occurred under conditions that may be difficult for the sensors to detect. To be able to avoid similar accidents in the future, vehicle sensors should be able to detect bicyclists in heavy rain, fog, and blinding sunlight.
Studies of fatal accidents among bicyclists in Germany, The Netherlands, France, Italy, the UK, and Sweden during 2001 and 2012 have shown that more than 50% of all accidents occurred when the bicyclist crossed the road (Uittenbogaard et al. Citation2016). The findings in the present study indicated a slightly lower proportion (43%). Furthermore, it was shown that the most common accident scenario on rural roads was being struck while cycling along or at the side of the road and 43% were due to being struck from the side. One explanation might be that cyclists suddenly turn across the lane in front of a vehicle. It is important to design infrastructure that more effectively separates bicyclists from other traffic and also reduces the relative speed between the different road users. Hence, the 2 most effective countermeasures regarding the road infrastructure found in this study were separate paths for bicyclists outside the road as well as bicyclist crossings with speed calming measures. However, developing effective infrastructure countermeasures for bicyclists on the majority of rural roads in Sweden within a short time frame is not possible. A plan for prioritization among different locations is therefore recommended.
To achieve the traffic safety goals in Sweden, a number of safety performance indicators are used and followed over time (STA Citation2018a). Important indicators for VRUs are helmet use rates for bicyclists and the proportion of safe crossings for pedestrians, bicyclists, and mopeds. The study showed that 46% of nonhelmeted bicyclists would have survived if they had been wearing helmets. The present study confirmed that bicycle helmets are effective in reducing fatal head injuries among bicyclists (Olivier and Creighton Citation2016).
In 2017, the proportion of safe crossings for pedestrians, bicyclists, and mopeds was estimated to be 27% in built-up areas in Sweden (STA Citation2018a). It was also concluded that this proportion needs to be improved significantly until 2020 in order to reduce the number of road casualties according to national goals (STA Citation2018a). In the present study it was estimated that safe crossings for bicyclists had the potential to avoid 28% of fatal accidents.
For each accident, an in-depth investigation was performed to determine whether the accident would lead to a fatality if it occurred in 2030 or 2050. The predictive methodology has successfully been used by STA to manage national road safety work (Kullgren et al. Citation2017; Strandroth et al. Citation2012; STA 2016). Fatal accidents that were estimated to be avoided by 2030 or 2050 were removed from the accident sample for the next step, thus providing a population of future crashes that will require further actions.
The influence of postcrash interventions, such as rescue, hospital care, and rehabilitation, on fatality outcomes was not considered. The potential of improved vehicle front-end design for bicyclists was not considered because knowledge of its effectiveness is limited. A further limitation of the applied method is that it may be difficult to take trends into account, such as the recently increased popularity of e-bikes. Though all analyzed bicycle accidents involved traditional bikes, it has been reported that the average speed of e-bikes is higher than that of traditional ones (Dozza et al. Citation2016), which means a higher injury risk (Otte and Facius Citation2016). This may have some implications regarding how to generalize the results to the current accident situation.
To conclude, the most common accident scenarios on rural roads were being struck while cycling along or at the side of the road. On urban roads the majority occurred in intersections. Most accidents involved a passenger car, but HGVs were also common, especially in urban areas. The majority of the fatal accidents occurred in daylight conditions (73%). It was found that 46% of nonhelmeted bicyclists would have survived if they had been wearing helmets. It was estimated that nearly 60% of fatal accidents could have been prevented with advanced vehicle safety technologies, particularly AEB with bicyclist detection. With regard to interventions in the road infrastructure, separated paths for bicyclists and bicyclist crossings with speed calming measures were found to have the highest safety potentials. In total, 91% of bicyclist fatalities could potentially be prevented with known countermeasures.
It was estimated that it will take a long time until the relevant, potentially effective vehicle safety technologies will be widespread to reach the 91% reduction, which shows the importance of speeding up the implementation rate. A fast introduction of effective interventions in the road infrastructure is also necessary, preferably using a plan for prioritization among different locations.
It is important to note that the safety potentials shown in the present article would be achieved only with a systematic implementation of the recommended infrastructure countermeasures in the whole road network.
Supplemental Material
Download MS Word (27.5 KB)Related Research Data
References
- Dozza M, Bianchi Piccinini G, Werneke J. Using naturalistic data to assess e-cyclist behavior. Transp Res Part F Traffic Psychol Behav. 2016;41:217–226.
- Elvik R, Vaa T. The Handbook of Road Safety Measures. Amsterdam, Netherlands: Elsevier; 2004.
- European Transport Safety Council. Making Walking and Cycling on Europe’s Roads Safer. Brussels, Belgium: PIN Flash 29;2015.
- Johansson R. Vision Zero—implementing a policy for traffic safety. Saf Sci. 2008;47:826–831.
- Kullgren A, Rizzi M, Stigson H, Ydenius A, Strandroth J. The potential of vehicle and road infrastructure interventions in fatal pedestrian and bicyclist accidents on Swedish rural roads—what can in-depth studies tell us? Paper presented at: 25th ESV Conference; 2017; Detroit, MI.
- Kullgren A, Ydenius A. Update of ADAS fitment rates in Sweden. Paper presented at: RCAR Annual Meeting; 2018; Madrid, Spain.
- Lie A, Tingvall C, Krafft M, Kullgren A. The effectiveness of electronic stability control (ESC) in reducing real life crashes and injuries. Traffic Inj Prev. 2006;7:38–43.
- Malczyk A, Bende J. Circumstances of accidents between heavy trucks and bicyclists and implications for vehicular countermeasures. Paper presented at: 7th International Cycling Safety Conference; October 10–11, 2018; Barcelona, Spain.
- Ohlin M, Strandroth J, Tingvall C. The combined effect of vehicle frontal design, speed reduction, autonomous emergency braking and helmet use in reducing real life bicycle injuries. Paper presented at: International Cycling Safety Conference; 2014; Göteborg, Sweden.
- Olivier J, Creighton P. Bicycle injuries and helmet use: a systematic review and meta-analysis. Int J Epidemiol. 2016;46:278–292.
- Otte D, Facius T. Situation of pedelecs and comparison to conventional bicycles. Paper presented at: International Cycling Safety Conference; 2016; Bologna, Italy.
- Rizzi M. Towards a Safe System Approach to Prevent Health Loss Among Motorcyclists—The Importance of Motorcycle Stability as a Condition for Integrated Safety [PhD dissertation]. Gothenburg, Sweden: Chalmers University of Technology; 2016.
- Rizzi M, Kullgren A, Tingvall C. Injury crash reduction of low-speed autonomous emergency braking (AEB) on passenger cars. Paper presented at: IRCOBI Conference; 2014; Berlin, Germany.
- Rosen E, Kallhammer JE, Eriksson D, Nentwich M, Fredriksson R, Smith K. Pedestrian injury mitigation by autonomous braking. Accid Anal Prev. 2010;42:1949–1957.
- Rosen E, Sander U. The influence of impact speed estimation errors on pedestrian fatality risk curves. Paper presented at: 4th International Conference ESAR “Expert Symposium on Accident Research”; 2010; Hannover, Germany.
- Sternlund S, Strandroth J, Rizzi M, Lie A, Tingvall C. The effectiveness of lane departure warning systems—a reduction in real-world passenger car injury crashes. Traffic Inj Prev. 2017;18(2):225–229.
- Strandroth J. Identifying the Potential of Combined Road Safety Interventions – A Method to Evaluate Future Effects of Integrated Road and Vehicle Safety Technologies [PhD]. Gothenburg: Chalmers University of Technology; 2015.
- Strandroth J, Nilsson P, Sterlund S, Rizzi M, Krafft M. Characteristics of future crashes in Sweden—identifying road safety challenges in 2020 and 2030. Paper presented at: IRCOBI Conference; 2016; Malaga, Spain.
- Strandroth J, Sternlund S, Tingvall C, Johansson R, Rizzi M, Kullgren A. A new method to evaluate future impact of vehicle safety technology in Sweden. Stapp Car Crash J. 2012;56:497–509.
- Swedish Transport Administration. In-Depth Studies of Fatal Accidents Save Lives. Borlänge, Sweden: Author; 2005.
- Swedish Transport Administration. Översyn av etappmål för säkerhet på väg till 2020 och 2030, med en utblick mot 2050. [Review of Swedish road safety goals for 2020 and 2030, with a view on 2050]. 2016. Report Number 109 Borlänge, Sweden: Swedish Transport Administration.
- Swedish Transport Administration. Analys av trafiksäkerhetsutvecklingen 2017. Målstyrning av trafiksäkerhetsarbetet mot etappmålen 2020. [Analysis of the developments in troad traffic safety 2017. Management of road traffic safety actions towards the milestone targets 2020]. Borlänge, Sweden: Author; 2018a.
- Swedish Transport Administration. Gemensam inriktning för säker trafik med cykel och moped. [Common focus for safe traffic with bicycle and moped]. Borlänge, Sweden: Author; 2018b.
- Talbot R, Reed S, Christie N, Barnes J, Thomas P. Fatal and serious collisions involving pedal cyclists and trucks in London between 2007 and 2011. Traffic Inj Prev. 2017;18:657–665.
- Uittenbogaard J, den Camp O, van Montfort S. Overview of main accident parameters in car-to-cyclist accidents for use in AEB-system test protocol. Paper presented at: International Cycling Safety Conference; 2016; Bologna, Italy.