
 ?Mathematical formulae have been encoded as MathML and are displayed in this HTML version using MathJax in order to improve their display. Uncheck the box to turn MathJax off. This feature requires Javascript. Click on a formula to zoom.
Abstract
Objective: The objectives of the present article were to (a) describe the main characteristics of bicycle crashes with regard to the road environment, crash opponent, cyclist, and crash dynamics; (b) compare individuals who describe their health after the crash as declined with those who describe their health as not affected; and (c) compare the number of injured cyclists who describe their health as declined after the crash with the predicted number of permanent medical impairments within the same population.
Methods: A sample of individuals with specific injury diagnoses was drawn from the Swedish Traffic Accident Data Acquisition (STRADA) database (n = 2,678). A survey form was used to collect additional information about the crash and the health-related outcomes. The predicted number of impaired individuals was calculated by accumulating the risk for all individuals to sustain at least a 1% permanent medical impairment, based on the injured body region and injury severity.
Results: Nine hundred forty-seven individuals (36%) responded, of whom 44% reported declined health after the crash. The majority (68%) were injured in single bicycle crashes, 17% in collisions with motor vehicles, and 11% in collisions with another cyclist or pedestrian. Most single bicycle crashes related to loss of control (46%), mainly due to skidding on winter surface conditions (14%), followed by loss of control during braking (6%). There was no significant difference in crash distribution comparing all crashes with crashes among people with declined health. The predicted number of impaired individuals (n = 427) corresponded well with the number of individuals self-reporting declined health (n = 421).
Conclusions: The types of crashes leading to health loss do not substantially differ from those that do not result in health loss. Two thirds of injuries leading to health loss occur in single bicycle crashes. In addition to separating cyclists from motorized traffic, other preventive strategies are needed.
Keywords:
Introduction
Bicycling for transportation is associated with health benefits for the individual as well as environment (Hartog et al. Citation2011). However, safety concerns are often given as a reason not to cycle (Manaugh et al. Citation2017); indeed, cyclists are vulnerable road users (VRUs) who have higher risk of injury in case of a crash compared to car occupants. Compared to car occupants, Swedish cyclists have been reported to have 10 times higher fatality risk and 20 times higher risk for hospital-reported injury per million kilometers traveled (Nilsson et al. Citation2017).
Crashes involving motor vehicles have been reported to account for a majority of fatal bicyclist crashes (Bil et al. Citation2016). However, crashes involving motor vehicles are not the most common crash type among nonfatally injured cyclists. Among hospital-reported cyclist casualties in Vancouver and Toronto, collisions with motor vehicles accounted for 34% (Cripton et al. Citation2015). Among Swedish hospital-reported crashes, only 13% involved a motor vehicle, whereas almost 80% were single bicycle crashes (Rizzi et al. Citation2013).
Injuries from road traffic crashes can be defined and measured in different ways. In Sweden, permanent medical impairment (PMI) is used to define serious injuries in the road transport system. The risk of impairment for different body regions and Abbreviated Injury Scale (AIS) levels is based on an impairment scale used by Swedish insurance companies (Malm et al. Citation2008). This approach makes it possible to directly translate a risk into a predicted outcome, because it normally takes 3–5 years to determine a final degree of medical impairment. The degree of impairment is based on the functional reduction caused by the injury and independent of cause and without regard to the injured person’s occupation, hobbies, or other special circumstances (Malm et al. Citation2008). However, further research is needed to determine to what extent the predicted PMI may correspond to a subjective experience of loss of health.
Loss of health from road traffic injuries can also be evaluated by taking into account effects on health-related quality of life (HRQoL). Among cyclists, leg injuries have been associated with self-reported long-term problems in HRQoL (Nhac-Vu et al. Citation2014; Ohlin et al. Citation2017). Ohlin et al. (Citation2017) showed that problems in HRQoL were reported by almost 80% of cyclists with a leg injury. Further, injuries from road traffic crashes can affect other areas in life, such as a person’s ability to work. In a recent Swedish study among people seeking health care after a bicycle crash, it was shown that injuries to the spine and back, traumatic brain injuries, and injuries to the leg showed highest risk for sickness absence ≥90 days (Ohlin et al. Citation2018).
Nhac-Vu et al. (Citation2014) and Ohlin et al. (Citation2017, Citation2018) provided new insights into the long-term health consequences of bicyclists’ injuries. However, at the present stage, there is still limited research on crash circumstances in crashes involving these nonfatal injuries with a high risk of long-term health consequences, thus limiting the possibility to develop effective countermeasure to address such injuries.
The aim of this study was to describe crash characteristics and circumstances in crashes where cyclists sustained injuries with a high risk of health loss. More specifically, the objectives of the present article were to
Describe the main characteristics of bicycle crashes in which cyclists sustained injuries with a high risk of health loss with regard to the road environment, crash opponent, cyclist, and crash dynamics, allowing for comparison with all hospital-reported bicycle crashes that occurred during the same time period.
Compare individuals who describe their health after the crash as declined with those who describe their health as not affected, with regard to the crash scenarios and other crash characteristics/circumstances as well as injury consequences.
Compare the number of injured cyclists who describe their health as declined after the crash with the predicted number of PMIs within the same population.
Methods
Study design
This cross-sectional study combined hospital-reported data from the Swedish Traffic Accident Data Acquisition (STRADA) database with a questionnaire obtaining more detailed information regarding the crash and consequences of injuries. STRADA is a database with national coverage containing information from police records and emergency care hospitals regarding road traffic crashes in Sweden. The present study was based solely on hospital-reported bicycle crashes, because many bicycle crashes are underreported by the police (Rizzi et al. Citation2013).
A sample of individuals (aged 15 years of age or older) injured in bicycle crashes between January 2013 and April 2017 was drawn from STRADA. The sample was based on specific diagnoses that are common among cyclists reporting problems in HRQoL and cyclists with sickness absences ≥180 days after a bicycle crash (Ohlin et al. Citation2017, Citation2018). On a general level, these diagnoses included fractures to the hip and upper leg, fractures to the lower leg and ankle, fractures of the upper arm, fractures and sprains of the shoulder, traumatic brain injuries (excluding mild concussion), and fractures and strains to the spine. Table A1 (see online supplement) shows detailed information on the International Classification of Diseases, 10th Revision diagnoses and the sampling process (WHO Citation1993).
Table 1. Number of included diagnoses in STRADA, number of individuals receiving the survey, response rate, number of people with declined health, number of predicted PMI, and percentage who continued cycling to the same extent divided by injured body region.
A total of 7,641 injured cyclists included in STRADA had at least one of such diagnosis. These diagnoses were grouped into different body regions (hip and upper leg, lower leg and ankle, shoulder and upper arm, spine and back, traumatic brain injury, multiple). Five hundred individuals with injuries from each body region were randomized for inclusion, with the exception of traumatic brain injuries, for which all 325 injured persons were included. Among the randomized sample (n = 2,825), postal information was available for 2,678 individuals who were invited to participate in the study. The questionnaires, together with an explanatory letter, were sent in late November/early December 2017 and subsequent reminders were sent in mid-January 2018.
The questionnaire contained 6 different sections with questions related to traffic habits, personal circumstances, road environment, crash sequence, factors contributing to the crash, and injuries. In total, the questionnaire contained 39 multiple-choice questions and most questions included a free-text option. In one specific question, respondents were asked to explain in their own words how the crash occurred and how they were injured. Further details regarding the questionnaire can be obtained from the corresponding author. Ethics approval for the study was obtained by the local ethical review board in Gothenburg, Sweden (dnr 679-17).
Data analysis
Objective 1
Crashes were classified based on the crash circumstances; for example, depending on the collision opponent (if any), road environment, and other circumstances (e.g., road surface condition, braking prior to collision, etc.). Crash types involving passenger cars were grouped as illustrated in Figure A1 (see online supplement). Bicycle lanes (i.e., a portion of the roadway delimited by stripes or colored pavement for the preferential or exclusive use of bicyclists) were not considered as designated bicycle infrastructure. Because sampling was made from injury groups of different sizes, the crash types were weighted to match how the injuries were represented in STRADA. This was done by dividing the number of included cases for each body region by the corresponding number of that body region in STRADA from which the sample was drawn, multiplied by the inverse proportion of included cases (see Table A1).
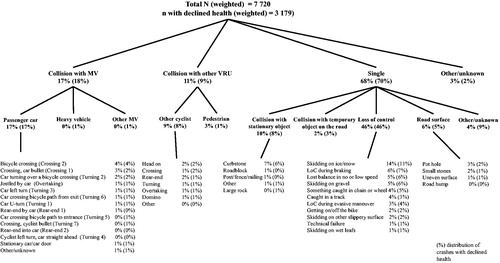
Figure 1. Grouping of weighted crash types and specific characteristics. MV = motor vehicle, VRU = vulnerable road user, LoC = loss of control. Weighting based on total N = 947 according to multiplication factors in Table A1.
A comparison between the crashes included in the study and all hospital-reported bicycle crashes that occurred during the same time period was conducted. This was done in order to understand whether and how the study population differs compared to all bicycle crashes reported to emergency care hospitals during the same time period. Information on age, sex, type of crash, and helmet use was obtained for all crashes reported in STRADA that occurred between January 2013 and April 2017, including the crashes among the present study population.
Objective 2
A question regarding how respondents describe their present health status compared to before the crash was used to identify people with and without declined health after the crash. Those reporting “much poorer” (n = 99) or “poorer” (n = 322) health were categorized as “individuals with declined health” (n = 421). Those reporting “about the same” (n = 467) or “better” (n = 44) health or who did not respond to the question (n = 15) were categorized as “individuals with non-affected health” (n = 526). Comparisons between these 2 groups were made regarding traffic habits, personal circumstances related to the crash, road environment, crash type, injured body region, sickness absence, need for rehabilitation, and whether the injury kept them from continuing to cycle. A separate analysis was carried out regarding the speed of the motor vehicle as reported by the cyclist.
Objective 3
The predicted number of impaired individuals (PMI) was calculated by accumulating the risk for all individuals to sustain at least a 1% permanent medical impairment compared to the number of individuals rating their health as declined after the crash (n = 421).
The risk of PMI (RPMI) was developed to estimate the risk of a patient suffering a certain level of PMI based on the injury location and AIS severity (Malm et al. Citation2008). The risk is derived from risk matrices based on the location and severity of the injury for 1%+ and 10%+ medical impairment (see Table A2, online supplement). RPMI can refer to specific injuries (body regions) but can also be calculated for one individual with several injuries (overall RPMI) according to EquationEq. (1)(1)
(1) , where n is the number of injured body regions and risk is the risk for each body region according to the risk matrices in Table A2. In this study, both approaches were used. In cases where the individual had more than one of the included diagnoses (i.e., belonged to the “multiple” category), that person’s overall RPMI was used. The predicted number of impaired individuals within the population was calculated by accumulating all individuals’ risks according to EquationEq. (2)
(2)
(2) , where m is the total number of individuals. An illustrative example of this could be 2 individuals, one with an AIS 3 cervical spine injury (RPMI1+ = 80%) and the other with an AIS 2 lower extremity injury (RPMI 1+ = 50%). Together these will result in 0.8 + 0.5 = 1.3 PMI.
(1)
(1)
(2)
(2)
Table 2. Grouped speed of the motor vehicle as reported by the cyclist and percentage with declined health.
Finally, a comparison was made between respondents and nonrespondents with regard to age, gender, crash type, year of crash, Maximum Abbreviated Injury Scale, and overall RPMI1+ and 10+.
In all comparisons, chi-square tests with a 95% significance level were used to test for statistical significance. For example, the difference in distribution of gender among people with declined health and people without declined health was tested in a 2 × 2 contingency table with chi-square statistics in Excel. The P value is presented when a statistically significant difference is found.
Results
Sample overview
In total, 964 individuals answered the survey, and 947 were included in the analysis. The overall response rate was 36% and did not differ significantly across the different injured body regions (). As many as 94% reported cycling regularly (at least once a week). Most crashes occurred during leisure-time cycling (48%) or cycling to or from work (38%; Table A3, see online supplement). A majority of crashes occurred during the daytime and, most often, the traffic environment at the time of the crash was perceived as calm. Most crashes occurred on shared bicycle paths; that is, paths shared by cyclists and pedestrians where motor vehicles are not allowed (35%). In total 53% of crashes occurred on some type of designated bicycle infrastructure (e.g., bicycle paths and lanes), 24% occurred on local streets, and 15% occurred on rural roads. Fifty-one percent reported a sickness absence after the crash, and as many as 64% needed some type of rehabilitation (e.g., physical therapy or medical treatment) for their injury. Table A3 displays further crash-related variables, divided by individuals with declined health and individuals with non-affected health.
Objective 1: Crash scenarios, crash characteristics, and comparison with all bicycle crashes
shows the weighted schematic illustration of the crash scenarios, including the distribution of crashes for people with declined health. The majority (68%) were single bicycle crashes, 17% were collisions with motor vehicles, and 11% were collisions with another cyclist or pedestrian. Of the crashes with motor vehicles, almost all involved passenger cars.
The most common type of crash involving a passenger car occurred on a bicycle crossing (4% of all crashes, crossing 2; see Figure A1). The second most common were crashes occurring in 4-way junctions (3% of all crashes, crossing 1) and crashes where the car crossed a bicycle crossing while turning (2%, turning 2). These 3 crash types accounted for 55% of all crashes involving a passenger car. Forty-nine percent of crashes involving motor vehicles occurred while the cyclist was cycling on designated cycling infrastructure (e.g., on bicycle crossings or bicycle paths).
Collisions with other VRUs (11%) were mostly collisions involving another cyclist (9%), most commonly in a head-on crash (3%).
Most of the single bicycle crashes were related to some type of loss of control (46%), mainly due to skidding on winter surface conditions (14%), followed by loss of control during braking (6%) and loss of balance at no or low speed (5%) and skidding on gravel (5%). Collisions with stationary objects mainly involved curbstones where falls occurred both while cycling into a curbstone (e.g., trying to cross it or unintentionally drifting into the curbstone) or descending across a curbstone. Six percent of the crashes occurred due to road surface conditions; for example, potholes or uneven surface.
The analysis showed no statistically significant differences in the crash distribution comparing all crashes with crashes among people with declined health.
Table A4 (see online supplement) shows the distribution of age, sex, crash type, and helmet use for all crashes reported in STRADA during January 2013 and April 2017, compared to the crashes included in the present study. This comparison showed that the present study included a higher proportion of people above the age of 55, as well as a lower proportion of people 15–25 years of age. There is also a slight overrepresentation of women and underrepresentation of men compared to STRADA (P = .02). Compared to single bicycle crashes, crashes involving motor vehicles are also overrepresented in the present study (19% compared to 11%; P < .01). Further, the rate of helmet use was slightly higher in the study population (47% compared to 40% in STRADA; P = .03). The mean overall RPMI1+ was 46% in the study population, compared to 19% in STRADA, which indicates that more severe injuries were included in the present study.
Objective 2: Comparison between individuals with declined health and individuals with non-affected health
Overall, 44% of respondents experienced declined health after the crash. However, this number differed between crash types. Seventy-eight percent experienced declined health after a collision with a heavy vehicle (i.e., a heavy goods vehicle or bus), compared to 45% among individuals hit by a passenger car. In a collision with another VRU, it was more common to experience declined health if the opponent was another bicycle (43%) compared to a pedestrian (35%). In single bicycle crashes, a large share (68%) experienced declined health after a collision with a temporary object on the road. In 12 of these 19 cases, the temporary object was related to some type of roadwork. However, none of these results were statistically significant.
Fifty percent of the cyclists reported the speed of the motor vehicle as <30 km/h (). Only in one case did the respondent describe having been overrun, not hit, by a motor vehicle. Results indicate a linear increase in percentage of participants with declined health with increased speed of the motor vehicle, from 21% at speeds <10 m/h to 67% at speeds >40 km/h.
Spine and back injuries had a lower proportion of declined health compared to all other body regions (P < .01). In addition, those with declined health more often reported sickness absence as well as a need for rehabilitation (P < .01; see Table A5, online supplement). Forty-three percent of individuals experiencing declined health continued cycling to the same extent after the crash, compared to 74% among those whose health had not been affected (P < .01; ). The distribution of injured body regions in shows that those with upper body (shoulder and upper arm, spine and back) injuries more often continued cycling compared to those with leg or head injuries or those who suffered multiple injuries (P < .01).
Objective 3: Predicted number of individuals with permanent medical impairment
The predicted number of impaired individuals (PMI1+) was calculated to be 427. This figure corresponded rather well to the number of individuals experiencing declined health (n = 421). The predicted number of impaired individuals was most accurate among those with lower leg injuries and least accurate among those with traumatic brain injuries ().
Discussion
This study combined Swedish hospital-reported data with a questionnaire obtaining detailed information regarding crash characteristics and injury outcomes in crashes in which bicyclists sustained injuries with a high risk of health loss. Results showed that a slightly larger share of motor vehicles were involved in the crashes included in the present study, compared to all injured cyclists in Sweden during the same period. This finding is in line with previous research indicating that crashes involving motor vehicles result in more severe injuries among cyclists (Cripton et al. Citation2015; Hamann and Peek-Asa Citation2013). However, it was shown that the crash distribution did not significantly differ between those with declined health and those whose health was not affected. This indicates that the types of crashes leading to health loss do not substantially differ from those that do not result in health loss.
According to the Vision Zero design principles, VRUs should not be exposed to motorized vehicles at speeds exceeding 30 km/h in order to avoid fatal injuries (Johansson Citation2009). However, a recent study has suggested that 30 km/h might not be sufficiently low to prevent severe injuries among pedestrians (Kröyer Citation2015). Results from the present study suggest that this hypothesis might be correct for cyclists as well, because in 50% of crashes with motor vehicles the speed of the motor vehicle was reported to be below 30 km/h. Because the cyclist who was injured in the crash reported this information, it may not be as reliable as an objective measure of speed.
Though a slightly higher share of crashes involving motor vehicles was found when comparing the present sample with all crashes during the same period, the majority (68%) of crashes were still single bicycle crashes, which is slightly lower but similar to other studies of bicycle crashes in Sweden reported in STRADA. For example, Rizzi et al. (Citation2013) reported that 77% of all bicycle crashes in Sweden from 2002 to 2013 were single bicycle crashes. Similarly, Niska and Eriksson (Citation2013) reported that 78% of bicycle crashes were single bicycle crashes. In The Netherlands, 50% of the total burden of serious road traffic injuries (Maximum Abbreviated Injury Scale 2+) in 2011 were attributed to bicycle crashes without motor vehicle involvement, which is an increase compared to 30% in 2000 (Weijermars et al. Citation2016). Similar to The Netherlands, among injured cyclists admitted to hospital following a bicycle crash in Victoria, Australia, 56% were reported as being injured in single bicycle crashes (Beck et al. Citation2016). Compared to other countries, Sweden has a higher share of single bicycle crashes. Recent studies of fatal bicycle crashes in Australia and The Netherlands show an increasing trend of fatal bicycle crashes without motor vehicle involvement (Boufous and Olivier Citation2016; Schepers et al. Citation2017). Clearly, a focus on improving safety for cyclists in single-vehicle scenarios is needed.
Many of the single bicycle crashes were caused by ice or snow on the road surface. This is in line with a previous study from Sweden, in which 44% of single bicycle crashes were reported to be related to poor road maintenance (e.g., roads covered with ice or snow, or rolling gravel; Niska and Eriksson Citation2013). A large share of single bicycle crashes could therefore be prevented with effective deicing and plowing of bicycle infrastructure. In the present study, loss of control during braking was also found to be rather common, which suggests that antilock braking systems for bicycles could improve safety. Many of the single bicycle crashes were related to infrastructure, mainly to curbstones. The visibility of bicycle infrastructure is an important aspect in single bicycle crashes (Schepers and den Brinker Citation2011). Further, many injuries resulted from falls at low speeds or while mounting or dismounting the bicycle (14% of single crashes). For falls that occur while mounting or dismounting the bicycle, improved stability of the bicycle can be beneficial (e.g., a tricycle), and the mounting technique used by the cyclist is also of importance (Twisk et al. Citation2017).
The predicted number of PMIs corresponded well to the number of respondents with declined health after the crash. Medical impairment is based on the functional reduction caused by an injury and does not take into account other circumstances—for example, occupation or hobbies. However, despite the differences in how medical impairment defines health loss, compared to a person’s own experience, RPMI seems to perform well in predicting the number of people experiencing loss of health, at least in a population with a high overall RPMI1+ (the mean overall RPMI1+ in the present study was 46%, compared to 19% in STRADA). Because the predicted number of PMIs is simply a sum of many individual risks, it can never identify specific individuals who will have a PMI. Therefore, it is well understood that the predicted number of PMIs is a fictive population, rather than actual individuals. Therefore, the present study could not verify whether the respondents with declined health would also have PMI. This remaining question of how degree of medical impairment correlates with perceived health loss should be investigated in future studies.
There are some limitations that should be considered. Because among those included in the sample the time since the injury varied, some people were likely still recovering. If the percentage of people reporting declined health had been the same among those with a more recent injury as among those injured 4–5 years earlier, a total of 406 people (instead of 421) would have reported declined health. Further, the response rate was relatively low (36%) and was lower among those aged ≤25 years (18%) and those whose crashes occurred during 2013–2014 (28%; Table A6, see online supplement). However, the response rate was similar for men and women (35 and 37%, respectively) and across different inured body regions (). See Table A7 (online supplement) for further details and comparison between respondents and nonrespondents. As Table A8 (see online supplement) shows, collisions with motor vehicles are less common (16 vs. 19%) and single bicycle crashes are more common (76 vs. 70%) for nonrespondents and respondents, respectively. This indicates that had the response rate been 100%, a slightly larger share of crashes would be single bicycle crashes.
In conclusion, the present article identified a number of important issues to be considered by future research as well as by road authorities. Though bicycle safety has traditionally focused on helmets and on separating cyclists from motorized traffic, this study highlights that a large share of single bicycle crashes led to loss of health. Therefore, other preventive strategies are needed as well.
Supplemental Material
Download MS Word (163.5 KB)Additional information
Funding
Related Research Data
References
- Beck B, Stevenson M, Newstead S, et al. Bicycling crash characteristics: an in-depth crash investigation study. Accid Anal Prev. 2016;96:219–227.
- Bil M, Bilova M, Dobias M, Andrasik R. Circumstances and causes of fatal cycling crashes in the Czech Republic. Traffic Inj Prev. 2016;17(4): 394–399. doi:10.1080/15389588.2015.1094183
- Boufous S, Olivier J. Recent trends in cyclist fatalities in Australia. Inj Prev. 2016;22:284–287.
- Cripton PA, Shen H, Brubacher JR, et al. Severity of urban cycling injuries and the relationship with personal, trip, route and crash characteristics: analyses using four severity metrics. BMJ Open. 2015;5:e006654.
- Hamann C, Peek-Asa C. On-road bicycle facilities and bicycle crashes in Iowa, 2007–2010. Accid Anal Prev. 2013;56:103–109.
- Hartog JJ, Boogaard H, Nijland H, Hoek G. Do the health benefits of cycling outweigh the risks? Cien Saude Colet. 2011;16:4731–4744.
- Johansson R. Vision Zero—implementing a policy for traffic safety. Saf Sci. 2009;47:826–831.
- Kröyer HRG. Is 30km/h a “safe” speed? Injury severity of pedestrians struck by a vehicle and the relation to travel speed and age. IATSS Research. 2015;39:42–50.
- Malm S, Krafft M, Kullgren A, Ydenius A, Tingvall C. Risk of permanent medical impairment (RPMI) in road traffic accidents. Ann Adv Automot Med. 2008;52:93–100.
- Manaugh K, Boisjoly G, El-Geneidy A. Overcoming barriers to cycling: understanding frequency of cycling in a University setting and the factors preventing commuters from cycling on a regular basis. Transportation. 2017;44(4): 871–884. doi:10.1007/s11116-016-9682-x
- Nhac-Vu HT, Hours M, Chossegros L, Charnay P, Tardy H, Martin JL, ... Laumon B. Prognosis of outcome in adult survivors of road accidents in France: one-year follow-Up in the ESPARR cohort. Traffic Inj Prev. 2014;15(2): 138–147. doi:10.1080/15389588.2013.804180
- Nilsson P, Stigson H, Ohlin M, Strandroth J. Modelling the effect on injuries and fatalities when changing mode of transport from car to bicycle. Accid Anal Prev. 2017;100: 30–36. doi:10.1016/j.aap.2016.12.020
- Niska A, Eriksson J. Statistik över cyklisters olyckor: Faktaunderlag till gemensam strategi för säkrare cykling [Cycling accident statistics - Background information to the common policy strategy for safe cycling]. VTI Report 801. Linköping: Statens väg- och transportforskningsinstitut. 2013. Available at: http://vti.diva-portal.org/smash/get/diva2:694821/FULLTEXT01.pdf. Accessed October 15, 2018.
- Ohlin M, Berg HY, Lie A, Algurén B. Long-term problems influencing health-related quality of life after road traffic injury—differences between bicyclists and car occupants. J Transp Health. 2017;4:180–190.
- Ohlin M, Kjeldgård L, Elrud R, Stigson H, Alexanderson K, Friberg E. Duration of sickness absence following a bicycle crash, by injury type and injured body region: a nationwide register-based study. J Transp Health. 2018;9:275–281.
- Rizzi M, Stigson H, Krafft M. Cyclist injuries leading to permanent medical impairment in Sweden and the effect of bicycle helmets. Paper presented at: International Research Council on the Biomechanics of Injury (IRCOBI); September 11–13, 2013; Gothenburg, Sweden.
- Schepers P, den Brinker B. What do cyclists need to see to avoid single-bicycle crashes? Ergonomics. 2011;54:315–327.
- Schepers P, Stipdonk H, Methorst R, Olivier J. Bicycle fatalities: trends in crashes with and without motor vehicles in The Netherlands. Transp Res Part F Traffic Psychol Behav. 2017;46:491–499.
- Twisk DAM, Platteel S, Lovegrove GR. An experiment on rider stability while mounting: comparing middle-aged and elderly cyclists on pedelecs and conventional bicycles. Accid Anal Prev. 2017;205:109–116.
- Weijermars W, Bos N, Stipdonk H. Health burden of serious road injuries in The Netherlands. Traffic Inj Prev. 2016;17:863–869.
- World Health Organization [WHO]. International Statistical Classification of Diseases and Related Health Problems, Tenth Revision (ICD-10). Geneva, Switzerland; 1993.