
 ?Mathematical formulae have been encoded as MathML and are displayed in this HTML version using MathJax in order to improve their display. Uncheck the box to turn MathJax off. This feature requires Javascript. Click on a formula to zoom.
Abstract
Objective: Systems that can warn the driver of a possible collision with a vulnerable road user (VRU) have significant safety benefits. However, incorrect warning times can have adverse effects on the driver. If the warning is too late, drivers might not be able to react; if the warning is too early, drivers can become annoyed and might turn off the system. Currently, there are no methods to determine the right timing for a warning to achieve high effectiveness and acceptance by the driver. This study aims to validate a driver model as the basis for selecting appropriate warning times. The timing of the forward collision warnings (FCWs) selected for the current study was based on the comfort boundary (CB) model developed during a previous project, which describes the moment a driver would brake. Drivers’ acceptance toward these warnings was analyzed. The present study was conducted as part of the European research project PROSPECT (“Proactive Safety for Pedestrians and Cyclists”).
Methods: Two warnings were selected: One inside the CB and one outside the CB. The scenario tested was a cyclist crossing scenario with time to arrival (TTA) of 4 s (it takes the cyclist 4 s to reach the intersection). The timing of the warning inside the CB was at a time to collision (TTC) of 2.6 s (asymptotic value of the model at TTA = 4 s) and the warning outside the CB was at TTC = 1.7 s (below the lower 95% value at TTA = 4 s). Thirty-one participants took part in the test track study (between-subjects design where warning time was the independent variable). Participants were informed that they could brake any moment after the warning was issued. After the experiment, participants completed an acceptance survey.
Results: Participants reacted faster to the warning outside the CB compared to the warning inside the CB. This confirms that the CB model represents the criticality felt by the driver. Participants also rated the warning inside the CB as more disturbing, and they had a higher acceptance of the system with the warning outside the CB. The above results confirm the possibility of developing wellsaccepted warnings based on driver models.
Conclusions: Similar to other studies’ results, drivers prefer warning times that compare with their driving behavior. It is important to consider that the study tested only one scenario. In addition, in this study, participants were aware of the appearance of the cyclist and the warning. A further investigation should be conducted to determine the acceptance of distracted drivers.
Introduction
In 2014, more than 2,000 cyclists died in the European Union due to road accidents, which accounts for 8% of all road fatalities (European Commission Citation2015). In addition, compared to the total road fatalities in Europe, which have been decreasing over the years (from 2001 to 2012 there was a reduction of 13,000 road fatalities), the percentage of cyclist fatalities increased during the same time period (Op den Camp et al. Citation2016). The European Union also reported that from 2010 to 2013 the number of cyclist fatalities decreased by only 3%, substantially less compared to the reduction of 18% in total road fatalities (European Commission Citation2015).
For this reason, in the past few years, many European projects have devoted their efforts to trying to identify the most relevant scenarios related to cyclist fatalities. In 2014, the European project “Assessment Methodologies for Forward Looking Integrated Pedestrian and Further Extension to Cyclists Safety” (ASPECSS) found that around 75% of all cyclist fatalities occur at junctions (Rodarius et al. Citation2014). Following ASPECSS, the “Cyclist AEB Testing System” (CATS) and “Proactive Safety for Pedestrians and Cyclists” (PROSPECT) projects identified that around 42–52% of causalities occurred when the vehicle was driving straight and the cyclist crossed from the near or far side (Op den Camp et al. Citation2016; Wisch et al. Citation2016).
Car manufacturers and consumer organizations have also focused on aiming to reduce the number of cyclist fatalities on the road by developing safety solutions and protocols. New active safety systems have been developed that warn the driver and trigger an evasive manoeuvre in case of a potential collision with a cyclist crossing the road (AUDI AG Citation2018; Jaguar Land Rover Citation2018; Toyota Motor Corporation Citation2017). The European New Car Assessment Programme (Citation2017) also has focused on reducing the high number of cyclist fatalities by adding new protocols into their program: Cyclist crossing from the near side and cyclist traveling ahead of the car in the same direction. The protocols are used to test evasive systems (such as autonomous emergency braking) as well as warning systems (such as forward collision warning, FCW). Contrary to autonomous emergency braking, which triggers automatically when the driver does not take any evasive maneuver, FCW depends on the driver taking action to avoid the accident, and the timing of the warning can affect the reaction and acceptance of the driver. As an example, Jamson et al. (Citation2008) found that for more aggressive drivers, warnings were better accepted when they were adapted to the driver’s driving style.
Many studies have highlighted the benefit of FCW systems (Bargman et al. Citation2017; Cicchino Citation2017; Fitch et al. Citation2008). Unfortunately, the timing for the warnings varied significantly in each study. Large et al. (Citation2018) found that FCW at a time to collision (TTC) of 5 s had greater safety benefits and acceptance than warnings at a TTC of 2 s. Abe and Richardson (Citation2006) tested the effect of warnings at TTCs of 2.2 and 1.7 s and found that the latter scored higher levels of trust. In Aust et al. (Citation2013), although the warning time depended on headway time and speed of the participant, it was concluded that warnings at a TTC of around 1.2 s had faster reactions than warnings at a TTC of approximately 2 s. Although previous research has presented the benefits of FCWs, there are no agreed-upon objective criteria used to select the warning times.
There have been attempts to set warning times based on objective criteria. McGehee et al. (Citation2002) calculated the warning time based on the speed and deceleration of the lead and ego vehicles as well as a time delay accounting for the reaction time of the driver. Although they found a safety benefit when the warning was set at an early TTC, acceptance of the system was not analyzed. In addition, the formula used by McGehee et al. (Citation2002) depends on the performance of the sensor response and the reaction time needed for the driver to take an evasive maneuver; that is, not considering driver acceptance levels. In Winkler et al. (Citation2016), the time of the warnings was selected by the drivers. Winkler et al. (Citation2016) presented 2-stage warnings for slow-moving traffic. Each stage had multiple warnings and participants had to choose the best timing. Although this approach considers the drivers’ preference for the warning time, the time intervals for each stage were not based on specific criteria.
The present study uses a comfort boundary (CB) model to set the timings for an FCW system. The term comfort boundary was defined as the moment in time when a driver would brake (brake onset) when a cyclist is crossing the road. The study is focused on one of the scenarios with a higher number of cyclist fatalities: a cyclist crossing the road (Boda et al. Citation2018). Two warnings were selected for the present study: One inside the CB and one outside the CB. The present study estimated the acceptance of attentive drivers toward the warnings. In the current study, acceptance is defined as a post hoc judgment measure toward the system (after experiencing the system), contrary to acceptability, which is the a priori measurement (before experiencing the system; Merat et al. Citation2016; Schade and Schlag Citation2003). It was hypothesized that the warning outside the CB would be better accepted because it would be considered a critical situation (true positive) compared to the warning inside the CB, where the attentive driver would consider that the situation is still under control (false positive). Attentive drivers were selected for the current study to determine the effect that different warning times can have in potential false-positive scenarios.
The comfort boundary model
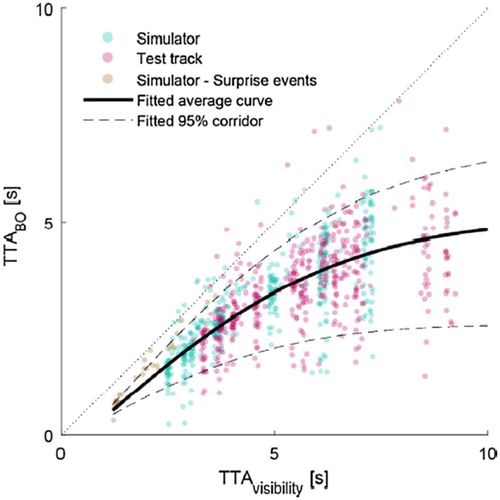
Boda et al. (Citation2018) analyzed the brake onset of drivers when encountering a cyclist crossing the road in an intersection, as presented in . Participants were instructed to drive and behave in the same way they would during normal traffic. The study was conducted in a driving simulator and in a test track using the same scenario. Boda et al. (Citation2018) concluded that the moment in time when the cyclist first becomes visible to the driver (time to arrival visibility, ), had the most significant effect on the brake onset of the driver. The model that describes the brake onset dependent on the time the cyclist is visible is presented in . For the present study, the warning inside the CB was selected as the asymptotic value at time to arrival (TTA) = 4 s, and the warning outside the CB was chosen as the value below the lower 95% value at TTA = 4 s.
Figure 1. Cyclist crossing scenario. The distance d represents the moment the cyclist becomes visible until the cyclist reaches the intersecting point with the car. For the present study, the distance d was 17 m.
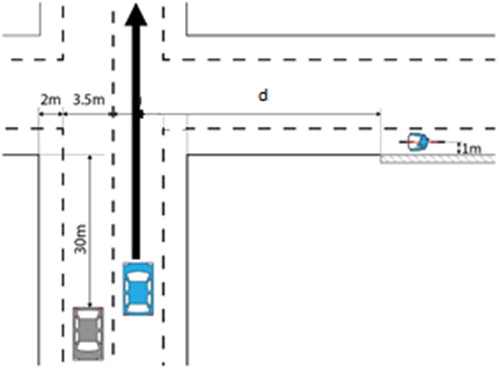
Figure 2. Comfort boundary model developed by Boda et al. (Citation2018). The study was conducted in a simulator on a test track. It was concluded that brake onset depends on the time the cyclist becomes visible (TTAvisibility).
Method
Test track and simulator setup
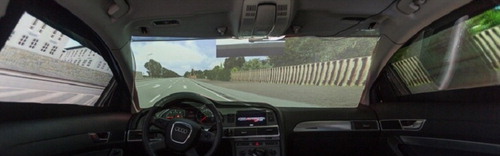
The present study was part of the European project PROSPECT, a consortium of 19 academic and industrial partners. Two separate experimental methodologies were tested (one developed by Toyota Motor Europe and one developed by AUDI AG) with the same participants. The results and discussion presented in this article relate only to the Toyota Motor Europe methodology. The study was conducted on AUDI AG’s test track. The test track is an 877-m track with a 285-m straight segment with one intersection, as shown in . The study was conducted using a vehicle-in-the-loop system. The vehicle-in-the-loop system is a virtual reality simulator coupled within a real car. The participant receives vestibular, kinaesthetic, and auditory feedback from driving a real car while perceiving the simulated environment from the traffic simulation ().
Figure 3. Simulated scenario used based on the AUDI AG test track.
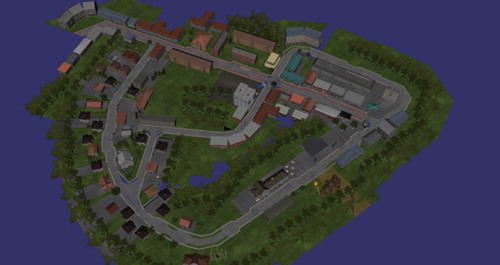
Figure 4. Vehicle-in-the-loop system. Participants drive a real car that is fitted with screens on which a simulated environment is projected.
Participants
All participants were students and/or employees of the Bundeswehr University Munich. Participants were recruited via email and were paid 10.00 euros for their participation. Thirty-nine participants took part (32 males, 7 females). Participants were randomly allocated into 1 of the 2 groups (warning inside the CB or warning outside the CB). The mean age was 23.65 years old (SD = 3.27) for the warning inside the CB group and 24.84 years (SD = 5.93) for the warning outside the CB group. For both groups, the median of driving frequency per week was 3–5 days and the median of mileage per year was 20,000–30,000 km. Eight participants from the warning outside the CB group were removed due to problems with the recorded data; that is, the final numbers of participants for the groups with the warning inside and outside the CB were 20 and 11, respectively.
Forward collision warning system
The test car was equipped with a visual–acoustic warning alarm. The warning was triggered based on the TTC between the vehicle and the cyclist when they both reached the intersecting point (coordinate in the intersection where the path of the car and the cyclist crossed). The warning was displayed in the middle of the dashboard (pictogram of a bicycle surrounded by 2 arrows) and the audio was set at a frequency of 1,800 Hz. In order to have comparable results and avoid variations in speed, which can affect the distance from the intersection when participants experience the warning, all participants had to activate the adaptive cruise control (ACC), which maintained a constant speed.
Experimental design
For the present study, a between-subjects experiment design was used. The independent variable was the TTC when the warning was triggered. As previously stated, 2 warnings were tested: One inside the CB and one outside the CB of the drivers. The timings of the warning were calculated using the above-mentioned CB model. In order to calculate the warning times, it was necessary to define the of the cyclist. The current European New Car Assessment Programme test scenario for a cyclist crossing from the near side and a car driving straight states that the cyclist speed is 15 kph (4.167 m/s) and the distance of the cyclist from the starting point to the intersecting point is 17 ms. This results in a TTA for the cyclist (
) of 4 s. Therefore, the selected warning times for each group were TTC = 2.6 s (asymptotic value of the model at TTC = 4 s) for the group with the warning inside the CB and TTC = 1.7 s (below the lower 95% value of the model at TTC = 4 s) for the group with the warning outside the CB. The traveling speed of the car was 50 kph. Participants were informed that a warning would appear (attentive drivers) and were not given any secondary tasks.
Procedure
Upon arrival at the test track, participants read a brief of the experiment and filled out a questionnaire regarding demographic characteristics and driving experience. Then participants were asked to drive 3 times around the test track to become familiar with the simulator and the route. Subsequently, participants drove 9 times around the route and experienced 9 different cyclist encounters (varying the cyclist’s sensory conspicuity and traffic density) in a T-type junction (AUDI AG study) after which participants had a small break. During the break, participants were informed about the Toyota Motor Europe experimental procedure. Participants were informed that in an X-type intersection a cyclist would appear and a visual–acoustic FCW would be signaled. Participants were asked to brake only after the warning was issued. The exact instruction given to the participant was the following: “During the second intersection, a warning will be signalled. After the warning is signalled, you are allowed to brake at any time you find convenient (you decide when to brake depending on when you think the situation becomes critical).” Participants were informed of the appearance of the cyclist and the warning, because the objective of the study was to determine attentive drivers’ acceptance of the warning (a case that could lead to false positives). After the break, participants from both groups drove toward the X-type intersection where they encountered the cyclist crossing from the near side and the warning sounded. Participants then completed a survey regarding acceptance and willingness to buy the system experienced in the X-type intersection. The results presented in this article are only based on the data obtained during the Toyota Motor Europe part of the study.
The purpose of the study was to determine driver acceptance of an FCW system based on a model that replicates the brake onset timing of the drivers in a cyclist crossing scenario (CB model). Two hypotheses were tested. Firstly, it was hypothesized that drivers would present a longer time gap between the warning onset and the brake onset when the warning was produced inside the CB; that is, drivers would perceive the warning as noncritical and would take a longer time to respond (brake) to the imminent collision with the bicycle. Secondly, it was hypothesized that drivers would rate the warning inside the CB with lower acceptance and willingness to buy because the driver would consider the scenario noncritical, leading to a possible false-positive warning effect.
Measures and analysis methods
A Wilcoxon rank sum test was conducted to compare the time gap between the warning onset and brake onset of in both groups (Hypothesis 1). For the survey results, a Wilcoxon rank sum test was done to compare the answers given by the participants in both groups (Hypothesis 2). Finally, a Spearman’s rank correlation test was conducted between the acceptance and willingness to buy and the time lag between the brake onset and the warning onset. Alpha was set to .05 for all test and all results were adjusted using Bonferroni correction.
Results
Time gap between warning and brake onset
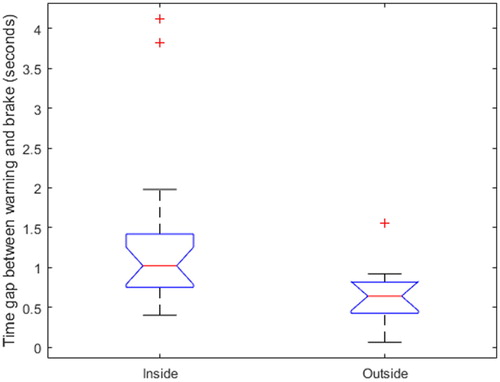
The first analysis done was to determine the time gap between the warning and the brake onset. The hypothesis is that the warning inside the CB would be considered too early for drivers (noncritical) compared to the warning outside the CB. The mean gap time—that is, time between the warning onset and the brake onset—was 1.32 s (SD = 0.99) for the inside CB group and 0.65 s (SD = 0.38) for the outside CB group, as presented in . As previously mentioned, a Wilcoxon rank sum test was done to compare both groups, and a significant statistical difference between both groups was found (Z = 2.5391, P = .055).
Figure 5. Time gap between the warning time and brake onset for both groups (inside and outside the CB). The box plots show the mean and standard error of the mean.
Acceptance survey
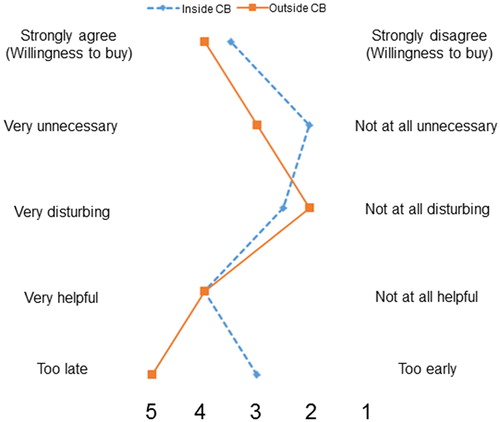
Participants were asked to complete a survey at the end of the experiment. The survey consisted of 5 questions on a 5-point Likert scale (Appendix 1, see online supplement). The survey was created during the PROSPECT project based on previous literature focused on acceptance (Bruyas et al. Citation2018). A Wilcoxon rank sum test was done to compare the answers given by the participants in both groups. For the first question (“Was the warning on time?”) there was a statistically significant difference between groups (Z = −3.1320, P = .0087). Participants from the inside CB group scored a median of 3 (“just right”) compared to the outside CB group with a median of 5 (“too late”). This indicates that participants felt that the outside CB warning was issued later than they would have braked.
The following question did not show any significant difference between groups. For the second question (“Was the warning helpful?”), both groups found the warning helpful (Z = 0.3283, P = 1). For the third question (“Was the warning disturbing?”), neither group rated the warning as disturbing (Z = 2.0732, P = .1908). For the fourth question (“Do you think the warning was unnecessary?”), both groups found the warning necessary (Z = 0.0644, P = 1). And for the fifth question (“Would you be willing to buy the system?”), both groups tended to agree that the system was beneficial (Z = −1.2843, P = .9951). shows the median results for each survey question for responses from both groups.
Figure 6. Answers given by participants in both groups (inside and outside the CB). The plot shows the mean values for each group for each of the 5 questions asked during the poststudy survey. The survey used a 5-point Likert scale.
Correlation test
A Spearman’s rank correlation test was performed to determine the effect of the gap between the warning and the braking time and willingness to have the system. A significant negative correlation was found between the time gap and willingness to buy, r(31) = −0.3478, P = .0552. This means that the closer the warning time is to the time when a driver would typically brake—that is, when the driver feels that a situation has become critical—the greater the acceptance of the system.
Discussion
This study aimed to determine drivers’ acceptance of warnings based on a driver model describing the moment a driver would brake (CB) when encountering a cyclist crossing the road. Two warnings were tested: One warning inside the CB (at TTC = 2.6 s) and one warning outside the CB (at TTC = 1.7 s). Compared to current standards, the timing of the warning inside the CB is within the recommended warning times, in contrast to the warning time outside the CB, which is shorter than the recommended warning times (around 0.2 s shorter; International Organization for Standardization Citation2013; SAE International Citation2003). The differences lie in the standards’ long driver reaction time values and conservative braking deceleration values. The results of this study can be considered when revising current standards.
The warning outside the CB showed a greater emergency response by the participants (participants braked 0.65 s after the warning) than the warning inside the CB (participants braked 1.32 s after the warning). According to the study by Behr et al. (Citation2010), attentive drivers take 0.416 s (SD = 0.095) to react to an expected warning. In the present study, participants also were aware that a warning would be issued because they were instructed to brake any time after the warning (when they considered the situation to be critical). The reaction of 0.65 s after the warning in the outside the CB group leads to the conclusion that participants reacted to the warning almost immediately, similar to the behavior found by Behr et al. (Citation2010). It should also be mentioned that 98.4% of the participants had experienced FCWs before. Although their reactions could have differed if they had never experienced the system, FCW is becoming more standard in cars and the behavior encountered in the current study portrays the behavior of current and future attentive drivers when encountering a collision warning. In addition, although the speed was controlled by ACC, which has an effect on drivers’ reaction time, the ACC studies conducted in the literature have been at least 5 min in length (the current study lasted less than 1 min) and the effect of ACC is higher among older drivers (this study included young drivers) and when the foot is not on the pedal before braking (most of the participants already had their foot in the brake because the cyclist was visible 4 s before reaching the intersection); therefore, the effect of ACC can be considered negligible (Hitz et al. Citation2000; Jammes et al. Citation2017; Moeckli et al. Citation2015).
Regarding acceptance, although not statistically significant, participants rated the late warning better than the early warning, despite earlier research showing greater acceptance of earlier warnings (Abe and Richardson Citation2006; Aust et al. Citation2013; Large et al. Citation2018; McGehee et al. Citation2002). This discrepancy may be due to the different scenarios in which the warnings were tested. Large et al. (Citation2018) tested the FCW in a pedestrian crossing scenario, and Abe and Richardson (Citation2006) and Aust et al. (Citation2013) tested a car-to-car scenario. Acceptance of the warning might be different depending on the scenario; therefore, a driver model that accounts for comfort boundaries in pedestrian crossing and car-to-car scenarios might allow for comparison with previous research. Finally, through the correlation performed, the study leads to the conclusion that a warning closer to the normal braking behavior of a driver increases acceptance of the system. This is similar to the conclusion of Jamson et al. (Citation2008), who found that warnings that adapted to the drivers’ behaviors were better accepted. The conclusion of this previous research and the present study is that warnings should be adapted to drivers’ behaviors to gain higher acceptance. The present study highlights the benefit of developing warnings based on driver models for attentive drivers to avoid false-positive situations.
Although the study was performed using a real car, the study was conducted within a test track in a simulated virtual environment. These factors might affect the urgency of the drivers’ responses to the cyclist because it is a safe environment and they may have been more relaxed with regard to the appearance of the vulnerable road user (VRU). In addition, in real-world driving, drivers are exposed to a greater number of stimuli that diminish their attention toward an specific entity, in this case the VRU. Finally, as stated before, the present study was performed using attentive young drivers. A future study is needed to determine whether acceptance of the warning outside the CB compared to inside the CB is also higher for distracted drivers and across different age groups.
Data availability statement
The data that support the findings of this study are available on request from the corresponding author (PPG). The data are not publicly available due to a confidentiality agreement between the partners of the PROSPECT project.
Supplemental Material
Download MS Word (33.5 KB)Acknowledgment
The authors thank the partners of PROSPECT who contributed to the work described in this article: Applus IDIADA, BASt, Audi, BMW, Bosch, Continental, Volvo, TNO, VTI, University of Nottingham, University of Budapest, University of Amsterdam, IFSTTAR, 4activeSystems, TME, Daimler, and Chalmers.
Additional information
Funding
Related Research Data
References
- Abe G, Richardson J. Alarm timing, trust and driver expectation for forward collision warning systems. Appl Ergon. 2006;37:577–586.
- AUDI AG. Audi AI and driver assistance systems. 2018. Available at: https://www.audi-mediacenter.com/en/the-fourth-generation-of-the-audia8-heading-into-a-new-era-9403/audi-ai-and-driver-assistance-systems-9413. Accessed December 15, 2018.
- Aust ML, Engstrom J, Vistrom M. Effects of forward collision warning and repeated event exposure on emergency braking. Transp Res Part F Traffic Psychol Behav. 2013;18:34–46.
- Bargman J, Boda CN, Dozza M. Counterfactual simulations applied to SHRP2 crashes: the effect of driver behavior models on safety benefit estimations of intelligent safety systems. Accid Anal Prev. 2017;102:165–180.
- Behr M, Poumarat G, Serre T, Arnoux PJ, Thollon L, Brunet C. Posture and muscular behaviour in emergency braking: an experimental approach. Accid Anal Prev. 2010;42:797–801.
- Boda CN, Dozza M, Bohman K, Thalya P, Larsson A, Lubbe N. Modelling how drivers respond to a bicyclist crossing their path at an intersection: how do test track and driving simulator compare? Accid Anal Prev. 2018;111:238–250.
- Bruyas MP, Estraillier C, Large D, et al. Report on Methodology for Balancing User Acceptance, Robustness and Performance (PROSPECT Project). Brussels, Belgium: European Commission; 2018. Deliverable D7.2.
- Cicchino JB. Effectiveness of forward collision warning and autonomous emergency braking systems in reducing front-to-rear crash rates. Accid Anal Prev. 2017;99:142–152.
- European Commission. Road Safety in the European Union: Trends, Statistics and Main Challenges. Brussels, Belgium: Author; 2015.
- European New Car Assessment Programme. Test Protocol—AEB VRU Systems. Ver. 2.0.2. Brussels, Belgium: Author; 2017.
- Fitch GM, Rakha HA, Arafeh M, et al. Safety Benefit Evaluation of a Forward Collision Warning System. Washington, DC: U.S. Department of Transport; 2008.
- Hitz JS, Koziol JS, Lam AH, Inman V. Safety evaluation results from the field operational test of an intelligent cruise control (ICC) system. Paper presented at: SAE World Congress; March 6–9, 2000; Detroit, MI.
- International Organization for Standardization. Intelligent Transport Systems—Forward Vehicle Collision Warning Systems—Performance Requirements and Test Procedures. Geneva, Switzerland: Author; 2013.
- Jaguar Land Rover. Electric car safety: Jaguar I-Pace. 2018. Available at: https://www.jaguar.co.uk/jaguar-range/i-pace/features/safety.html. Accessed December 15, 2018.
- Jammes Y, Behr M, Llari M, Bonicel S, Weber JP, Berdah S. Emergency braking is affected by the use of cruise control. Traffic Inj Prev. 2017;18:636–641.
- Jamson AH, Lai FCH, Carsten OMJ. Potential benefits of an adaptive forward collision warning system. Transp Res Part C Emerg Technol. 2008;16:471–484.
- Large DR, Kim H, Merenda C, et al. Investigating the effect of urgency and modality of pedestrian alert warnings on driver acceptance and performance. Transp Res Part F Traffic Psychol Behav. 2018;60:11–24.
- McGehee DV, Brown TL, Leed JD, Wilson TB. Effect of warning timing on collision avoidance behavior in a stationary lead vehicle scenario. Transp Res Rec. 2002;1803(1):1–6.
- Merat N, Madigan R, Nordhoff S. Human factors, user requirements, and user acceptance of ride-sharing in automated vehicles. Paper presented at: International Transport Forum; December 6–7, 2016; Paris, France.
- Moeckli J, Brown T, Dow B, Boyle LN, Schwarz C, Xiong H. Evaluation of Adaptive Cruise Control Interface Requirements on the National Advanced Driving Simulator. Washington, DC: U.S. Department of Transportation; 2015.
- Op den Camp O, van Montfort S, Uittenbogaard J, Welten J. CATS Final Project Summary Report. Helmond, The Netherlands: Nederlandse Organisatie voor Toegepast Natuurwetenschappelijk Onderzoek; 2016. Deliverable D6.1.
- Rodarius C, Kwakkernaat M, Edwards M, de Hair S. Benefit Estimate Based on Previous Studies for Pre-crash Cyclist Systems and Recommendations for Necessary Changes to Pedestrian Test and Assessment Protocol (ASPECSS Project). Brussels, Belgium: European Commission; 2014. Deliverable D1.5.
- SAE International. Human Factors in Forward Collision Warning Systems: Operating Characteristics and User Interface Requirements. Michigan: Author; 2003.
- Schade J, Schlag B. Acceptability of urban transport pricing strategies. Transp Res Part F Traffic Psychol Behav. 2003;6:45–61.
- Toyota Motor Corporation. Toyota to roll out 2nd generation Toyota Safety Sense active safety packages from 2018 [press release]. 2017. Available at https://newsroom.toyota.co.jp/en/corporate/19842201.html. Accessed November 1, 2018.
- Winkler S, Werneke J, Vollrath M. Timing of early warning stages in a multi stage collision warning system: drivers’ evaluation depending on situational influences. Transp Res Part F Traffic Psychol Behav. 2016;36:57–68.
- Wisch M, Lerner M, Schneider A, et al. Accident Analysis, Naturalistic Observations and Project Implications—Part A: Accident Data Analyses. Brussels, Belgium: European Commission; 2016. Deliverable D2.1.