
Abstract
Objective: The objective of this article was to develop a multi-agent traffic simulation methodology to estimate the potential road safety improvements of automated vehicle technologies.
Methods: We developed a computer program that merges road infrastructure data with a large number of vehicles, drivers, and pedestrians. Human errors are induced by modeling inattention, aimless driving, insufficient safety confirmation, misjudgment, and inadequate operation. The program was applied to simulate traffic in a prescribed area in Tsukuba city. First, a 100% manual driving scenario was set to simulate traffic for a total preset vehicle travel distance. The crashes from this simulation were compared with real-world crash data from the prescribed area from 2012 to 2017. Thereafter, 4 additional scenarios of increasing levels of automation penetration (including combinations of automated emergency braking [AEB], lane departure warning [LDW], and SAE Level 4 functions) were implemented to estimate their impact on safety.
Results: Under manual driving, the system simulated a total of 859 crashes including single-car lane departure, car-to-car, and car-to-pedestrian crashes. These crashes tended to occur in locations similar to real-world crashes. The number of crashes predicted decreased to 156 cases with increasing level of automation. All of the technologies considered contributed to the decrease in crashes. Crash reductions attributable to AEB and LDW in the simulations were comparable to those reported in recent field studies. For the highest levels of automation, no assessment data were available and hence the results should be carefully treated. Further, in modeling automated functions, potentially negative aspects such as sensing failure or human overreliance were not incorporated.
Conclusions: We developed a multi-agent traffic simulation methodology to estimate the effect of different automated vehicle technologies on safety. The crash locations resulting from simulations of manual driving within a limited area in Japan were preliminary assessed by comparison with real-world crash data collected in the same area. Increasing penetration levels of AEB and LDW led to a large reduction in both the frequency and severity of rear-end crashes, followed by car-to-car head-on crashes and single-vehicle lane departure crashes. Preliminary estimations of the potential safety improvements that may be achieved with highly automated driving technologies were also obtained.
Introduction
The safety benefit of driving assistance technologies that started penetrating the market a few years ago was estimated prospectively in the past and is currently being assessed based on real-world data. For example, past prospective studies used simple-scenario simulation-based methodologies to estimate crash avoidance potential of low-speed rear-end automated emergency braking (AEB) systems to be between 8 and 65% (Kusano and Gabler Citation2012; Lindman et al. Citation2012). Recent real-world traffic and crash data studies have shown that the presence of these AEB systems is associated with 10 to 15% lower insurance claims (Doyle et al. Citation2015) and 27 to 39% lower crash occurrence (Cicchino Citation2016; Fildes et al. Citation2015; Isaksson-Hellman and Lindman Citation2016). Another example is lane departure warning (LDW) systems, the effectiveness of which was estimated prospectively to be 30% (Gorman et al. Citation2013) and has recently been associated with an 18 to 53% lower crash likelihood (Cicchino Citation2017; Sternlund et al. Citation2017). Similarly, simulation-based approaches are also being applied for prospective estimations of the safety benefits of more advanced driver assistance technologies such as car-to-pedestrian AEB (Rosen Citation2013) and car-to-car intersection AEB (Sander and Lubbe Citation2018) systems. However, it will take years until these technologies penetrate the market and sufficient data to prove their benefit can be collected.
The majority of car crashes are preceded by human error (Dingus et al. Citation2016). As highly automated driving (HAD) technologies are developed and start penetrating the market, the systems’ capacities to address human error avoidance or mitigation will be critical to determine their impact on safety. In addition to the contribution to safety improvements, automated driving (AD) systems are expected to influence normal driving conditions, infrastructure development, energy efficiency, personal mobility, and the economy. Hence, understanding highly complex traffic environments in which various levels of automation coexist and interact with other agents (such as other AD vehicles, manual driving vehicles, pedestrians, bicycles, etc.) or with the road infrastructures is of critical importance.
Multi-agent traffic simulation is a modeling technique commonly applied in a wide range of research fields, including transport economy, transport evacuation guidance, and road infrastructure development (Behrisch et al. Citation2011). The strength of this technique lies in its capacity to deal with complex traffic-related events where the effects of individual behaviors may accumulate. Using this technique, specific applications that incorporate crashes have also been applied to support the development of vehicle technologies and to predict their effectiveness (Papadoulis et al. Citation2019). However, currently existing multi-agent traffic simulation commercial software (e.g., Vissim, Aimsum) is limited in the capacity to address human error–related crash causality. Though the most advanced types of software allow for the inclusion of stochastic elements (e.g., temporary lack of attention) or elaborated distributions of parameters that may affect safety relevant situations (e.g., time-to-collision distributions), the software is not suitable for modeling human behavior and errors critical to account for crash causality (Fellendorf and Vortisch Citation2010). As the complexity of HAD systems and their potential socioeconomic impact increases, so does the demand for higher simulation modeling complexity that incorporates the effect of human behavior on crash causality and that allows us to prospectively assess the impact that these technologies will have in society.
The long-term goal of this research is to support the development of strategies that contribute to the deployment of a safer automated driving society. The specific aim of this research is to develop a multi-agent traffic simulation methodology, with the potential to address human error–related crash causality, and to use it to estimate the potential safety improvements of AD systems.
Method
A program was coded from scratch using C++ language. The program merges road infrastructure data with a large number of traffic agents, including vehicles, drivers, pedestrians, and the interaction between all of them. Each traffic agent was modeled to act independently, so that realistic traffic flow could be reproduced. The developed program was applied to simulate continuous traffic including hundreds of agents at any given time in a prescribed area in Tsukuba city (Japan). First, a 100% manual driving scenario was set to simulate traffic for a total vehicle travel distance of 80,000 km. The frequencies and locations of crashes occurring in this simulation were compared with corresponding real-world crash data from the selected area from 2012 to 2017. Thereafter, 4 additional scenarios of gradually increasing levels of automated technology penetration combining AEB, LDW, and Level 4 AD functions (SAE International Citation2018) were implemented in the simulations to estimate their potential effects on safety.
Targeted crash types
The 5 most relevant crash types in terms of mortality rates and number of crashes occurring in Japan in 2015 (Japan Police Citation2015) were selected as targets for program development. These types included rear-end vehicle-to-vehicle (V2V), head-on V2V, intersection V2V, on-road vehicle-to-pedestrian (V2P), and single-car lane departure crashes. The 5 crash types together represented a coverage of 64% of all fatal crashes and 66% of all crashes (Figure A1, see online supplement).
Road network and traffic infrastructure simulation models
A road network area of 6 × 3 km in Tsukuba city was selected to develop the program and to conduct the safety benefit analysis calculations. The selected area included a prefectural highway sector with 2 or 3 lanes per direction, national highway sectors with one lane per direction, and multiple sectors of urban roads. Existing road network map data were combined with new infrastructure data (e.g., traffic lights including green/red cycles, pedestrian crosses, stop signs, speed limit signs, etc.) acquired from in-house surveys conducted with vehicles equipped with environment recognition technologies.
Driver behavior, diversity, and error simulation models
A driver behavior simulation model combined simplified algorithms for perception/recognition, decision making, and pedal/steering wheel activation. Driver diversity was modeled according to a framework that establishes groups of drivers according to 4 parameters: compliance with traffic laws, information processing ability, driving skill, and arousal level. The 5 most relevant human error types reported in crashes occurring in Japan in 2015 (Japan Police Citation2015) were selected as targets for driver error modeling. These error types included inattention, aimless driving, insufficient safety confirmation, misjudgment, and inadequate operation (Yuhara and Tajima Citation2006) and provided a coverage of more than 80% of the errors that cause crashes in each of the 5 crash types targeted by the current simulation study (Figure A9, see online supplement). The techniques applied to model driver behavior (including perception, decision making, and longitudinal and lateral vehicle control), driver diversity, and human errors are described in detail in the Appendix (see online supplement).
Pedestrian behavior simulation model
A pedestrian behavior model was implemented into the system according to a framework similar to that for the driver and accounts for distributions of parameters such as walking speed, crossing angle, gaze-based safety confirmation before crossing, and time-to-collision with a vehicle at the start of crossing. The quantified distributions incorporate on- and off-crosswalk crossing behavior models originally developed based on observational studies of real-world pedestrians (Mori et al. Citation2009) and recently updated based on behavioral characteristics by age and sex from new observational studies specifically designed for the current simulation purposes (Nakamura et al. Citation2017). Crossing errors were modeled by omitting safety confirmation before crossing according to distributions measured in the observational studies (Nakamura et al. Citation2017).
Simulation models of driver assistance and AD functions
AEB sensing, warning activation, and braking actuation were modeled as a function of time-to-collision following the same principles as the driver’s perception and longitudinal vehicle control functions previously described. LDW was implemented through a function that tracks the deviation between the center of the vehicle and the center of the road lane by tracking the white lines on both sides of the lane. Details on the modeling techniques applied to model AEB and LDW are provided in the Appendix.
An HAD system was modeled by implementing an ideal SAE Level 4 system in which no driver intervention is expected. This system was based on a previous system that combined far-distance sensors (sensing angle of 20° and sensing distance of 160 m) and periphery sensors (160°, 80 m) in the front-end part of the vehicle, with far distance (30°, 90 m) and periphery (90°, 10 m) on the rear-end part as shown in Figure A13 (see online supplement). Delivery of control between the system and the driver was not modeled. Vehicle operation was modeled similar to the driver vehicle control in both longitudinal and lateral directions but with no errors and no operation delays.
Traffic simulation settings and experimental design
Five sets of continuous traffic were simulated by incorporating up to 500 agents at a time, including vehicles with their drivers and pedestrians. Each simulation was terminated when the overall distance traveled by the vehicle reached 80,000 km. Traffic density functions on the main roads were set based on public road traffic census data. Traffic density functions and vehicle route choices at major intersections (e.g., straight ahead, turn right, left turn, etc.) were set according to the in-house surveys conducted at the corresponding real locations.
First, a 100% manual driving scenario was simulated. The crashes from the simulation were compared with real-world crash data from the prescribed area from 2012 to 2017. Thereafter, 4 additional scenarios of gradually increasing levels of automated technology penetration (, ranging from 100% manual driving [scenario 1] to 25% AEB/LDW and 75% HAD [scenario 5]) were implemented in the simulations to estimate the systems’ effects on crash occurrence and crash conditions. The scenarios set for the current study were hypothetical and did not consider real market penetration functions (Sander and Lubbe Citation2018).
Table 1. Experimental design including increasing levels of technology penetration.
Simulation of crashes and postprocessing
A crash was defined as an event in which 2 agents coincided in space and time. Whenever a crash occurred in the simulation as a consequence of the simulated errors previously described, the program automatically recorded the relevant data for postprocessing.
In the postprocessing phase, the total number of crashes (N) occurring in each scenario () was counted. Based on these counts, crash rates were calculated by dividing the number of crashes by the total travel distance. The probability of fatal or severe injuries for each driver or pedestrian involved in a crash was calculated based on the precrash data from the simulations and crash speed–, occupant age–, and driver age–dependent injury risk functions developed from crash data in Japan for emergency rescue purposes (Kiuchi et al. Citation2016). The injuries sustained in each case were categorized as no injury, minor injury, severe injury, or fatal injury, with the probability of injury for each case being higher than 30%, 5–30%, 1–5% and lower than 1%, respectively. Further details and examples about the injury classification method applied are provided in the Appendix (Figure A14, see online supplement).
Results
Crash location maps: Real-world vs. manual driving simulation
Figure A7 (top subplot, see online supplement) shows the Tsukuba road section map selected for the current study, including the locations of the fatal and injurious crashes reported by the Ibaraki prefectural police within the same area from 2012 to 2017. Figure A7 (second subplot from the top) also shows the crash occurrence locations by crash type that occurred in the simulation with manual driving settings (scenario 1, ). A comparison between these 2 figures provides a first qualitative assessment of the simulation models’ abilities to reproduce general patterns of crash occurrence locations. The majority of crashes in the simulation occurred along the prefectural roads in a fashion similar to that of real-world crashes. The simulation results from this case were adopted as the baseline to calculate the effects of driving assistance and AD system on crash occurrence and conditions.
Crash location maps: Simulation manual driving vs. different automation levels
Figure A7 (third and fourth subplots from the top) shows the results from crash locations by crash type in simulated scenario 3 (25% manual driving, 25% AEB, and 50% AEB + LDW) and scenario 5 (25% AEB + LDW, 75% AD Level 4) as defined in . Compared to manual driving (Figure A7, second plot), the overall number of crashes appear to decrease with increased automation level; this decrease is dominated by rear-end V2V crashes, head-on V2V crashes, and single-vehicle lane departure crashes. The decrease in intersection V2V crashes and V2P crashes appears less clear.
Number of crashes, crash rates, and relative crash rates by automation level
summarizes the total number of crashes, crash rates, relative crash rates by distance driven, and relative crash rates by AD system for each of the 5 simulated AD penetration scenarios. Scenarios 1 to 5 accounted for a gradual decrease from 850 to 156 crashes, indicating a decrease in crash occurrence for increasing AD penetration level considered. Assuming manual driving (scenario 1) as a baseline value (100) for crash rate, the relative crash rates for scenarios 2 to 5 ranged from 70 to 16, respectively.
Table 2. Summary of simulation results including number of crashes, crash rates, and relative crash rates for each level of technology penetration level simulated.
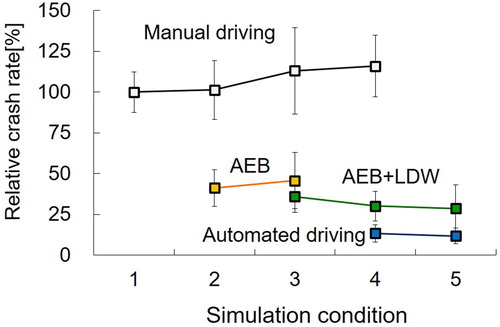
shows average relative crash rates calculated for each simulated scenario. The rates for manual driving are the highest. Crash rates of vehicles equipped with AEB and LDW are lower than those for AEB alone, indicating an additional gain for LDW systems in terms of crash reduction. Overall, the higher the automation level, the lower the crash rate. However, it is noted that there is an increasing trend in crash rates attributable to manual driving when the latter coexists with driving assistance and AD systems (scenarios 2, 3, and 4).
Figure 1. Comparison of relative crash rates by AD penetration level.
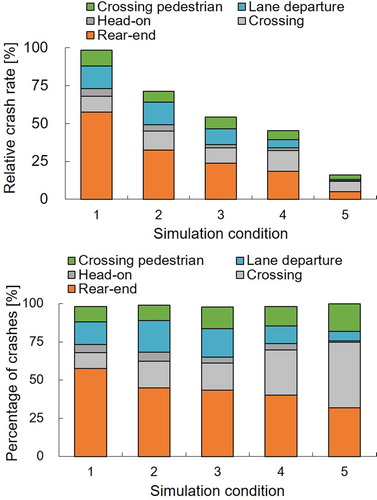
shows breakdowns of relative crash rates by crash type and percentages of crashes by crash type for each simulated AD penetration scenario. Relative crash rates decreased as automation levels increased. As suggested by the crash location maps (Figure A7), the percentages of rear-end V2V crashes, head-on front V2V crashes, and single-vehicle lane departure crashes were largely reduced by increasing automation level; likewise, the percentage of intersection V2V crashes and the V2P ratios increased with higher levels of automation.
Figure 2. Comparison of relative crash rates and component rates.
Change in crash conditions by automation level
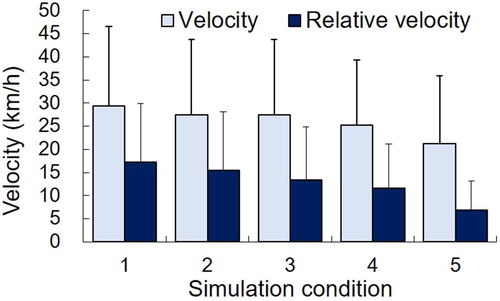
shows average and relative crash speeds in rear-end V2V crashes for all AD penetration scenarios simulated. Both the average crash speeds (29.4 km/h in scenario 1 to 21.3 km/h in scenario 5) and the relative crash speeds (17.2 km/h in scenario 1 to 6.8 km/h in scenario 5) decreased with increased automation level. Hence, in addition to the prevention of crashes, the current methodology incorporates crash severity mitigation and corresponding injury likelihood reduction in evaluating the benefit of AD systems.
Figure 3. Average and relative crash speeds in rear-end V2V crashes for all scenarios simulated (1–5).
Estimation of fatal injury reductions by automation level
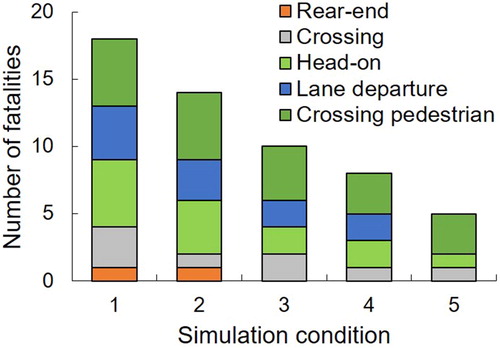
shows the results of estimating the number of fatalities by scenario and crash type. The number of fatalities estimated for 100% manual driving (scenario 1) was 18. This number decreased with increased automation level implemented in the simulations; that is, 5 fatalities for the highest automation level simulated (scenario 5). These estimated 5 fatalities for the highest level of automation simulated included one head-on V2V crash, one intersection V2V crash, and 3 V2P crashes.
Figure 4. Estimated number of fatalities for all scenarios simulated (1–5).
Discussion
The general approach applied in this study is substantially different to the majority of studies that have used simulation-based methodologies to evaluate prospectively the benefit of driving assistance or AD technologies. Most prospective studies focused on predefined crash scenarios in which human and vehicle technologies were modeled (Kusano and Gabler Citation2012; Lindman et al. Citation2012; Rosen Citation2013; Sander Citation2018; Sander and Lubbe Citation2018). In contrast, in the methodology we propose, drivers and pedestrians who may make errors are incorporated into the continuous traffic modeling system until they eventually cause crashes. A strength of the method we propose is its potential to evaluate the effectiveness of certain AD systems in a wide range of traffic conditions directly extracted from the corresponding real traffic environment, including normal driving, near-misses, and crashes.
The multi-agent traffic simulation program we developed incorporated a large amount of real-world data sources, including static road network and traffic infrastructure data from in-house surveys, parameterization of driver behavior diversity surveys (Kitajima et al. Citation2017), pedestrian behavior observational studies (Nakamura et al. Citation2017), and controlled AEB performance experiments with instrumented vehicles (Homma et al. Citation2012). However, the model relies on a large number of simplifications of the real phenomena simulated, many of which have not been strictly validated. Because the assumptions are applied to hundreds of agents at the same time, it is difficult to control for the effects that the simplifications have on the overall results, which highlights the main limitation of the multi-agent traffic modeling approach. For example, we modeled driver reaction in its interaction with a pedestrian by incorporating reaction times randomly extracted from an empirical distribution. However, recent studies on a controlled single car-to-pedestrian interaction suggest that driver reaction depends on the relative kinematics between the agents involved and hence more advanced models that capture this interaction may be needed (Markkula et al. Citation2018). A combination of well-controlled and validated single-event approaches, with applications to the multi-agent approach, may lead to an improvement of both the understanding of the underlying interaction mechanisms between agents and the relevance of these mechanisms in terms of overall impact on safety in wider and more complex environments.
The current study focused on developing the program and methodology based on a limited area and only included cars with their drivers and pedestrian agents. In Japan, cyclists account for 12.7% of all traffic-related fatalities (Japan Police Citation2015), and the incorporation of cyclist behavior simulation models into the system needs to be considered (Westerhuis and De Waard Citation2017). In addition, Japan has a very heterogeneous population distribution and traffic environments that include extremely populated megacities with depopulated inland regions. Future work will address the incorporation of cyclist agents into the traffic simulation model and expand the methodology to other regions to estimate the safety impact of AD systems at the Japan national level.
An assessment of the simulated crash locations for the manual driving scenario was conducted based on a quantitative comparison with real-world police-reported crash data locations (Figure A7, top 2 subplots). Unfortunately, the crash data locations made public by the prefectural police were not matched with the in-depth crash data existing for the area and, hence, no detailed comparison could be conducted on the crash types or injury levels estimated. In addition, if more detailed assessment of the crashes in the simulations were to be conducted including crash types, crash conditions, and the precrash events that led to the crashes, more advanced crash collection systems (e.g., German In-Depth Accident Study precrash matrix) need to be incorporated.
Our predictions of the potential crash likelihood reduction attributable to AEB and LDW are in line with preliminary real-world data-based assessment of these technologies in other environments. Our estimation suggests a crash reduction of 30% for a scenario in which half of the cars have an AEB system implemented (). Although not directly comparable, these results were consistent with recent real-world traffic and crash data studies that show that the presence of AEB systems is associated with a 27 to 39% lower crash occurrence (Cicchino Citation2016; Fildes et al. Citation2015). Also in line with our predictions of crash reduction attributable to LDW (), studies using real-world data have associated LDW with an 18 to 53% lower crash likelihood (Cicchino Citation2017; Sternlund et al. Citation2017).
Though no data currently exist to assess the effectiveness of estimations attributed to high-level AD systems, the current effectiveness estimations should be interpreted as overestimations of real scenarios. It is noted that the sensor system was modeled as an ideal system with no sensing errors, no operation delays, and no delivery of control between the system and the driver and hence all possible crashes arising due to these causes were not considered in the calculations.
The simulation-based estimations presented in this article support the idea that safety technologies will contribute to reduce the number (, left) and the severity of crashes (). These estimations can be applied to develop policies that prioritize the spread of the most promising technologies. In addition, the simulation work may provide insight into how safety priorities may change in the future (, left) and therefore provide insight useful to develop research and policymaking strategies that accelerate safety improvements. On the other hand, particular attention needs to be given to situations in which an increase in relative crash rates attributable to manual driving may occur for the scenarios in which this type of driving has to co-exist with different automation penetration levels (scenarios 2–4 in ). Regardless of which vehicle is at fault, this would imply potentially hazardous situations for manually driven cars as they deal with the new AD vehicles.
In conclusion, we developed a multi-agent traffic simulation methodology to estimate the effect of different automated vehicle technologies on safety. The crash locations resulting from simulations of manual driving scenarios within a limited area in Japan were preliminary assessed by comparison with real-world crash location data collected in the same area. Increasing penetration levels of AEB and LDW led to large reductions in the number and severity of rear-end crashes, followed by vehicle-to-vehicle head-on crashes and single-vehicle lane departure crashes. Preliminary estimations of the potential safety improvements that may be achieved by HAD technologies were also obtained.
Supplemental Material
Download MS Word (1.4 MB)Additional information
Funding
Related Research Data
References
- Behrisch M, Bieker L, Erdmann J, Krajzewicz D. 2011. Sumo–simulation of urban mobility. Paper presented at the Third International Conference on Advances in System Simulation (SIMUL 2011), Barcelona, Spain.
- Cicchino JB. 2016. Effectiveness of forward collision warning systems with and without autonomous emergency braking in reducing police-reported crash rates. Arlington, VA: Insurance Institute for Highway Safety. https://cdn0.vox-cdn.com/uploads/chorus_asset/file/5970437/FCP_FCW_AEB_effectiveness.0.pdf.
- Cicchino JB. 2017. Effectiveness of forward collision warning and autonomous emergency braking systems in reducing front-to-rear crash rates. Accid Anal Prev. 99:142–152.
- Dingus TA, Guo F, Lee S, Antin JF, Perez M, Buchanan-King M, Hankey J. 2016. Driver crash risk factors and prevalence evaluation using naturalistic driving data. Proc Natl Acad Sci USA. 113(10):2636–2641.
- Doyle M, Edwards A, Avery M. 2015. AEB real world validation using UK motor insurance claims data. Paper presented at the 24th International Technical Conference on the Enhanced Safety of Vehicles (ESV) National Highway Traffic Safety Administration.
- Fellendorf M, Vortisch P. 2010. Microscopic traffic flow simulator VISSIM fundamentals of traffic simulation. New York: Springer-Verlag. p 63–93.
- Fildes B, Keall M, Bos N, Lie A, Page Y, Pastor C, Pennisi L, Rizzi M, Thomas P, Tingvall C. 2015. Effectiveness of low speed autonomous emergency braking in real-world rear-end crashes. Accid Anal Prev. 81:24–29.
- Gorman TI, Kusano KD, Gabler HC. 2013. Model of fleet-wide safety benefits of Lane Departure Warning systems. Paper presented at the 2013 16th International IEEE Conference on Intelligent Transportation Systems-(ITSC).
- Homma R, Kazunori K, Wakasugi T, Tasaka T, Yoshida S. 2012. Evaluation of forward vehicle collision mitigation systems. How drivers respond to warnings under the low expectation of the hazardous situation? Transactions Soc Automot Eng Japan. 43(3):769–775.
- Isaksson-Hellman I, Lindman M. 2016. Evaluation of the crash mitigation effect of low-speed automated emergency braking systems based on insurance claims data. Traffic Inj Prev. 17(Suppl 1):42–47.
- Japan Police. 2015. Annual report on road traffic fatal accidents and traffic law enforcement violations [in Japanese]. http://www.npa.go.jp/toukei/index.htm#koutsuu.
- Kitajima S, Yamaguchi N, Takatori O, Uchida N, Ota H, Adachi A. 2017. Development of simulation for estimation of multiple effects to prevent traffic accident by diffusion of advanced driver assistance system and automated vehicle–Analysis of relationship between driver’s characteristics and driver behavior for adequate modeling. Paper presented at the Proceedings of 26th JSME Conference on Transportation and Logistics (TRANSLOG2017).
- Kiuchi T, Katsumata S, Nishimoto T, Ito S, Saito N. 2016. Study on performance evaluation of D-Call Net Algorithm using HELPNET data. Paper presented at the JSAE Annual Congress (Autumn), Proceedings.
- Kusano KD, Gabler HC. 2012. Safety benefits of forward collision warning, brake assist, and autonomous braking systems in rear-end collisions. IEEE Trans Intell Transp Syst. 13(4):1546–1555.
- Lindman M, Nyström J, Jakobsson L, Ödblom A. 2012. Monitoring the past and the future of a passenger car auto brake system. Paper presented at the Proc. of IRCOBI Conference on Biomechanics of Impacts.
- Markkula G, Romano R, Madigan R, Fox CW, Giles OT, Merat N. 2018. Models of human decision-making as tools for estimating and optimizing impacts of vehicle automation. Transp Res Rec. 2672(37):153–163.
- Mori H, Kurahashi T, Iwase T, Machida T, Kozato A, Yamashita M, Kitaoka H. 2009. Modeling of pedestrian behavior for evaluating safety systems. J Inf Process Soc Jpn. 50(12):3175–3185.
- Nakamura S, Hayashi R, Kitajima S. 2017. Measurement and analysis of road crossing behaviors of pedestrians in a street without crosswalk by experiments. Paper presented at the Proceedings of 26th JSME Conference on Transportation and Logistics (TRANSLOG2017).
- Papadoulis A, Quddus M, Imprialou M. 2019. Evaluating the safety impact of connected and autonomous vehicles on motorways. Accid Anal Prev. 124:12–22.
- Rosen E. 2013. Autonomous emergency braking for vulnerable road users. Paper presented at the Proceedings of IRCOBI conference.
- SAE International. 2018. J3016: Taxonomy and definitions for terms related to on-road motor vehicle automated driving systems: SAE Standard J.
- Sander U. 2018. Predicting safety benefits of automated emergency braking at intersections-virtual simulations based on real-world accident data [dissertation]. Gothenburg, Sweden: Chalmers University of Technology.
- Sander U, Lubbe N. 2018. Market penetration of intersection AEB: characterizing avoided and residual straight crossing path accidents. Accid Anal Prev. 115:178–188.
- Sternlund S, Strandroth J, Rizzi M, Lie A, Tingvall C. 2017. The effectiveness of lane departure warning systems—a reduction in real-world passenger car injury crashes. Traffic Inj Prev. 18(2):225–229.
- Westerhuis F, De Waard D. 2017. Reading cyclist intentions: can a lead cyclist’s behaviour be predicted? Accid Anal Prev. 105:146–155.
- Yuhara N, Tajima J. 2006. Multi-driver agent-based traffic simulation systems for evaluating the effects of advanced driver assistance systems on road traffic accidents. Cogn Tech Work. 8(4):283–300.