
Abstract
Objective: When 2 vehicles of different sizes collide, the occupants of the smaller vehicle are more likely to be injured than the occupants of the larger vehicle. The larger vehicle is both more protective of its own occupants and more aggressive toward occupants of the other vehicle. However, larger, heavier vehicles tend to be designed in ways that amplify their incompatibility with smaller, lighter vehicles (by having a higher ride height, for example). A 2012 study by the Insurance Institute for Highway Safety (IIHS) concluded that fatalities caused by design incompatibility have decreased in recent years. The current study was conducted to update the 2012 IIHS analysis and to explore trends in vehicle incompatibility over time.
Methods: Analyses examined deaths in crashes involving 1- to 4-year-old passenger vehicles from 1989 to 2016 collected from the Fatality Analysis Reporting System (FARS). Trends in driver risk were examined by comparing driver death rates per million registered vehicle years across vehicle type and size. Trends in aggressivity were examined by comparing partner driver death rates across vehicle type and size.
Results: Cars and SUVs have continued their trend toward reduced incompatibility. In 1989–1992, SUVs were 132% more likely to kill the driver in a partner car compared with when a car crashed with another car. By 2013–2016, this value had dropped to 28%. Pickups and cars remain just as incompatible in 2013–2016 as they were in 1989–1992, however (159% vs. 158%). Remaining pickup incompatibility may be largely due to excess curb weight rather than to shape or design features, because light pickups were just 23% more likely to kill the driver in a partner car compared with when a car crashed with another car.
Conclusions: The trend toward reduced fleet incompatibility has continued in the latest crash data, particularly for cars and SUVs. Although pickup–car incompatibility has also decreased over time, pickups remain disproportionately aggressive toward other vehicles, possibly due to their greater average curb weight. Reducing the weight of some of the heaviest vehicles and making crash avoidance technology fitment more widespread may be promising means to reduce remaining fleet incompatibility. Identifying the source of remaining incompatibility will be important for safety improvements going forward.
Introduction
Vehicle incompatibility refers to energy mismanagement during a crash that produces an uneven distribution of injury risk across the 2 vehicles involved. Many factors influence the degree to which 2 vehicles are incompatible, but one key factor is vehicle weight (Robertson and Baker Citation1976). Heavier vehicles, in addition to being safer for their drivers, are more dangerous to the drivers of vehicles that crash with them (Ossiander et al. Citation2014a). This imbalance is governed by the conservation of momentum; a lighter vehicle will experience greater acceleration in a crash compared with a heavier crash partner vehicle.
Although cars can be incompatible with other cars, and likewise for SUVs and pickups, the majority of incompatibility occurs between vehicle types rather than within them. In the year 2000, for example, SUVs and pickups accounted for just one third of the fleet but crashes between these vehicles and cars accounted for more than half of all fatalities (Gabler and Hollowell Citation2000). Incompatibility between vehicle types is often related to curb weight imbalances; in 2013–2016, the average SUV and pickup were approximately 1,000 and 2,000 pounds heavier than the average car, respectively (Insurance Institute for Highway Safety [IIHS] analysis of data obtained from IHS Markit). Design features that differ by vehicle type also contribute to fleet incompatibility. In particular, a vertical misalignment between energy-absorbing structures can produce crashes where one or both vehicles fail to engage their primary energy-absorbing structures (Baker et al. Citation2008). For these reasons, substantial research and engineering attention has been devoted to the issue of reducing incompatibility between cars, SUVs, and pickups.
Fatalities caused by design incompatibility have decreased in recent years, due in large part to a voluntary commitment among automakers in 2009 that standardized the height of energy-absorbing structures across all vehicles (Alliance of Automobile Manufacturers Citation2003). Research has validated the efforts undertaken in this agreement, finding that the car fatality rate was 19% lower in frontal crashes when the partner vehicle complied with these guidelines than when it did not (Baker et al. Citation2008). Another tenet of this agreement—mandatory side airbag fitment—further reduced the human cost of incompatibility in the fleet (McCartt and Kyrychenko Citation2007). As a result of these improvements, both pickups and SUVs have become less incompatible with cars. However, recent research by IIHS found that although progress was made immediately following the agreement, pickups have lagged behind SUVs in terms of their incompatibility with smaller vehicles (Teoh and Nolan Citation2012).
The most recent examination by the IIHS (Teoh and Nolan Citation2012) found that pickups remain disproportionately likely to inflict injury on drivers of crash partner vehicles. Other research has found similar results, with one such study finding that full-size pickups were more than 3 times as likely to kill the driver of a crash partner compared with a mid-sized car (Ossiander et al. Citation2014a). The current study was therefore conducted for 3 reasons: First, to update the incompatibility estimates from earlier research; second, to estimate the extent to which vehicle compatibility has changed between 1988 and 2016; and third, to characterize the relevance of vehicle weight for driver protection and vehicle aggressivity in modern vehicles.
Methods
Crash data were extracted from the Fatality Analysis Reporting System (FARS) for 7 4-year intervals: 1989–1992, 1993–1996, 1997–2000, 2001–2004, 2005–2008, 2009–2012, and 2013–2016. Crashes were included if (1) they involved exactly 2 vehicles, (2) there was at least one driver fatality, and (3) at least one vehicle was between 1 and 4 years old. Vehicle registration data by make, model, model year, and calendar year were obtained from IHS Markit.
Data reduction
The raw data set contained one row per vehicle (i.e., 2 rows per crash). Each vehicle was coded for its type—car, SUV, or pickup—and its weight (of the base model), rounded to the nearest 500-pound increment. Partner vehicle variables were added to each row to represent the vehicle type of the crash partner vehicle and whether the driver of that vehicle was killed in the crash. The data set was then narrowed to only include rows where the primary vehicle was 1 to 4 years old and the partner vehicle was a car. The focus on car partner vehicles was adopted to increase the comparability between vehicle types in case partner vehicle type varied by primary vehicle type. Furthermore, because cars tend to be smaller and lighter than other vehicle types, these drivers tend to be placed at the greatest disadvantage with regard to crash outcomes. By focusing on crashes where partner vehicles are cars, we are able to estimate the aspect of vehicle incompatibility that has been identified by researchers and automakers as the most problematic (Gabler and Hollowell Citation2000; Baker et al. Citation2008; Teoh and Nolan Citation2012).
The data were then collapsed by vehicle type and vehicle weight for each of the 7 4-year intervals. The collapsed data set contained the number of fatalities—both for primary driver and partner driver—associated with each vehicle type and weight. Each vehicle type and weight combination was also paired with their primary vehicle registration years. Registration years represent the number of years that a given vehicle has been owned and operated, serving as a proxy for vehicle miles traveled. The number of fatalities for each driver in the crash pair was divided by the number of primary vehicle registration years to calculate case death rate and partner death rate. Case death rate is the death rate for drivers of 1- to 4-year-old vehicles after crashing with a car and partner death rate is the death rate for partner car drivers in these crashes.
Analysis
Incompatibility between 2 vehicles in a crash was defined as an uneven distribution of injury risk that resulted from one vehicle imperiling the occupants of the other. The current study quantified incompatibility by comparing the partner death rate of SUVs and pickups with that of cars at each 4-year interval. Because past research (e.g., Teoh and Nolan Citation2012) found that SUVs and pickups were more likely to kill car crash partners than other cars were, incompatibility between these vehicles was said to have decreased to the extent that partner death rates for SUVs, pickups, and cars became more similar over the study period. In other words, if SUV and pickup partner death rates decrease faster than car partner death rates, incompatibility has decreased. It should be noted that partner death rate cannot be understood as a one-to-one representation of vehicle aggressivity because it is affected by a number of other factors that vary systematically by vehicle type. For example, pickups are driven in rural areas more frequently than other vehicle types are, and rural crashes tend to produce more severe injury outcomes than urban crashes (e.g., Zwerling et al. Citation2005; Hao and Kamga Citation2017). Therefore, the current data were used to draw conclusions about changing relative differences over time rather than absolute differences at each time point.
Injury risk can also be unevenly distributed in a crash if one vehicle is more protective than the other, but the current study focused on partner death rate as the primary variable driving incompatibility. The protectiveness of each vehicle type (a primary factor driving case death rate) was considered a secondary outcome and was also quantified by calculating a percentage change from SUV and pickup case death rates to car case death rates for each 4-year interval.
Case death rate and partner death rate were examined in 2 ways: First, while considering all vehicles and, second, while considering only those vehicles weighing between 3,500 and 4,000 pounds. The former analysis represents the combined effects of weight and design incompatibility and the latter represents the effect of design incompatibility (largely) independent of weight incompatibility.
Results
Case and partner death data by vehicle type and year can be found in the Appendix (Table A1, see online supplement). Graphs depicting trends in raw death rates per million registration years for drivers and crash partners are also provided in the Appendix (Figures A1 and A2, see online supplement).
Figure 1. Partner death rate of SUVs and pickups relative to partner death rate of cars, 1989–2016.
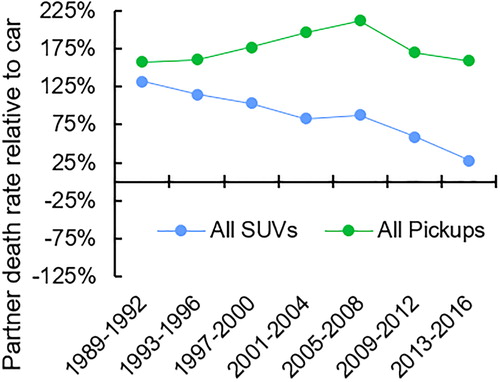
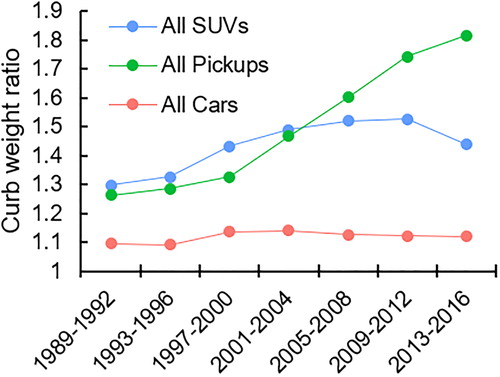
Figure 2. Average curb weight ratio between case and car partner vehicles, 1989–2016.
Partner death rate
For all years studied, SUV and pickup partner death rates were higher than car partner death rates. However, SUVs have become less aggressive relative to cars over the course of the study period. The partner death rate discrepancy between SUVs and cars in the latest sample shrank to about one fifth of the size that it was in 1989–1992, with the majority of this reduction occurring between 2009 and 2016 (). Pickups, in contrast, became gradually more aggressive relative to cars between 1989 and 2008, and their aggressivity only began to decrease in 2009–2012. In sum, the most recent data suggest that though SUV aggressivity is lower than it ever was, pickup aggressivity has not substantially decreased since 1989–1992.
Curb weight is a major factor in vehicle aggressivity, and pickups and SUVs tend to be heavier than cars (). Therefore, one would expect the difference in partner death rates between cars and pickups/SUVs to be smaller when restricting the analysis to include vehicles that are similar in weight to the average car. The extent to which pickups and SUVs are more similar to cars when they are weight restricted is suggestive of the effect that curb weight has on aggressivity for each vehicle type. Analyzing light vehicles separately also shows us whether reductions in incompatibility over time have occurred equally within all weight classes for each vehicle type.
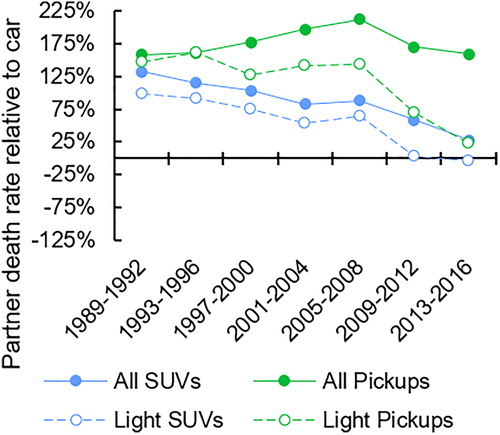
Excluding the heaviest pickups substantially reduced the partner death rate discrepancy between pickups and cars (). The partner death rate for pickups between 3,500 and 4,000 pounds was just 23% higher than that for cars of a similar weight in 2013–2016 (compared with +159% observed in the entire sample, a decrease of 136 percentage points). Furthermore, although the overall partner death rate for pickups has remained constant over the study period, the partner death rate for light pickups in 2013–2016 shrank to less than one sixth of its value in 1989–1992. Excluding the heaviest SUVs also reduced discrepancies in partner death rate, albeit by a smaller amount: From +28% to −4% (32 percentage points). The reduction in the partner death rate discrepancy that resulted from restricting curb weight in the latest crash data—particularly for pickups—suggests that weight differences between vehicle types is a primary contributor to fleet incompatibility. That is, because vehicles were the most incompatible when their weights differed and, conversely, vehicles of the same weight were relatively more similar with respect to their aggressivity, a portion of remaining incompatibility likely stems from differences in curb weight.
Figure 3. Partner death rate of 3,500- to 4,000-pound SUVs and pickups relative to partner death rate of similar-weight cars, 1989–2016. Solid lines represent the same effect for the whole sample (i.e., data from ).
Case death rate
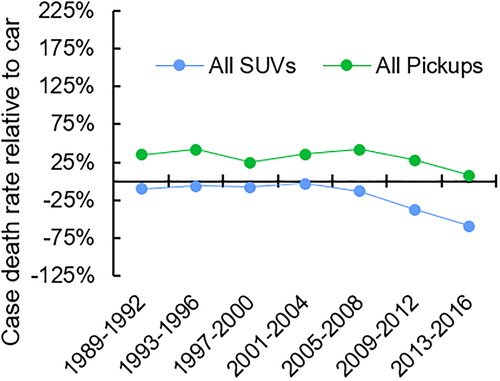
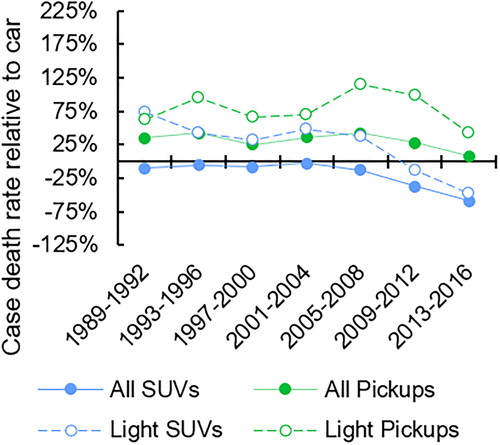
For all years studied, the case death rate for SUVs was lower than that for cars; the reverse was true for pickups. Although vehicles of all types have grown steadily safer over time, the decrease in case death rate that occurred between 1989 and 2008 was comparable across cars, SUVs, and pickups. (Note the relatively flat lines for SUV and pickup case death rates between 1989 and 2008 in .) In 2009, however, the case death rate for pickups and SUVs began to decrease at a faster rate than that for cars.
Figure 4. Case death rate for SUVs and pickups relative to that for cars, 1989–2016.
In addition to increasing aggressivity, greater curb weight is traditionally associated with greater vehicle protectiveness (e.g., Ossiander et al. Citation2014a). Like aggressivity, the effect that curb weight has on vehicle protectiveness can be estimated by comparing all pickups and SUVs with light pickups and SUVs. The latest data suggest that curb weight is less protective today than it once was (). In the 2005–2008 interval, restricting the analysis to lighter pickups increased the case death rate by 74 percentage points (from +42% to +116%). In the 2013–2016 interval, however, this gap was less than half of that value, because light pickups were only slightly less safe compared with the entire sample (+8% vs. +43%). Similarly, the increase in case death rate that occurred when considering only light SUVs was 51 percentage points in 2005–2008 (from −13% to +38%) but only 12 percentage points in 2013–2016 (from −59% to −47%). In sum, although curb weight was still related to greater vehicle aggressivity in the latest crash data, it had a relatively minor effect on case death rate compared with past years.
Figure 5. Case death rate for 3,500- to 4,000-pound SUVs and pickups relative to that for similar-weight cars, 1989–2016. Solid lines represent the same effect for the whole sample (i.e., data from ).
Discussion
The current study found that the trend toward reduced vehicle incompatibility has continued in the latest fatal crash data. When characterizing incompatibility as unevenly distributed injury risk, fleet incompatibility will produce an unequal crash partner death rate across vehicles. Thus, reduced differences in partner death rates over time across vehicle types are indicative of improved fleet compatibility. Under this conceptualization, pickup and SUV incompatibility toward cars has decreased in the latest crash data. In particular, SUVs are nearly 5-fold less aggressive relative to cars than they were in 1989–1992. Although overall pickup incompatibility has not changed over this period, light pickups have experienced a similar decrease in aggressivity toward cars. The relationship between curb weight and incompatibility observed in the current study is consistent with past research that has shown curb weight to predict partner fatality risk (e.g., Teoh and Nolan Citation2012; Ossiander et al. Citation2014a).
The reduction in case death rate associated with pickups and SUVs—which had been largely equivalent to that associated with cars—began to accelerate in 2009 (the year in which voluntary rules on vehicle compatibility were adopted by automakers). Unlike aggressivity, however, case death rate was not strongly associated with curb weight. In fact, the relative safety benefit of curb weight in the latest crash data was less than half of what it was a decade earlier. The diminishing marginal benefit of curb weight is consistent with past research that found mass reduction to only increase the fatality rate for light (i.e., <3,106 lbs) vehicles; mass reduction in heavier vehicles may therefore be risk-neutral and might even reduce the number of societal fatalities (Kahane Citation2012).
The spread of advanced occupant protection systems should help to mitigate the effects of vehicle incompatibility in the future, because crash avoidance systems reduce speed at impact (and therefore the force exchanged between vehicles), and improvements to airbags and other passive systems reduce the forces ultimately delivered to occupants (Brannstrom et al. Citation2010; Batra et al. Citation2017). Remaining fleet incompatibility between pickups and cars should also decrease as older vehicles not meeting the guidelines of the Enhancing Vehicle Compatibility (EVC) group continue to be phased out (Teoh and Nolan Citation2012).
The number of fatalities associated with a particular vehicle may be influenced by several factors in addition to its design and curb weight. The environment in which the vehicle is driven, the characteristics of the drivers prone to purchasing it, and the properties of the crashes it tends to become involved in all affect the likelihood that a fatality will result. Because of the potential for unmeasured confounds, the current study used relative differences in case and partner death rates (i.e., relative changes over time) to estimate changing vehicle incompatibility. Follow-up research may consider testing the degree to which each of these factors contributes to absolute levels of vehicle incompatibility.
Incompatibility in the fleet is also difficult to characterize because design features vary both between and within vehicle classes. Many SUVs, for example, are designed with unibody construction common in cars, whereas others are built body-on-frame similar to pickup trucks; the latter tend to be more incompatible with cars compared with the former (Ossiander et al. Citation2014b). It is also difficult to characterize the effect of weight independent of size, because the 2 variables are highly collinear (i.e., large vehicles are also heavy). Lastly, because the analyses contained in the current study spanned decades, several variables have undergone substantial changes, including occupant belt use, fitment of electronic stability control, and other general improvements to fleet crashworthiness and vehicle design. Future research may consider the role of these variables in how incompatibility has changed over time.
Supplemental Material
Download Zip (93 KB)Additional information
Funding
Related Research Data
References
- Alliance of Automobile Manufacturers. 2003. Enhancing vehicle-to-vehicle compatibility: commitment for continued progress by leading automakers. Washington, DC: Alliance of Automobile Manufacturers, Association of International Automobile Manufacturers;
- Batra R, Nanda S, Singhal S, Singari R. 2017. Development of fuzzy based decision structure for automotive airbag control unit. Warrendale, PA: Society of Automotive Engineers. Technical Paper 2017-26-0349.
- Baker BC, Nolan JM, O’Neill B, Genetos AP. 2008. Crash compatibility between cars and light trucks: Benefits of lowering front-end energy-absorbing structure in SUVs and pickups. Accid Anal Prev. 40(1):116–125.
- Brannstrom M, Coelingh E, Sjoberg J. 2010. Model-based threat assessment for avoiding arbitrary vehicle collisions. IEEE Trans Intell Transport Syst. 11(3):658–669.
- Gabler HC, Hollowell WT. 2000. The crash compatibility of cars and light trucks. J Crash Prev Inj Control. 1:1–30.
- Hao W, Kamga C. 2017. Differences in rural and urban driver-injury severities in highway-rail grade crossing accidents. Int J Inj Control Saf Promotion. 24(2):174–182.
- Kahane CJ. 2012. Relationships between fatality risk, mass, and footprint in model year 2000-2007 passenger cars and LTVs. Washington, DC: National Highway Traffic Safety Administration. Report No. DOT HS 811 665.
- McCartt AT, Kyrychenko SY. 2007. Efficacy of side airbags in reducing driver deaths in driver-side car and SUV collisions. Traffic Inj Prev. 8(2):162–170.
- Ossiander EM, Koepsell TD, McKnight B. 2014a. Crash fatality and vehicle incompatibility in collisions between cars and light trucks or vans. Inj Prev. 20(6):373–379.
- Ossiander EM, Koepsell TD, McKnight B. 2014b. Crash fatality risk and unibody versus body-on-frame structure in SUVs. Accid Anal Prev. 70:267–272.
- Robertson LS, Baker SP. 1976. Motor vehicle sizes in 1,400 fatal crashes. Accid Anal Prev. 8(3):167–175.
- Teoh ER, Nolan JM. 2012. Is passenger vehicle incompatibility still a problem?. Traffic Inj Prev. 13(6):585–591.
- Zwerling C, Peek-Asa C, Whitten PS, Choi SW, Sprince NL, Jones MP. 2005. Fatal motor vehicle crashes in rural and urban areas: Decomposing rates into contributing factors. Inj Prev. 11(1):24–28.