
 ?Mathematical formulae have been encoded as MathML and are displayed in this HTML version using MathJax in order to improve their display. Uncheck the box to turn MathJax off. This feature requires Javascript. Click on a formula to zoom.
Abstract
Objective: The introduction of integrated safety technologies in new car models calls for an improved understanding of the human occupant response in precrash situations. The aim of this article is to extensively study occupant muscle activation in vehicle maneuvers potentially occurring in precrash situations with different seat belt configurations.
Methods: Front seat male passengers wearing a 3-point seat belt with either standard or pre-pretensioning functionality were exposed to multiple autonomously carried out lane change and lane change with braking maneuvers while traveling at 73 km/h. This article focuses on muscle activation data (surface electromyography [EMG] normalized using maximum voluntary contraction [MVC] data) obtained from 38 muscles in the neck, upper extremities, the torso, and lower extremities. The raw EMG data were filtered, rectified, and smoothed. All muscle activations were presented in corridors of mean ± one standard deviation. Separate Wilcoxon signed ranks tests were performed on volunteers’ muscle activation onset and amplitude considering 2 paired samples with the belt configuration as an independent factor.
Results: In normal driving conditions prior to any of the evasive maneuvers, activity levels were low (<2% MVC) in all muscles except for the lumbar extensors (3–5.5% MVC). During the lane change maneuver, selective muscles were activated and these activations restricted the sideway motions due to inertial loading. Averaged muscle activity, predominantly in the neck, lumbar extensor, and abdominal muscles, increased up to 24% MVC soon after the vehicle accelerated in lateral direction for all volunteers. Differences in activation time and amplitude between muscles in the right and left sides of the body were observed relative to the vehicle’s lateral motion. For specific muscles, lane changes with the pre-pretensioner belt were associated with earlier muscle activation onsets and significantly smaller activation amplitudes than for the standard belt (P < .05).
Conclusions: Applying a pre-pretensioner belt affected muscle activations; that is, amplitude and onset time. The present muscle activation data complement the results in a preceding publication, the volunteers’ kinematics and the boundary conditions from the same data set. An effect of belt configuration was also seen on previously published volunteers’ kinematics with lower lateral and forward displacements for head and upper torso using the pre-pretensioner belt versus the standard belt. The data provided in this article can be used for validation and further improvement of active human body models with active musculature in both sagittal and lateral loading scenarios intended for simulation of some evasive maneuvers that potentially occur prior to a crash.
Introduction
Road traffic injuries and fatalities are serious health and economic issues worldwide (World Health Organization Citation2018). Integrated safety technologies in vehicles involving systems targeted at avoiding accidents or moderating accident severities and protecting vehicle occupants in a crash, have mainly been developed to reduce these issues (ASSESS EU FP7 project Citation2008). Being able to predict the human occupant response in both precrash—for example, either driver-induced or autonomous braking and steering maneuvers (Unselt et al. Citation2011)—and in-crash situations (Kumar et al. Citation2002, Citation2003, Citation2004) is crucial for assessment and further enhancement of these safety technologies. Human body models (HBM), mathematical tools that support the development of safety technologies, have been fitted with muscle control systems to provide for humanlike occupant response in precrash situations (Iwamoto et al. Citation2012; Östh et al. Citation2012, Citation2015; Subit et al. Citation2016). These models, referred to as active human body models (AHBMs), need to be validated with volunteer data, including body kinematics and muscle activities, in different and representative potential precrash loading scenarios.
Though volunteer data from experiments with sagittal plane loading are fairly available (Choi et al. Citation2005; Ejima et al. Citation2007, Citation2008; Behr et al. Citation2010; Ólafsdóttir et al. Citation2013; Östh et al. Citation2013), fewer studies have investigated volunteer responses in lateral plane loading. Among these studies, Muggenthaler et al. (Citation2005) provided generalized torso kinematics and the activity of 4 muscles for a volunteer passenger in a car that drove a path typical of a lane change. They found, among other things, a relationship between muscle activation and lateral vehicle acceleration. Other studies have indicated that occupant motion is dependent on muscle activity (Ejima et al. Citation2012; Huber et al. Citation2013; Van Rooij et al. Citation2013). Ejima et al. (Citation2012) exposed seated volunteers to lateral acceleration and found that pretension of muscles, by 20–60% of maximum muscle activation, resulted in a 20–40% decrease in head and T1 lateral flexion. Van Rooij et al. (Citation2013) compared the response of relaxed and braced subjects when exposed to purely lateral loading. They reported a significantly greater upper body sideway displacement and lower muscle activity for relaxed subjects. Huber et al. (Citation2013) performed a series of experiments with volunteers in a passenger seat of a car that was made to do lane change maneuvers to the right while they measured activity bilaterally from 3 neck muscles and 4 trunk muscles. The data indicated a substantially higher activation of the right-side muscles. Ólafsdóttir et al. (Citation2015) studied detailed neck muscle activity when volunteers were exposed to perturbation-type loading in 8 different directions. Their results showed that the recruitment pattern and neck muscle activity levels depend on the loading direction. Holt et al. (Citation2018) conducted a series of sled tests with a multi-swerving event on volunteers in different testing conditions. They studied safety countermeasures such as sculpted seat and inflatable torso bolsters on volunteers’ kinematics and activation of a few muscles.
These volunteer studies provided some understanding of the occupant kinematics and the activity of a limited number of muscles when the volunteers were subjected to lateral loading in a laboratory environment, though none have provided muscle activity data for volunteers traveling in a regular car and subjected to maneuvers including lane changes. Recently, Ghaffari et al. (Citation2018) provided passengers’ head and T1 displacement data and boundary conditions such as seat belt forces and position as well as vehicle dynamics for volunteers traveling in a regular car and exposed to lane changes and lane changes with braking maneuvers. The present article provides muscle responses of volunteers from the same study with the overall objective to provide data that enable the development and validation of AHBMs.
New vehicle models are provided with seat belts that can be pretensioned in a potential precrash phase, and these are reported to affect the volunteer response in braking events (Ólafsdóttir et al. Citation2013; Östh et al. Citation2013) and in lateral events (Ghaffari et al. Citation2018; Holt et al. Citation2018). However, no extensive muscle analysis was reported for in-vehicle lateral loading scenarios. Therefore, another objective of the present article is to provide occupants’ muscular responses during low-g autonomous vehicle maneuvers using 2 belt configurations. This article includes male passenger muscle activity in autonomous lane change and lane change with braking maneuvers using a 3-point seat belt in either an activated (henceforth “pre-pretensioner”) or a nonactivated (henceforth “standard”) configuration.
Methods
The use of human volunteers was approved by the Ethical Review Board at the University of Göteborg (Application 602-15). In brief, the test procedure for each volunteer was, firstly, measuring anthropometric data; secondly, instrumenting with electromyography (EMG) electrodes and measuring maximum voluntary contractions (MVCs); thirdly, mounting the film markers; and, finally, testing in a vehicle. The test vehicle, instrumentation, and data acquisition system applied to capture the vehicle dynamics, volunteer’s motion, and volunteer–vehicle interaction forces were described in details by Ghaffari et al. (Citation2018).
Volunteers and inclusion criteria
Ninety-two tests including 9 male volunteers (Table A.I in Appendix A, see online supplement) were included in this article according to the inclusion criteria for data analysis described in Ghaffari et al. (Citation2018). In addition to the referred criteria, all individual EMG data were studied. To provide more representative muscle responses, outliers that were at least 3 standard deviations greater than the mean value in the same loading scenario were excluded from calculation of the corridors. Both experimental documents (log files) and the recorded videos corresponding to the test cases with these outliers were investigated to check for possible reasons. If a clear rationale could be identified (a loose EMG electrode for one of the muscles in all tests for male 9 and a voluntary body motion observed in one test of male 9 that affected 4 of the muscle responses), those outliers were not shown in any graphs. For the remaining outliers no certain rationale could be identified; data suggest either different body reactions or suspected pressure artifacts on the EMG electrodes or poorly attached electrodes. Therefore, these muscle responses were plotted separately besides the corridors in Appendixes C–F (see online supplement).
Test cases
Four types of loading scenarios were repeated 3 times in a randomized order for each volunteer within a larger test series as explained in Ghaffari et al. (Citation2018). The lane change with standard belt is denoted LSB and included 25 tests (n = 25); the lane change with braking and with standard belt is denoted LBSB (n = 23); the lane change with a pre-pretensioner belt is denoted LPT (n = 24); and the lane change with braking and with pre-pretensioner belt is denoted LBPT (n = 20). Lateral and longitudinal vehicle accelerations were depicted in Ghaffari et al. (Citation2018).
EMG signal acquisition and processing
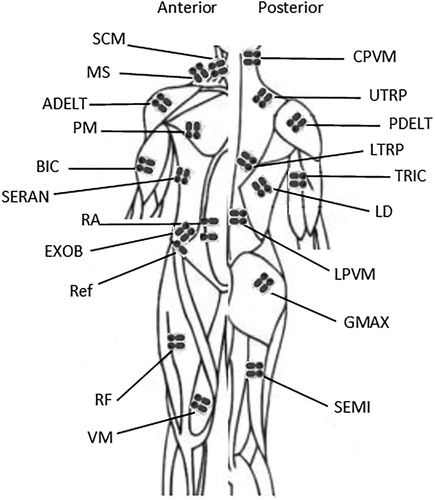
To record volunteers’ muscle activity, surface EMG (Ag/AgCl) electrodes (Blue Sensor N-00-S and Neuroline 720 prewired electrode 200 cm, Ambu A/S, Ballerup, Denmark) were placed on 19 muscles bilaterally (; Table A.II in Appendix A, see online supplement). Before application of the electrodes, the skin was prepared by shaving, abrading with sandpaper (P240), and wiping with diluted ethanol. EMG signals were recorded using a non-wireless g.HIamp (g.tec medical engineering GmbH, Austria) at 512 Hz, which was connected to a second SIRIUS SBOX computer set in slave mode (DEWESoft d.o.o., Slovenia). A very high internal sampling frequency used in g.HIamp (38.4 kHz) and its analog low pass filter with an attenuation level greater than 100 dB at 19.2 kHz ensured no destructive influence of the built-in filtering on EMG data.
Figure 1. Electrode placement on the anterior and posterior side of the body shown to the left and right, respectively. Muscle name abbreviations according to Table A.II.
Using MATLAB Ver. 2015a, the recorded EMG data were then filtered by a finite impulse response bandpass filter of order 200 for frequencies between 10 and 250 Hz to reduce the electrocardiography (ECG) contamination and high-frequency artifacts. Because the ECG signal may significantly influence EMG data collected in the vicinity of the heart, the lower cutoff frequency was increased to 50 Hz (Östh et al. Citation2013) for the EMG data recorded in the torso and abdominal areas. A 48- to 52-Hz second-order Butterworth notch filter was used to remove any noise generated by the AC power supply. The signal was rectified and then smoothed by a 40-ms moving average window as previously proposed (Östh et al. Citation2013). Furthermore, for each volunteer the amplitudes of the EMG signals were normalized to the maximum of any of the 3 MVCs carried out for the corresponding muscles.
Maximum voluntary contractions
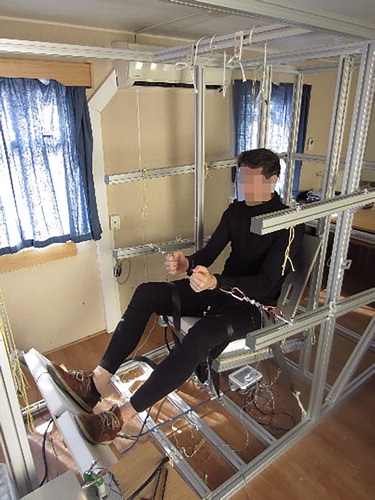
In the MVC tests, EMG data were recorded during maximum muscle tension in isometric conditions to facilitate normalization of the EMG data recorded during testing in vehicle. Volunteers were seated in a custom-made test rig with a wooden foot rest and padded wooden seatback and seat cushion, constructed and adjusted to provide a posture for the volunteer that resembled that of a passenger in a car seat (). Subjects were fitted with padded cuffs, a headband, or a chestband. They were attached to the test rig or contralateral cuff using cords during testing for each muscle or pair of muscles separately. To allow muscles to warm up prior to maximum contractions and the volunteers to become accustomed with the specific contraction to be done, the procedure suggested by Östh et al. (Citation2013) was adopted. Volunteers were asked to contract approximately 50% of maximum for 3 s and thereafter at maximum for 3 s. Three repetitions of MVCs were performed for each muscle tested. The muscles were tested in alternating pairs, right (R) and left (L), and rested for approximately 30 s between each repetition. The order of the series of MVC tests and descriptive pictures of different test postures are provided in Appendix B (Figures B.1–B.4, see online supplement).
Figure 2. MVC test rig with volunteer.
Data analysis
Data analysis was done in MATLAB Ver. 2015a. The onset of each individual maneuver, time 0, was determined according to the definition in Ghaffari et al. (Citation2018) and is approximately the time when lateral acceleration deviates from 0.
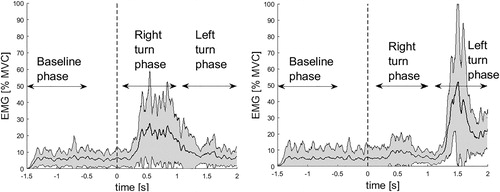
Data were analyzed for 3 phases: the baseline phase is defined as the period 1.5 to 0.5 s prior to time 0; the right turn phase is from 0.1 to 1 s relative time zero when lateral acceleration was positive; and the left turn phase is from 1.1 to 2 s relative time zero when lateral acceleration was negative.
For each loading condition, EMG response corridors were established using means and means ± 1 SD for all available test data excluding outliers. Based on a study of car occupant kinematics (Carlsson and Davidsson Citation2011), the existence of different volunteer reactions after maximum head excursion could be an indication of different muscle activation strategies. Therefore, in the present study, the muscle response corridors were scanned for the existence of 2 distinctly different behaviors; that is, level of muscle activation. For all combinations of grouped EMG data per muscle and type of maneuver, and a minimum of 5 tests in any of the groups, a factor (EquationEq. (1)(1)
(1) ), referred to as the N factor was calculated. Two separate response corridors was established when this N factor was equal or above 1.1 for at least 50 ms during either the right turn phase or left turn phase.
(1)
(1)
where is a function of time, mean and SD are the average and standard deviation, and 1 and 2 refer to groups 1 and 2, respectively.
A grand average of EMG values was defined as the average of the averaged EMG during each of the 3 defined phases for each loading scenario. The onset of muscle activity was determined as the beginning of a 50-ms window for which the averaged EMG data were 2.5 SD greater than the average of the EMG data for the baseline period (Hodges and Bui Citation1996; Sjödahl et al. Citation2016).
The Shapiro-Wilk test of normality was performed on data for EMG amplitude and onset time. The results revealed that data for some muscles were normally distributed, whereas those for some others were not. Therefore, to assess the statistical significance (probability less than .05) of the difference in muscle activation using a standard seat belt versus a pre-pretensioner seat belt in the performed maneuvers, probabilities between LSB and LPT and between LBSB and LBPT groups were calculated using nonparametric Wilcoxon signed ranks tests. The muscle activation amplitude and onset were averaged across repetitions per volunteer in each loading scenario. The data were considered as 2 paired samples; that is, the belt configuration was set as a factor with 2 levels: Standard and pre-pretensioning. The sample size was n = 9 except for a few cases of outliers or undetectable onset times that were removed from the statistical analysis because the Wilcoxon signed ranks test requires balanced data sets. Statistical analyses were performed on EMG activation level and onset time using IBM SPSS Statistics Ver. 22.
Results
Complete sets of EMG data corridors and EMG data deemed to be outliers for 4 types of loading scenarios (LSB, LPT, LBSB, and LBPT) are presented in Appendixes C–F. The most active muscles found in all types of loading scenarios were right and left lumbar paravertebral muscles (LPVM). The activity of this muscle during LSB maneuvers is illustrated in . The data indicate major activation of right LPVM muscle when steering was toward the right and major activation of the left LPVM when steering was toward the left.
Figure 3. The corridor of normalized EMG for right (n = 22) and left LPVM (n = 25) muscles (left and right panels, respectively) for LSB maneuver. Time 0 with onset of lateral acceleration is indicated by vertical dashed line. Time periods are indicated by baseline phase, right turn phase, and left turn phase.
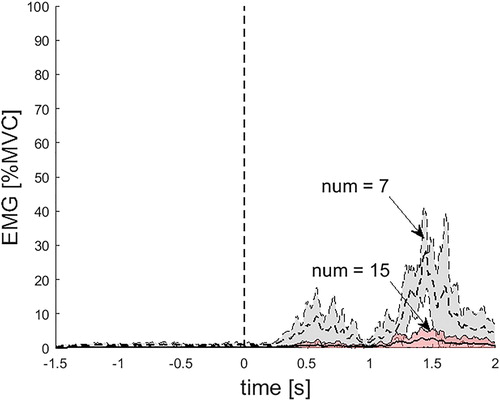
An example of the muscles whose corridors can be separated into 2 subgroups is left rectus femoris (RF) in the LSB maneuver, seen in . In 7 tests, the volunteers activated their left RF in the left turn phase 5 times more than the volunteers in the remaining 15 tests. Two subgroup corridors were generated for 3 muscles in LSB, 1 muscle in LPT, 3 muscles in LBSB, and 3 muscles in LBPT (Appendixes C–F). The muscles that commonly exhibited 2 distinctly different behaviors—that is, level of muscle activation—were left RF and left cervical paravertebral muscle (CPVM).
Figure 4. Two corridors of normalized EMG for the left RF in LSB maneuver. Time 0 with onset of lateral acceleration is indicated by vertical dashed line.
Grand average of EMG values
During the baseline phase, all muscles were activated less than 2% MVC on average, except for the lumbar extensor muscle LPVM (average 3–5.5% MVC). The activation levels in the baseline phase were similar for all load scenarios, indicating that the volunteers were in similar muscle states before the different events (Appendix G, see online supplement).
shows the grand average of EMG values for the LSB maneuvers. As can be seen in this figure, for the 5 muscles that were noticeably active on both sides, the right sides manifested higher activity during steering to the right and the left sides manifested higher activity during steering to the left. This pattern was also observed in 3 other maneuvers. During LBSB, in addition to the 5 muscles mentioned above, 2 muscles on the posterior side of the torso (lower trapezius [LTRP] and latissimus dorsi [LD]) and 4 muscles of the lower extremities (gluteus maximus [GMAX], semitendinosus [SEMI], RF and vastus medialis [VM]) were noticeably active.
Figure 5. Grand average and standard deviation of EMG for LSB maneuver during right turn phase and left turn phase (a and b respectively) for all muscles on the right (blue bars) and the left (yellow bars) sides.
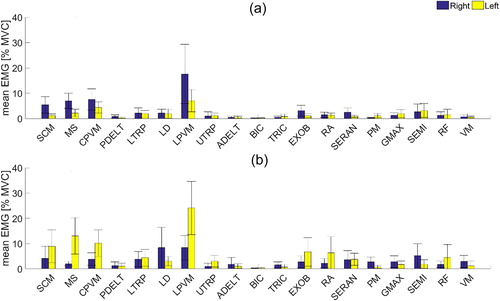
The results show that the LPVM muscles have the highest average activation levels during the right turn phase and left turn phase (12–24% MVC) for all maneuvers and the largest standard deviation (; Appendix G). The neck muscles (sternocleidomastoid [SCM], middle scalene [MS], CPVM), lumbar extensor muscles (LPVM), and abdominal muscles external oblique (EXOB) have noticeable activation of 3–24% MVC on both sides of the body (; Appendix G). Muscles in the upper extremities (posterior deltoid [PDELT], anterior deltoid [ADELT], biceps [BIC] and triceps [TRIC]) constantly had very low muscle activity (<2% MVC), whereas all other muscles showed either low activation (less than 3%) or up to 10% MVC on one side (; Appendix G).
The muscles with statistically significant differences (P < .05) between LSB and LPT as well as between LBSB and LBPT grand average EMG values in the right turn phase and left turn phase are separately marked in Tables G.I and G.II (see online supplement). They were distributed over all of the instrumented muscle groups except muscles of the abdomen (EXOB and rectus abdominis [RA]) in LSB versus LPT and muscles of the upper extremities and posterior torso (upper trapezius [UTRP], ADELT, BIC, TRIC, LTRP) in LBSB versus LBPT that did not fulfill the significance level criteria used for these comparisons. As seen in Tables G.I and G.II, the average EMG values for LSB and LBSB are greater than those of LPT and LBPT, respectively, for all muscles marked with significant differences.
EMG onset time
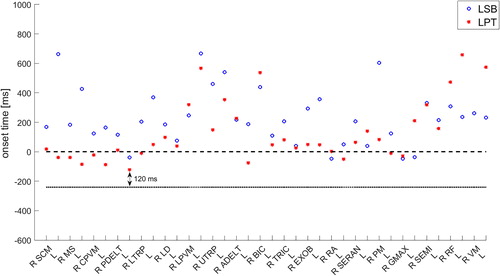
Average EMG onset time for the right turn phase significantly differed between LSB and LPT (). Specifically, the muscles that fulfilled our significance level criteria (P < .05) were right SCM, right LTRP, left UTRP, and right and left EXOB. As shown in , the onset time occurred later in the LSB than in the LPT maneuver in all muscles mentioned above. Furthermore, some EMG onsets indicated that muscle activation started before the lateral acceleration onset, at least 120 ms after activation of the pre-pretensioner belt () where the average belt pull-in was 39 mm. The same comparison of EMG onset time was done between LBSB and LBPT and the difference was statistically significant for left LTRP, right LD, and left EXOB (P < .05). Likewise, EMG onset time was studied for the left turn phase of the maneuvers but because the volunteers were in different postures in the beginning of the left turn phase after the first half of turning maneuver and muscle activation had been already begun in the right turn phase, the result was not meaningful.
Figure 6. Average EMG onset times showing 2 channels—that is, right (R) and left (L)—for each muscle during the right turn phase for LSB and LPT. Horizontal dashed line presents time 0 and the dotted line presents the onset time of the pre-pretensioner belt.
Discussion
This study provides EMGs that were normalized to MVC under isometric and posture-specific conditions. Although assessing MVCs requires time-demanding contraction tests for each muscle and is thus often avoided, it allows objective comparisons of normalized muscle activation levels between individuals in different maneuvers (Choi et al. Citation2005; Behr et al. Citation2010; Ólafsdóttir et al. Citation2013, Citation2015; Östh et al. Citation2013). An alternative to the use of MVC is to present unnormalized data (Muggenthaler et al. Citation2005; Huber et al. Citation2013) or to normalize the data using peak EMGs for the different maneuvers (Ejima et al. Citation2012; Van Rooij et al. Citation2013). The latter approach is dependent on the event and posture of the occupants and thus is not as accurate as isometric MVC data.
To distinguish different types of muscle reactions, EMG data were investigated in terms of their magnitude for each individual muscle and loading scenario. To the best of the authors’ knowledge, no previous study of volunteer responses has used the developed method to group data. In addition to the overall corridors, corridors of 2 subgroups were provided in this work (see Appendixes C–F). Comparing these subgroups of muscle activation to the kinematics data provided by Ghaffari et al. (Citation2018) indicates that for some cases the subgroups with greater levels of muscle activation belonged to the volunteers with greater head and/or torso kinematics, whereas for some other cases they belonged to the volunteers with lesser head and/or torso kinematics. This is in agreement with the broad kinematics corridors seen in Ghaffari et al. (Citation2018) and emphasizes the importance of interindividual differences. This also suggests that high muscle activation can be associated with either greater or lesser body displacement.
The muscle activity during the baseline phase are of importance both because they provide a background level to compare with the muscle activity during the maneuvers and because they can be used as input for active HBMs’ initial states. In line with previous studies (Ólafsdóttir et al. Citation2013, Citation2015; Östh et al. Citation2013;), all instrumented muscles had activity below 2% MVC during the baseline phase, except for the lumbar extensor muscles. The LPVMs are of importance to maintain posture and this may therefore explain their higher activity during the baseline phase. However, the higher level of activity might partially be due to the pressure artifacts from the backrest contact.
The lowest activations among all instrumented muscles were found in muscles of the upper extremities and were expected because passengers rest their arms on their lap and do not hold on to any interior vehicle structures. The muscles that displayed noticeable activation levels on both sides of the body were the neck muscles, lumbar extensor muscles, and abdominal muscles. SCM, MS, and CPVM muscles play important roles in head rotation. Based on kinematics data from Ghaffari et al. (Citation2018), head lateral flexion—that is, head rotation around the x-axis—was found as the main head rotation (on average 10° toward left). Slightly larger linear displacements for head than T1 were also seen in the kinematics data in all types of loading scenarios. These larger motions of the head compared to the torso, which was also reported by Holt et al. (Citation2018), can explain the existence of high activation levels in the neck muscles found in the present study in order to restrict the head relative to T1 motions. LPVM and EXOB are known to be involved in lumbar rotation and lateral flexion as well. Furthermore, the results showed that these muscles in the right side of the body manifest higher activity during the right turn phase, whereas these muscles in the left side of the body manifest higher activity during the left turn phase. According to the volunteers’ kinematics (Ghaffari et al. Citation2018), T1 and head excursions were mainly toward the left in the right turn phase and toward the right in the left turn phase. Therefore, the muscle activation pattern seen in the present study was opposite the torso movement. The same finding was also reported in Ejima et al. (Citation2012) and Huber et al. (Citation2013). As mentioned briefly, T1 and head lateral excursions were not completely symmetric in the right and left turn phases (Ghaffari et al. Citation2018). In general, larger displacements from the extreme left to the extreme right with less absolute maximum excursions relative to the neutral positions and higher average muscle activity were observed in the left turn phase compared to the right turn phase (Appendix G). The higher muscle activity can possibly be to restrict the body motion in order to avoid contact with the vehicle structures. In addition to the muscles mentioned above, 2 muscles on the posterior side of the torso and 4 muscles of the lower extremities showed significantly higher activity than baseline level in lane changes with braking. This can be due to larger forward displacements of the torso observed by Ghaffari et al. (Citation2018) in maneuvers with braking events than without. In conclusion, these muscles might be more activated to restrict body forward motions. According to the literature, LTRP acts as a scapular stabilizer; LD is involved in trunk rotation; GMAX, SEMI, and RF are involved in hip and knee rotation; and VM stabilizes the knee (Cram et al. Citation1998; SENIAM Citation2016). To summarize, different levels of co-contraction found in muscles were most probably for maintaining the posture against inertial loading during the vehicle maneuvers. In particular, co-contraction of several antagonistic muscles occurred as a way to stabilize joints. For instance, antagonist co-contraction of SCM and CPVM helps to stabilize the neck, antagonist co-contraction of ADELT and PDELT helps to stabilize the shoulder, co-contraction of RA and EXOB in contrast to LPVM helps to stabilize the trunk, and co-contraction of RF and VM in contrast to GMAX and SEMI helps to stabilize the hip and the knee.
An important finding of this study was the effect of pre-pretensioner versus standard belt on muscle activity level and onset time. The pre-pretensioner belt caused a significant decrease (P < .05) in the activation level of specific muscles all over the body, such as LPVM muscles in lane changes and RF muscles in lane changes with braking. This effect was not investigated in the previous study of passenger volunteers in sagittal loading (Ólafsdóttir et al. Citation2013). However, it was also seen in the kinematics data (Ghaffari et al. Citation2018) from the same study that the pre-pretensioner belt caused lower head and T1 lateral and forward mean displacements compared to the standard belt. Consequently, the lower muscle activity level presented here can partly be explained by the fact that the body is more restricted when using a pre-pretensioner belt, whereas the standard belt allows the body to move more freely and therefore muscles need to be more contracted to restrict excessive movements. In general, the usage of the pre-pretensioner belt led to earlier muscle activation onset times than the standard belt (), and for specific muscles these differences were statistically significant. This is in agreement with previous studies on braking maneuvers (Ólafsdóttir et al. Citation2013; Östh et al. Citation2013). All muscles with significantly earlier onset times were from the upper body. Among these muscles, SCM originates at the manubrium and medial portion of the clavicle, UTRP and LTRP muscles are attached to the clavicle, and EXOB abdominal muscles are attached to the iliac crest. However, it is unknown whether the load applied by the pre-pretensioner belt was mainly on the clavicle or distributed on the larger part of the torso. Activation of the diagonal belt led to pulling back the volunteer’s upper body at around 200 ms before time 0 until reaching the target tension (170 N) at approximately time 0. Because some muscles were activated before the onset of vehicle acceleration, they were not invoked by the loading due to acceleration; instead, they were activated from around 120 ms after belt activation. Therefore, earlier onset times can be partly linked to tactile stimuli as suggested in Östh et al. (Citation2013) and Ólafsdóttir et al. (Citation2013), although it is generally difficult to distinguish any startle response in the EMG data because of the possible superimposition of the muscle activity driven by the volunteers’ postural adjustments, particularly in the very first repetition of the events (Oude Nijhuis et al. Citation2009, 2010). Considering the kinematic response of the present volunteers (Ghaffari et al. Citation2018), a slightly backwards displacement was noticed in their head and upper torso, potentially due to the activation of the pre-pretensioner belt before the onset of vehicle acceleration. The volunteers might also have received some cues to tense their muscles; for instance, by hearing the sound produced by the braking robot system just prior to its activation. Using enhanced sound-isolated robot systems can help to exclude the possibility of this type of anticipation in future volunteer studies.
Although the study by Holt et al. (Citation2018) was different from this study because the acceleration applied in their study was composed of 4 cycles of oscillation with a frequency of 0.5 Hz at 0.75 g, the muscle data were averaged over all cycles, their experiment was conducted in a laboratory environment, and a smaller number of muscles were investigated, our results confirm previous findings on the pre-pretensioner leading to less body motions than the standard belt and decreased muscle activities. They found the same kinematic results using a pre-pretensioner as in a braced posture but less activity in right bicep and trapezius muscles. Therefore, despite the differences between the 2 studies, both investigated volunteer responses in lateral loading conditions with similar peak vehicle/sled accelerations and the results presented here are comparable and consistent with the previous results.
There were some limitations to the study presented here. First, a general limitation with studying EMG signals collected near the heart is the removal of ECG contamination in the following data analysis. The frequency spectrum of the surface EMG is generally within 10–500 Hz with the most power between 20 and 200 Hz, whereas the spectrum of a normal ECG is up to 100 Hz with the most power below 35 Hz (Drake and Callaghan Citation2006). Hence, the ECG overlaps the lower end of the EMG spectrum. Filtering frequencies below 50 Hz of the EMG signals recorded in the torso and abdominal areas, which was used in this study to eliminate the main ECG contamination, partly led to unavoidable loss of EMG data. In addition, all types of filtering such as the notch filtering used here to remove the noise induced by the AC power supply have some influence on data both in frequency and in time domains, but because all signals were treated and processed using the same filters, the effect of filtering was equal for all signals. Second, all vehicle maneuvers presented here were conducted and repeated in a randomized order to reduce the risk of systematic errors due to, for instance, habituation in one specific maneuver. Accordingly, for the statistical analysis of the effect of belt configuration on muscle activation, the data were averaged across the existing repetitions per volunteer in each loading scenario. However, there might also be an effect of habituation between the 3 repetitions (Blouin et al. 2003) that can be subject to future statistical analyses. Third, another limitation associated with the present statistical analysis was the small sample size of 9 subjects. However, a nonparametric statistical method, the Wilcoxon signed ranks test, which is independent of data distribution and is adequate for small samples (Marques de Sá 2007), was chosen to avoid making conclusions based on assumptions such as normality that could be violated.
Furthermore, to develop models of female occupants, studies on female volunteer data are essential. In fact, muscle responses, body kinematics, and volunteers’ behavior in response to various loading scenarios might be affected by gender due to physiological differences. For instance, Seacrist et al. (Citation2012) showed significant differences in cervical spine flexion between males and females exposed to a maximum 1 g inertial loading in the posterior–anterior direction when the neck musculature was relaxed. A simulation study by Sato et al. (Citation2017) also suggested that variations found in thoracic spinal alignment by gender had a potential impact on cervical spine motion in rear-end impact conditions. So far, the developed female models (Östh et al. Citation2016, Citation2017) were based on a limited number of female subjects. The focus of the present work was only on data from male participants. Data collected from female participants will be analyzed and presented in a future paper.
In addition to gender, other factors such as age, stature, and body mass index (BMI) can possibly affect the volunteer responses in precrash situations and in response to the seat belt configuration. For instance, Jones et al. (Citation2017) showed that anatomical and physiological variations could alter the seat belt fit for males and females with high BMIs, which can increase the risk of traffic injury. A simulation study on morphed HBMs of different ages, statures, and BMIs also showed that occupant characteristics can affect injury risk in frontal crashes (Hu et al. Citation2016). However, to the best of the authors’ knowledge, there are not many published studies investigating the impact of age and body size on volunteer kinematics and muscle responses in potential precrash situations, with the exception of a quantitative study by Reed et al. (Citation2018). They found, among other things, smaller forward head excursions in braking events for passengers who were older and those who had higher BMIs.
Age and stature for the volunteers included in the present work were in the range 23–71 years old and 174–192 cm, respectively, and their BMIs were essentially within normal weight range (18–23), though data from volunteers with higher BMIs were also collected. Future studies on population heterogeneity and regression analysis of volunteer responses in potential precrash scenarios are needed to understand whether there are significant differences due to these variations.
A comparison between the simulation results of AHBMs with muscle control and this new volunteer data set in lateral loading scenarios with and without a pre-pretensioner seat belt needs to be addressed in future studies. Such a comparison but with volunteer data collected in longitudinal loading scenarios was conducted by Östh et al. (Citation2015) and allowed for additional parametric study on which seat belt pretension force level and timing were varied to find the best parameters for reducing body movement in braking scenarios. In summary, the volunteers’ muscles data presented in this study and the volunteers’ kinematics from the same data set as well as the boundary conditions presented in Ghaffari et al. (Citation2018) complement each other to reach the goal of providing a complete validation data set for AHBMs in lane change and lane change with braking scenarios. Validation of the AHBMs with active musculature against the volunteer data will enhance the possibility of predicting human behavior in some representative potential precrash scenarios presented in this study.
Supplemental Material
Download MS Word (2.2 MB)Acknowledgment
The authors thank all participants in the tests and our colleagues at Autoliv Research and Volvo Cars. Special thanks to Associate Professor Mordkoff for his guidance on the statistical analysis used in this study and Professor Svensson for his consistent support.
Additional information
Funding
Related Research Data
References
- ASSESS EU FP7 Project. 2008. Assessment of Integrated Vehicle Safety Systems for Improved Vehicle Safety. SST.:233942. 4.1.1: Available at: http://www.assess-project.eu. Accessed March 29, 2018.
- Behr M, Poumarat G, Serre T, Arnoux PJ, Thollon L, Brunet C. 2010. Posture and muscular behaviour in emergency braking: An experimental approach. Accid Anal Prev. 42(3):797–801.
- Blouin JS, Descarreaux M, Bélanger‐Gravel A, Simoneau M, Teasdale N. 2003. Attenuation of human neck muscle activity following repeated imposed trunk‐forward linear acceleration. Exp Brain Res. 150(4):458–464.
- Carlsson S, Davidsson J. 2011. Volunteer occupant kinematics during driver initiated and autonomous braking when driving in real traffic environments. Paper presented at: International Research Council on Biomechanics of Injury (IRCOBI); September 14-16, Krakow, Poland.
- Choi HY, Sah SJ, et al. 2005. Experimental and numerical studies of muscular activations of bracing occupant. Paper presented at: International Technical Conference on the Enhanced Safety of Vehicles (ESV); June 6-9, Washington, DC.
- Cram JR, Kasman GS, Holtz J. 1998. Introduction to surface electromyography. Gaithersburg, MD: Aspen Publishers Inc.
- Drake JDM, Callaghan JP. 2006. Elimination of electrocardiogram contamination from 20 electromyogram signals: An evaluation of currently used removal techniques. J Electromyogr Kinesiol. 16(2):175–187.
- Ejima S, Ito D, et al. 2012. Effects of pre-impact swerving/steering on physical motion of the volunteer in the low-speed side-impact sled test. Paper presented at: International Research Council on Biomechanics of Injury (IRCOBI); September 12-14, Dublin, Ireland.
- Ejima S, Ono K, Holcombe S, Kaneoka K, Fukushima M. 2007. A study on occupant kinematics behaviour and muscle activities during pre-impact braking based on volunteer tests. Paper presented at: International Research Council on Biomechanics of Injury (IRCOBI); September 19-21, Maastricht, the Netherlands.
- Ejima S, Zama Y, Satou F, Holcombe S. 2008. Prediction of the physical motion of the human body based on muscle activity during pre‐impact braking. Paper presented at: International Research Council on Biomechanics of Injury (IRCOBI); September 17-19, Bern, Switzerland.
- Ghaffari G, Brolin K, et al. 2018. Passenger kinematics in Lane change and Lane change with Braking Manoeuvres using two belt configurations: standard and reversible pre-pretensioner. Paper presented at: International Research Council on Biomechanics of Injury (IRCOBI); September 12-14, Athens, Greece.
- Hodges PW, Bui BH. 1996. A comparison of computer-based methods for the determination of onset of muscle contraction using electromyography. Electroencephalogr Clin Neurophysiol. 101(6):511–519.
- Holt C, Douglas E, et al. 2018. Effect of Countermeasures on Adult Kinematics during Pre‐Crash Evasive Swerving. Paper presented at: International Research Council on Biomechanics of Injury (IRCOBI); September 12-14, Athens, Greece.
- Hu J, Fanta A, Neal MO, Reed MP, Wang JT. 2016. Vehicle crash simulations with morphed GHBMC human models of different stature, BMI, and age. Paper presented at: International Digital Human Modeling Conference (DHM); June 15-17, Montreal, Canada.
- Huber P, Christova M, et al. 2013. Muscle Activation Onset Latencies and Amplitudes during Lane Change in a Full Vehicle Test. Paper presented at: International Research Council on Biomechanics of Injury (IRCOBI); September 11-13, Gothenburg, Sweden.
- Iwamoto M, Nakahira Y, Kimpara H, Sugiyama T, Min K. 2012. Development of a human body finite element model with multiple muscles and their controller for estimating occupant motions and impact responses in frontal crash situations. Stapp Car Crash J. 56:231–268.
- Jones MLH, Ebert S, Hu J, Reed MP. 2017. Effects of high levels of obesity on lap and shoulder belt paths. Paper presented at: International Research Council on Biomechanics of Injury (IRCOBI); September 13-15, Antwerp, Belgium.
- Kumar S, Ferrari R, Narayan Y. 2004. Electromyographic and kinematic exploration of whiplash-type neck perturbations in left lateral collisions. Spine. 29(6):650–659.
- Kumar S, Narayan Y, Amell T. 2002. An electromyographic study of low-velocity rear-end impacts. Spine. 27(10):1044–1055.
- Kumar S, Narayan Y, Amell T. 2003. Analysis of low velocity frontal impacts. Clin Biomech (Bristol, Avon). 18(8):694–703.
- Marques de Sá JP. 2007. Applied Statistics Using SPSS, STATISTICA, MATLAB and R. Chapter 5: Non-Parametric Tests of Hypotheses, 2nd ed. Springer Science & Business Media; 171–222.
- Muggenthaler H, Adamec J, Praxl N, Schönpflug M. 2005. The influence of muscle activity on occupant kinematics. Paper presented at: International Research Council on Biomechanics of Injury (IRCOBI); September 21-23, Prague, Czech Republic.
- Ólafsdóttir JM, Brolin K, Blouin JS, Siegmund GP. 2015. Dynamic spatial tuning of cervical muscle reflexes to multidirectional seated perturbations. Spine. 40(4):E211–9.
- Ólafsdóttir JM, Östh J, Davidsson J, Brolin K. 2013. Passenger kinematics and muscle responses in autonomous braking events with standard and reversible pre‐tensioned restraints. Paper presented at: International Research Council on Biomechanics of Injury (IRCOBI); September 11-13, Gothenburg, Sweden.
- Östh J, Brolin K, Bråse D. 2015. A Human body model with active muscles for simulation of pretensioned restraints in autonomous braking interventions. Traffic Inj Prev. 16(3):304–313.
- Östh J, Brolin K, Carlsson S, Wismans J, Davidsson J. 2012. The occupant response to autonomous braking: A modeling approach that accounts for active musculature. Traffic Inj. Prev. 13(3):265–277.
- Östh J, Mendoza-Vazquez M, et al. 2016. Development of a 50th percentile female human body model. Paper presented at: International Research Council on Biomechanics of Injury (IRCOBI); September 14-16, Malaga, Spain.
- Östh J, Mendoza-Vazquez M, et al. 2017. The VIVA open HBM finite element 50th percentile female occupant model: Whole body model development and kinematic validation. Paper presented at: International Research Council on Biomechanics of Injury (IRCOBI); September 13-15, Antwerp, Belgium.
- Östh J, Olafsdóttir JM, Davidsson J, Brolin K. 2013. Driver kinematic and muscle responses in braking events with standard and reversible pre-tensioned restraints: Validation data for human models. Stapp Car Crash J. 57:1–41.
- Oude Nijhuis LB, Allum JHJ, Borm GF, Honegger F, Overeem S, Bloem BR. 2009. Directional Sensitivity of “first trial” reactions in human balance control”. J Neurophysiol. 101(6):2802–2814.
- Oude Nijhuis LB, Allum JHJ, Valls-Solé J, Overeem S, Bloem BR. 2010. First trial postural reactions to unexpected balance disturbances: A comparison with the acoustic startle reaction. J Neurophysiol. 104(5):2704–2712.
- Reed MP, Ebert SM, Jones MLH, Park BKD, Hallman JJ, Sherony R. 2018. Passenger head kinematics in abrupt braking and lane change events. Traffic Inj Prev. 19(S2):70–77.
- Seacrist T, Saffioti J, Balasubramanian S, Kadlowec J, Sterner R, García-España JF, Arbogast KB, Maltese MR. 2012. Passive cervical spine flexion: the effect of age and gender. Clin Biomech (Bristol, Avon)). 27(4):326–333.
- Sato F, Odani M, Miyazaki Y, Yamazaki K, Östh J, Svensson M. 2017. Effects of whole spine alignment patterns on neck responses in rear end impact. Traffic Inj Prev. 18(2):199–206.
- SENIAM, Sensor location. 2016. Available at: http://www.seniam.org/. Accessed November 15,
- Sjödahl J, Gutke A, Ghaffari G, Strömberg T, Öberg B. 2016. Postural response of pelvic floor muscles and lower lateral abdominal wall muscles during the active straight leg raise test in women with and without postpartum pelvic girdle pain: An experimental study. Clin Biomech. 35:49–55.
- Subit D, Möhler F, Wass J, Pipkorn B. 2016. Robustness of principal and longitudinal strains as fracture predictors in side impact. Paper presented at: International Research Council on Biomechanics of Injury (IRCOBI); September 14-16, Malaga, Spain.
- Unselt T, Mayer C, et al. 2011. Assessment of behavioural aspects in integrated safety systems (EU FP7 project ASSESS). Paper presented at: International Technical Conference on the Enhanced Safety of Vehicles (ESV); June 13-16, Washington, DC.
- van Rooij L, Elrofai H, Philippens M, Daanen HAM. 2013. Volunteer kinematics and reaction in lateral emergency maneuver tests. Stapp Car Crash J. 11(57):313–342.
- World Health Organization (WHO) 2018. Global status report on road safety Available at: http://www.who.int/violence_injury_prevention/road_safety_status/2018/en/. Accessed March 13, 2019.