
Abstract
Objective: E-commerce has increased freight volumes and shifted freight vehicles to local streets and arterials. These changes have caused increasing concern over traffic safety in urban areas, but there has been limited investigation of road safety impacts. To advance understanding of this issue, we examined recent trends in urban freight-related safety in the United States and characteristics of these crashes.
Methods: We estimated annual rates of fatal and nonfatal urban freight-related injuries from 2005 through 2015 using data from the NHTSA’s Fatal Analysis Reporting System and National Automotive Sampling System General Estimates System. We compared trends in fatal and nonfatal urban freight-related injuries, stratified by road type (interstate vs. not), to overall crash injury trends. We used piecewise linear regression models to test trend changes. We examined and compared specific crash and injury characteristics associated with urban freight-involved crashes, compared to other types of crashes, for the most recent year of data analyzed.
Results: Though freight and overall crash fatality rates per vehicle mile traveled declined between 2005 and 2009, increases were observed between 2009 and 2015. Fatality rates increased 3% for all vehicle crashes, 17% for urban freight-involved crashes, and 15% for urban freight-involved crashes not occurring on interstates. Nonfatal injury rates for urban freight-involved crashes rose even more rapidly between 2009 and 2015. Nonfatal injury rates for urban freight-involved crashes increased 45%, rates for urban freight-involved crashes not occurring on interstates increased 40%, and overall nonfatal injury rates for all vehicle crashes increased 3% during this time. Of all urban freight-related crashes resulting in nonfatal injury, the proportion occurring on non-interstate roads increased from 17% to 25% between 2005 and 2015, and these crashes were more likely to occur on weekdays between 6 a.m. and 4 p.m., when freight demand is high, than weekends or evenings.
Conclusions: Freight-involved injury and fatality rates are rising more rapidly than overall road traffic–related rates, both in all areas and in urban areas. These crashes are also increasingly occurring on local roads and arterials as opposed to interstates. These findings can help policymakers better understand the changing patterns of freight-related safety issues. As freight volumes increase in commercial and residential areas, planners must increasingly consider freight needs and ensure that space is allocated to this function. Additionally, changes to surveillance systems are necessary to better track burden and risk factors associated with these crashes and inform crash prevention efforts.
Introduction
In 2017, more than 38,000 individuals lost their lives in road traffic crashes and 3 million people were nonfatally injured (Heron Citation2016; NHTSA Citation2018). Overall fatal crash rates per vehicle mile traveled (VMT) have declined by 8% in the last decade (NHTSA Citation2018). Underlying this overall fatal crash trend are disparate fatality trends by road user and vehicle type, likely driven by multiple factors (e.g., macroeconomic conditions, vehicle design, governmental regulations). Though we have an understanding of specific road traffic injury and fatality trends for many of these subgroups (e.g., motorcyclists, passenger car occupants, bicyclists), much less is known about freight vehicle safety trends in the United States. Goods movement and freight volumes are rapidly changing in complex ways across the United States. Though these changes have generated numerous economic benefits, the safety implications of this rapid change deserve consideration.
Freight volumes in the United States have increased steadily since the economic crisis, reaching about 16 billion tons in 2018, and are expected to grow by 36% by 2029 (American Trucking Associations Citation2018). Along with overall increases in freight volumes, the rise of online shopping has impacted the location and number of goods distribution centers. In particular, the popularity of short delivery windows has contributed to the increased need for distribution centers located within urban areas. Consumers’ frequent use of online shopping has also impacted last-mile delivery, and the number of freight vehicles traveling on arterials and local roads has increased to meet this need. Though there has been attention to how shifts in freight patterns have impacted emissions and travel demand, as well as how long-haul trucking affects safety, there has been limited attention to the impacts of urban freight vehicles on road safety.
Therefore, the purpose of this study was to examine trends from 2005 to 2015 in urban freight-related safety in the United States. We examined trends in freight-related injuries and fatalities in urban areas, stratified by road type (i.e., interstate vs. non-interstate), and further compared these to patterns for all vehicles. Moreover, we analyzed characteristics of urban freight-related injuries and fatalities compared to other types of crashes. Finally, we discuss current strengths and limitations of national road safety surveillance systems to monitor freight-related safety trends and implications for urban planning processes.
Background
With the rise of e-commerce, growth in online shopping has soared, driving up demand for urban deliveries (Visser et al. Citation2014). To accommodate this growing demand, logistics companies have employed a large number of freight vehicles to connect warehousing facilities to residences and link cities and regions together (Lindholm and Behrends Citation2012). The vast volume of freight vehicles on the road networks of major metropolitan areas has increasingly contributed to environmental and social problems, including emissions, congestion, and traffic safety (Visser et al. Citation2014). In particular, safety remains a major challenge in freight movement, despite decreases in overall traffic fatalities (Sedor and Caldwell Citation2002; Giuliano et al. Citation2018).
Dense urban areas not only contain spatially concentrated freight demand for urban deliveries but also have limited freight infrastructure—road space, loading/parking spaces, logistics depots, etc. Competition between freight and passenger travel modes over limited urban road space and parking spaces often creates challenges for safe and efficient freight vehicle operation (Sedor and Caldwell Citation2002). For example, in many cities, freight vehicles double-parking on urban roads is an important problem, often creating road hazards for passenger vehicle occupants, bicyclists, and pedestrians (Browne et al. Citation2012; Gao and Ozbay Citation2016).
Though empirical studies on fatalities and injuries involving trucks have failed to specifically discuss and tease apart the impacts of urban freight movement during the rapidly changing era of e-commerce, these studies provide a valuable starting point, given that many freight vehicles are trucks. Giuliano et al. (Citation2013) examined all fatal crashes in the United States in 2009, finding that 9.6% of all motor vehicle traffic fatalities involved large trucks, and one-third of these truck-related traffic fatalities occurred in urban areas. A 2014 Comprehensive Truck Size and Weight Limits Study conducted by the Federal Highway Administration (FHWA Citation2014) synthesized previous research on truck-related crash rates, finding a significantly higher rate, per vehicle mile traveled, in urban areas compared to rural areas.
The relationship between large trucks and vulnerable road users including pedestrians and bicyclists has also attracted attention in the literature (Clifton et al. Citation2009; Pokorny et al. Citation2017). Clifton et al. (Citation2009) examined pedestrian crash injuries and fatalities involving large trucks compared to those involving others type of vehicles. They estimated that larger vehicles had a similar probability of causing pedestrian injuries as passenger vehicles but a higher probability of causing pedestrian deaths. Pokorny et al. (Citation2017) focused on truck–bicycle crashes in Norway and found that 77% of the crashes occurred in urban areas and generally occurred during workdays, in the morning and afternoon, and under good visibility conditions.
Though previous research provides a foundation on urban freight road safety threats, differences between urban and rural large truck safety, and specific large truck-related risks to other road users, empirical research is lacking on the current status and recent trend in urban freight-related traffic safety outcomes. Additionally, there is a dearth of information on characteristics of urban freight crashes and how they compare to those occurring in other settings, a critical piece in understanding potential burden and risk factors. Therefore, we conducted an examination of nationwide road safety consequences related to urban freight movement in the United States between 2005 and 2015.
Methods
Definitions
We examined trends in fatal and nonfatal injuries associated with goods movement in urban areas. Freight vehicles are road vehicles designed, exclusively or primarily, to carry goods (Eurostat Citation2018). Because road traffic crash surveillance data do not explicitly identify freight vehicles, we used commercial vehicles not involved in passenger transportation as a proxy indicator. We identified these freight vehicles as those that had a commercial vehicle identification number, where the vehicle body type was not listed as a bus, passenger vehicle, or motorcycle. This definition includes vehicles with gross weights greater than 10,000 pounds; that is, medium/heavy trucks and light commercial trucks pulling a trailer and vehicles of any weight involved in transporting hazardous goods (NHTSA Citation2016, Citation2017). This definition also includes UPS and FedEx delivery trucks, which are heavily involved in small package delivery in urban areas. Similar definitions have been employed in previous research on freight safety (Retting Citation1993; Giuliano et al. Citation2013). This definition does not include vehicles weighing less than 10,000 pounds sometimes used for freight delivery; for example, passenger vehicles used in urban last-mile delivery services such as Uber Eats.
We identified crashes as occurring in an urban area if they were located in a Census Bureau–defined urbanized area. The Census Bureau defines urbanized areas as densely developed areas and associated residential, commercial, and industrial land uses containing a minimum of 50,000 people. Within urbanized areas, we stratified crashes according to whether they occurred on or off an interstate to distinguish patterns on local roads and arterials from interstates, which also include long-haul freight vehicles.
Data
We analyzed national data from 2005 to 2015 from 4 sources: (1) NHTSA’s Fatal Analysis Reporting System (FARS), (2) the NHTSA’s NASS-General Estimates System (GES), (3) the FHWA’s Travel Volume Trends Reports, and (4) the U.S. Census Bureau’s TIGER/Line Shapefiles. We describe each of these data sources below. Of note, we selected 2015 as the end point for this analysis because, in 2016, there was a major change in crash surveillance protocols when the GES system was retired and the Crash Report Sampling System was created.
FARS contains data derived from a nationwide census of fatal motor vehicle traffic crashes. To be included in FARS, a crash must involve a motor vehicle traveling on a roadway customarily open to the public and must result in the death of at least one person (occupant of a vehicle or a nonmotorist) within 30 days of the crash (NHTSA Citation2017). The NASS-GES data are obtained from a nationally representative probability sample selected from all police-reported crashes. To be eligible for the NASS-GES sample, a police accident report must be completed for the crash. The crash must involve at least one motor vehicle traveling on a roadway and must result in property damage, injury, or death (NHTSA Citation2016). FARS and GES both contain the following variables used to identify urban freight vehicle crashes: Commercial motor carrier ID, vehicle body type, and crash location.
We obtained data on annual VMT from FHWA’s monthly traffic volume trend reports (Citation2018). These reports provide information on annual VMT on all roads and streets in the United States from 1992 through the present. The data are based on hourly traffic count data collected at approximately 4,000 continuous traffic count locations nationwide.
To identify whether a crash occurred on an urban roadway, we utilized information from the U.S. Census Bureau on urbanized areas, as defined in 2010 (Census Bureau Citation2011). Though the FARS data contain an indicator for whether a crash occurred in an urbanized area, the GES data only provide the latitude and longitude of the crash. Therefore, it was necessary to link to additional spatial data (TIGER/Line Shapefiles) from the Census Bureau to determine which crashes occurred in urbanized areas.
Analysis
The process of identifying urban freight vehicle–related fatal and nonfatal injuries included 3 steps. The first step involved selecting all freight vehicles from the vehicle populations present in these data sources. To do this, we selected vehicles with commercial motor carrier identification numbers and excluded those whose body types were buses or passenger vehicles, including motorcycles. The second step was to link freight vehicles to crashes occurring in urbanized areas. In the final step, we linked data on fatal and nonfatal injuries involved in these crashes.
We calculated annual rates of fatal (FARS) and nonfatal (GES) injuries involving freight vehicles in urban areas, both on and off the interstate. Our definition of nonfatal injury included possible injury, suspected minor injury, suspected serious injury, and injured but severity unknown. For reference, we also analyzed annual fatal and nonfatal injury rates for (1) all crashes irrespective of vehicle type and location and (2) freight vehicles irrespective of location. Rates were calculated as the number of fatalities or nonfatal injuries, respectively, divided by annual VMT. GES sample weights were applied to the nonfatal injury data to generate nationally representative estimates, and standard errors for the GES-derived rates were calculated based on the Generalized Estimated Sampling Errors in the GES technical documentation (NHTSA Citation2016). Standard errors for FARS-derived rates were calculated using the gamma distribution, consistent with previous research (Fay and Feuer Citation1997; Kochanek et al. Citation2009).
We analyzed temporal trends in crash rates using piecewise regression because empirical analysis demonstrated strong changes in patterns around 2009 likely due to the effects of the Great Recession. We tested for significant differences in outcome metrics in the 2 time periods and overall. Finally, we examined crash and injury characteristics associated with urban freight crashes for the most recent year of data analyzed (2015). All analyses were conducted in STATA and SAS, and spatial analyses were conducted in ArcGIS during 2018.
Results
Fatality trends
Freight-involved fatality rates declined significantly from 2005 to 2015 for all geographies; a similar pattern was observed for all vehicles (). Though rates declined overall, regression models revealed strong decreases from 2005 to 2009 but increases from 2009 to 2015 (see Appendix ). For example, freight vehicle–involved fatalities on non-interstate roads in urban areas declined from 332 per trillion VMT in 2005 to 282 per trillion VMT in 2015 (P < .001), but this overall trend masked an annual decrease of 22.5 in fatalities per trillion VMT from 2005 to 2009 (P < .001) and an annual increase of about 10.9 from 2009 to 2015 (P < .001). A similar pattern emerged for all other fatality rates examined, with the exception of overall crashes in urban and rural areas. For that statistic, there was evidence of a significant decline from 2005 to 2009 (b = −645.9, P = .001) but no significant change from 2009 to 2015 (b = −20.9, P = .687). Since 2009, VMT-adjusted fatality rates have increased 3% for all vehicles; increases have been higher for all freight-involved fatalities in urban areas (17%) and non-interstate urban areas (15%).
Figure 1. All vehicle- and freight vehicle–related death and nonfatal injury rates per trillion vehicle miles traveled, United States, 2005–2015.
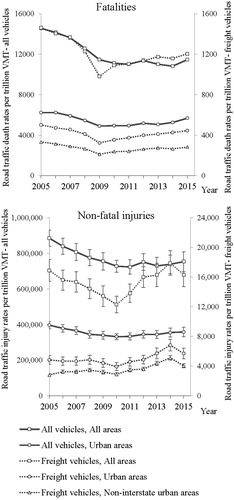
Table 1. Location of all vehicle- and freight vehicle–related fatalities injuries, United States, 2005–2015.a
Nonfatal injury trends
Freight-involved nonfatal injuries in urban areas showed no significant change from 2005 to 2009 but increased significantly from 2009 to 2015 for urban areas overall and non-interstate urban roads (see ). In comparison, the overall nonfatal injury rate for all vehicles in urban areas showed significant declines from 2005 to 2009 followed by significant increases from 2009 to 2015. From 2010 to 2015, the percentage change in nonfatal injury rates has been highest for freight involved crashes in urban areas overall (45%) and off the interstate (40%); and lowest for all vehicles (3%).
Freight-involved crashes: Road type, individuals involved, and crash characteristics
Road type
In 2015, 64% of freight-involved fatalities occurred in rural areas, 13% on urban interstates, and 23% on non-interstate urban roads (. A full table containing statistics of all years is included in the Appendix; see Appendix , online supplement.) Among freight-involved fatalities in urban areas, this non-interstate distribution was nearly identical in 2005 (χ2 = 2.34, P = .126). This contrasts with the pattern for overall vehicle fatalities where the proportion occurring on non-interstate urban roads increased from 37% to 43% (χ2 = 5.26, P = .022).
Table 2. Location of all vehicle- and freight vehicle–related nonfatal injuries, United States, 2005–2015.a
Patterns of freight-involved nonfatal injuries demonstrated that the share occurring on non-interstate urban roads increased from 17% to 25% and the share on urban interstates decreased from 12% to 10% (χ2 = 28.20, P < .001). For comparison, the location of nonfatal injuries for overall vehicle crashes showed less percentage change during the study period.
Characteristics of individuals involved
There was little difference in the average age of persons involved by crash location, vehicle type (freight vs. not), and severity (fatal vs. nonfatal; and ). Males comprised a greater proportion of freight-related nonfatal injuries, whereas females comprised a greater proportion of all nonfatal injuries. Compared to all crashes, a higher share of injuries and fatalities in freight-related crashes were vehicle occupants, whereas pedestrians and bicyclists accounted for a smaller proportion of those injuries and fatalities. In urban areas where pedestrians and bicyclists are more prevalent, nonmotorists comprised a greater proportion of those killed or injured in freight-related crashes compared to other locations; however, proportions were generally still below that of all crashes. With regard to freight-related crashes, 14% of the fatalities and 21% of nonfatal injuries are drivers of freight vehicles. On non-interstate urban roads, those percentages are 5% and 16%, respectively.
Table 3. Person-level characteristics of fatal vehicle- and freight vehicle–related crashes by location type, United States, 2015.a
Table 4. Person-level characteristics of nonfatal vehicle- and freight vehicle–related crashes by location type, United States, 2015.a
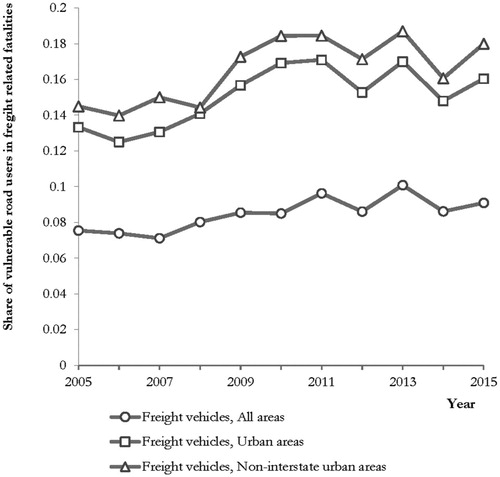
Although freight-related fatalities less often involved vulnerable road users (VRUs; i.e., pedestrians and bicyclists) compared to all crashes, such shares increased over time, especially in urban areas (). The share of freight-related VRU fatalities slightly increased (8% to 9%), and the share of urban freight-related VRU fatalities increased from 13% in 2005 to 16% in 2015 (χ2 = 5.40, P = .020). Of fatalities occurring in urban areas, the share occurring off the interstate increased from 15% in 2005 to 18% in 2015 (χ2 = 5.63, P = .018). For nonfatal injuries, we did not observe notable increases across this period.
Figure 2. Share of vulnerable road users in freight vehicle–related fatalities, United States, 2005–2015.
Characteristics of freight-related crashes
Compared to all crashes, freight-related crashes resulting in injuries and fatalities were more likely to occur on weekdays in the morning peak (6 a.m.–10 a.m.) and midday (10 a.m.–4 p.m.) time frames, when freight demand is high (Appendix ). Fatalities per crash were approximately 20% higher for freight-involved crashes compared to all crashes. Nonfatal injuries per crash were comparable for all crashes and those involving freight vehicles in urban areas.
Discussion
Fatalities and, particularly, nonfatal injuries from freight-involved crashes in urban areas are rising more rapidly than overall road traffic–related rates. Freight-involved injuries are increasingly occurring on local roads and arterials as opposed to interstates. Taken together, this suggests that increases in e-commerce may be changing the nature of traffic safety threats in urban areas.
Fatality rates related to all vehicles and freight vehicles in general declined during 2005–2015. Such declines may have been due to the economic crisis, because research indicates that the economic crisis likely affected freight activities more than passenger travel (Rothengatter Citation2011). In-vehicle traffic safety devices and software may have also played a role in declines; however, despite improvements in such safety protections, fatalities and injuries resulting from urban freight-involved crashes have been increasing since 2010, and these increases have occurred at a faster pace than all crashes.
Though urban freight-involved injury and fatality rates have increased, the nonfatal injury rate has increased much faster (45% for nonfatal injuries vs. 17% for fatalities). Nonfatal freight-involved injuries in urban areas are increasingly likely to occur on local roads and arterials rather than interstates and during weekday morning and midday periods. Differences in trends for urban freight-related fatalities and injuries may be explained by travel speeds. On local streets and arterials, freight vehicles move at lower speeds (Pahukula et al. Citation2015). Therefore, increases in freight movements within urban areas would be expected to impact nonfatal injury rates more than fatality rates and to increasingly occur off interstates (Uddin and Huynh Citation2017).
These findings support the hypothesis that freight vehicles pose increasing safety threats in urban areas, with implications for injury surveillance systems and urban planning. Existing surveillance systems, such as FARS and GES/NASS, do not readily identify freight-involved crashes and have given limited attention to the role that goods movement plays in urban traffic safety. Organizations that collect crash data, such as NHTSA, may consider adding freight-related components in surveillance databases, such as the purpose and length of and goods moved in freight trips involving in crashes. In addition, even if surveillance systems are improved to better capture and identify traditional freight vehicles, it is becoming increasingly difficult to distinguish freight and passenger vehicles. Consider a vehicle that may be used for personal travel, to provide passenger transport services through a ride-hailing company, and to provide last-mile delivery services through platforms such as Instacart. Though this type of dual use is not new, it has rapidly grown in the past 5 years and presents new challenges for surveillance and problem identification.
Our findings can offer transportation engineers and staff at the Federal Motor Carrier Safety Administration, departments of transportation, and departments of motor vehicles information on freight vehicle safety in cities, not just on interstates or loading docks. These results also have implications for the content of commercial driver training, including operation of freight vehicles in urban environments. For urban planners, these data provide additional verification that shifting freight distribution patterns are impacting the safety of the urban environment and need to be considered in development approval processes and regional transportation plans. Though some cities have begun to focus more on planning for safe goods movement, research suggests that the planning profession is not consistent in its consideration of safe goods movement. Studies show that municipal planning departments often fail to systematically review provisions for providing space for delivery services or analyzing impacts of goods movement on other road users (Lindholm Citation2010; Ballantyne Citation2013; Lindholm and Blinge Citation2014). Planners can also work with transportation engineers to mitigate conflicts between freight movement and other transport activities. For instance, cities may consider traffic-calming and pavement design approaches to reduce multimodal conflicts and develop pilot programs such as off-hour delivery programs to temporally separate freight and passenger traffic (National Association of City Transportation Officials Citation2013). These efforts are particularly important because the use of logistics firms for last-mile delivery can provide environmental and congestion benefits by reducing the need for personal vehicle trips (Wygonik and Goodchild Citation2018).
This study is subject to limitations. The definition of a freight vehicle is a proxy and does not capture all vehicles involved in goods movement. Still, the definition does include common urban vehicle delivery truck types (e.g., UPS and FedEx delivery trucks) and is consistent with previous research (Retting Citation1993; Giuliano et al. Citation2013). Further work is needed to improve surveillance of road safety outcomes among all urban freight vehicles. Additionally, our analysis included data through 2015, and we were unable to analyze data for 2016 and 2017 due to the shift in national road traffic crash surveillance systems during this time. Continued research to track this burden using the new Crash Report Sampling System and improve measurement of urban freight-related crashes in this database is warranted.
Urban freight-involved injury and fatality rates are rising more rapidly than overall road traffic–related rates. These crashes are also increasingly occurring on local roads and arterials as opposed to interstates. We contend that these trends present challenges and opportunities for crash and injury surveillance systems and urban planning. Existing surveillance systems provide weak proxies for freight vehicles, and the difficulty in monitoring freight-involved trends can impede efforts to identify safety threats and intervention opportunities when needed. Urban planning processes have traditionally not focused on accommodating freight delivery needs. As freight volumes increase in commercial and residential areas, planners should increasingly consider freight needs, ensuring that space is allocated to this function.
Data availability statement
The data sets generated during and/or analyzed during the current study are available from the corresponding author on reasonable request.
Supplemental Material
Download MS Word (36.1 KB)Additional information
Funding
Related Research Data
References
- American Trucking Associations (ATA). 2018. Freight Transportation Forecast to 2029. https://www.trucking.org/article/ATA-U.S.-Freight-Transportation-Forecast-to-2029.
- Ballantyne E. 2013. The benefits of integrating freight logistics into urban transport demand management measures and policies [PhD thesis]. Institute for Transport Studies, University of Leeds, UK.
- Browne M, Allen J, Nemoto T, Patier D, Visser J. 2012. Reducing social and environmental impacts of urban freight transport: a review of some major cities. Procedia-Social and Behavioral Sciences. 39:19–33.
- Census Bureau. 2011. Federal Register. [accessed 2019 January 1]. Available from: https://www2.census.gov/geo/pdfs/reference/fedreg/fedregv76n164.pdf
- Clifton C, Burnier C, Akar G. 2009. Severity of injury resulting from pedestrian-vehicle crashes: What can we learn from examining the built environment? Transport Res Part D. 14(6):425–436.
- Eurostat. 2018. Glossary: road freight vehicle. Available from: https://ec.europa.eu/eurostat/statistics-explained/index.php/Glossary:Road_freight_vehicle. [last accessed January 1, 2019].
- Fay MP, Feuer EJ. 1997. Confidence intervals for directly standardized rates: a method based on the gamma distribution. Stat Med. 16(7):791–801.
- Federal Highway Administration (FHWA). 2014. Highway safety and truck crash comparative analysis. In: Comprehensive truck size and weight limits study. Available from: https://ops.fhwa.dot.gov/freight/sw/map21tswstudy/technical_rpts/hstcanalysis/safety_comp_analys.pdf.
- Federal Highway Administration (FHWA). 2018. Federal highway administration monthly traffic volume trends reports. [accessed 2019 January 1]. Available from: https://www.fhwa.dot.gov/policyinformation/travel_monitoring/17dectvt/page2.cfm.
- Gao J, Ozbay K. 2016. Modeling double parking impacts on urban street. Paper presented at: 95th Annual Meeting of the Transportation Research Board (TRB). Washington, DC.
- Giuliano G, O'Brien T, Dablanc L, Holliday K. 2013. Synthesis of freight research in urban transportation planning (Vol. 23). Washington, DC: Transportation Research Board. Available from: https://www.infrastructureusa.org/wp-content/uploads/2013/06/ncfrp_rpt_023.pdf.
- Giuliano G, Kang S, Yuan Q. 2018. Using proxies to describe the metropolitan freight landscape. Urban Studies. 55(6):1346–1363.
- Heron MP. 2016. Deaths: leading causes for 2018. Available from: https://www.cdc.gov/nchs/data/nvsr/nvsr67/nvsr67_06.pdf. [last accessed January 1, 2019].
- Kochanek KD, Miniño AM, Murphy SL, Xu J, and, Kung HC. 2009. Deaths: final data for 2011. https://stacks.cdc.gov/view/cdc/12124. [last accessed January 1, 2019].
- Lindholm M. 2010. A sustainable perspective on urban freight transport: factors affecting local authorities in the planning procedures. Proc Social Behav Sci. 2(3):6205–6216.
- Lindholm M, Behrends S. 2012. Challenges in urban freight transport planning: a review in the Baltic Sea Region. J Transport Geography. 22:129–136.
- Lindholm ME, Blinge M. 2014. Assessing knowledge and awareness of the sustainable urban freight transport among Swedish local authority policy planners. Transport Policy. 32:124–131.
- NHTSA. 2016. National automotive sampling system – general estimates data system analytical user’s manual 1988-2015. [accessed 2019 January 1]. Available from: https://crashstats.nhtsa.dot.gov/Api/Public/Publication/812320
- NHTSA. 2017. Fatality Analysis Reporting System (FARS) analytical user’s manual 1975-2016. [accessed 2019 January 1]. Available from: https://crashstats.nhtsa.dot.gov/Api/Public/Publication/812447.
- NHTSA. 2018. Summary of motor vehicle crashes 2016. [accessed 2019 January 1]. Available from: https://crashstats.nhtsa.dot.gov/Api/Public/ViewPublication/812580.
- National Association of City Transportation Officials. 2013. Urban street design guide. New York: Island Press/Center for Resource Economics.
- Pahukula J, Hernandez S, Unnikrishnan A. 2015. A time of day analysis of crashes involving large trucks in urban areas. Accident Anal Prevent. 75:155–163.
- Pokorny P, Drescher J, Pitera K, Jonsson T. 2017. Accidents between freight vehicles and bicycles, with a focus on urban areas. Transport Res Proc. 25:999–1007.
- Retting RA. 1993. A study of fatal crashes involving pedestrians and trucks in four cities. J Safe Res. 24(4):195–203.
- Rothengatter W. 2011. Economic crisis and consequences for the transport sector. In: Transport moving to climate intelligence. New York, NY: Springer. p. 9–28
- Sedor J, Caldwell H. 2002. The freight story: a national perspective on enhancing freight transportation. Federal Highway Administration. Office of Freight Management and Operations FHWA-OP-03-004. Collingdale, PA: Diane Publishing Company.
- Uddin M, Huynh N. 2017. Truck-involved crashes injury severity analysis for different lighting conditions on rural and urban roadways. Accident Anal Prevent. 108:44–55.
- Visser J, Nemoto T, Browne M. 2014. Home delivery and the impacts on urban freight transport: a review. Proc Social Behav Sci. 125:15–27.
- Wygonik E, Goodchild AV. 2018. Urban form and last-mile goods movement: Factors affecting vehicle miles travelled and emissions. Transport Res Part D. 61:217–229.