
Abstract
Objective: In Sweden, cyclists, pedestrians, and moped riders share the space on combined pedestrian and cycle paths, and their speeds may differ greatly. Both actual speed and speed differences can potentially influence the number of accidents on the shared paths. As a starting point, this article studies the speed component and how cyclists’ speed varies at pedestrian and cycle paths depending on the day, week, and year; road user composition; and road design.
Methods: Three data sources were used: Existing measurements of cycle speed and flow in 3 different Swedish municipalities, Eskilstuna (1 site, January–December 2015), Linköping (6 sites, 4 weeks in September–October 2015), and Stockholm (10 sites, 1–5 days in August–September 2015); complementary measurements of cycle speed and flow in Linköping (4 sites, 1–10 days in August–September 2016) and Stockholm (1 site, only part of 2 days in August 2016) were also conducted within the project, in addition to roadside observations of bicycle types at the 5 new sites.
Results: The average speed of cyclists on the paths varied between 12.5 and 26.5 km/h. As expected, the lower average speeds were found in uphill directions, near intersections, and on paths with high pedestrian flows. The higher speeds were found in downhill directions and on commuter routes. In all, 70%–95% of road users observed on pedestrian and cycle paths were cyclists, and 5%–30% were pedestrians. The most common type of bicycle was a comfort bike, followed by a trekking bike. Electric-assisted bicycles and racer bikes occurred at all sites, with proportions of 1%–10% and 1%–15%, respectively. The 2 sites with the highest proportion of electric-assisted bicycles and racer bicycles also had the highest average speeds. The differences in average speed throughout the day, week, and year could only be assessed at one of the sites. Only small differences were found, with the most noticeable being that the average speed was lower in January and February (13.8 km/h) compared to the rest of the year (15.3–16.1 km/h). The average speed was also lower during daytime (14.7 km/h) than during other parts of the day (15.4–15.8 km/h).
Conclusions: The relationship between bicycle type and measured speed was not entirely clear, but the results suggest that paths with higher proportions of electric and racer bicycles have higher average speeds. There also appears to be a connection between average speed and the width of the distribution; that is, the higher the average speed, the wider the speed distribution. More research is needed on how speed levels and speed variance affect accident risk.
Introduction
In Sweden, cyclists, pedestrians, and moped riders (hereafter referred to as road users) with different speeds coexist on combined pedestrian and cycle paths. Conflicts and incidents occur and sometimes they lead to collisions between road users. With new types of vehicles for personal transport (e.g., powered 2-wheelers) becoming more popular, this might be an increasing problem in the future. In Sweden, about 1% of pedestrians who need emergency care have been injured in a collision with a cyclist (Berntman Citation2015). In addition, about 1% of cyclists seeking emergency care have been injured in such a collision (Niska and Eriksson Citation2013). Thus, collisions between pedestrians and cyclists might not be a major safety problem, but sharing the space may cause a feeling of insecurity among the different types of road users. In addition to pedestrian collisions, nearly 80% of cyclists were injured in single-bicycle crashes, 12% in a collision with a motor vehicle, 7% in a collision with another cyclist, 2% in a collision with other, and 1% in a collision with mopeds (Niska and Eriksson Citation2013). In about 10% of the single-bicycle crashes, the cyclist crashed while avoiding a collision with another road user (Niska and Eriksson Citation2013; Niska et al. Citation2013). Commonly occurring causes of single-bicycle crashes, declared by the cyclists, showed that “high speed” was a factor in 4% and “downhill slope” was a factor in 7% of the crashes (Niska and Eriksson Citation2013). In downhill crashes, high speed may have contributed to the cause and severity of the crash. Research on the relationship between cyclists’ speeds and accident risk is scarce. However, Schepers et al. (Citation2014) found an increased risk when comparing speeds above 25 km/h with speeds of 15–25 km/h. In that study, information about speed and other background variables was collected through a questionnaire survey among injured cyclists. Studies based on actual measurements on cyclists’ speeds are needed as a complement.
Both speed level and differences in speed between the road user categories occurring on various types of cycle paths could be a cause of failure in interaction. Knowledge of the road users’ composition on pedestrian and cycle paths and the resulting speed distribution is not sufficient. In addition to having a potential impact on safety, speed has a strong correlation with cyclists’ travel times, which in turn might affect cyclists’ route choices as well as the choice of travel mode (Halldórsdóttir Citation2015; Ton et al. Citation2017). In this context, one needs to distinguish between travel mean speed and time mean speed. The travel mean speed is measured over distance traveled (Jensen et al. Citation2010), considering stops and other speed-setting obstacles, and the time mean speed is the speed at a certain cross section (i.e., at the measurement site; Swedish Transport Administration Citation2017). In this article, our analyses focus on time mean speed measurements.
Aim
It is well known that the speed of motorized vehicles is a crucial factor for traffic safety. Numerous studies have shown that higher mean speed on a road leads to more injured and killed road users (International Transport Forum Citation2018). We have much less knowledge about the importance of speed in cyclist safety, and the relationship between speed and traffic safety needs to be studied further. As a starting point, this article studies the speed component and how cyclists’ speeds vary at pedestrian and cycle paths depending on the day, week, and year; road user composition; and road design.
Methods
Measurement sites and data collection periods
We were able to assemble time mean speeds from 3 Swedish municipalities: 10 sites in Stockholm, 6 sites in Linköping, and 1 site in Eskilstuna. The criterion for selection was to assemble data including both traffic flows and speed for each passing vehicle. Therefore, only a few sites were applicable, where only one represented a full year. We have also conducted complementary (“new”) measurements within the project at 4 sites in Linköping and 1 site in Stockholm (). In total, speed and cycle flow data from 20 sites were analyzed (see Table A1, online supplement).
Table 1. Characteristics of the measurement sites included in the analyses.a
The existing speed and flow data from Stockholm and Linköping were collected with 2 different types of equipment that use rubber tubes to detect axle passages. Metor was used in Linköping for sites 14–19, and MetroCount was used in Stockholm for sites 1–10. For the existing data from Eskilstuna (site 20) and for the new measurements in Stockholm and Linköping (sites 11–15), a camera measurement system was used. The camera system is OTUS3D and has a 3D feature that detects movements/tracks and classifies these into pedestrians, cyclists, and motor vehicles (www.viscando.com). All sites had a bidirectional pedestrian and cycle path separated from the motor vehicle traffic. Pictures of sites 11–13 and 15 can be found in the Appendix (see Figures A1–A4, online supplement).
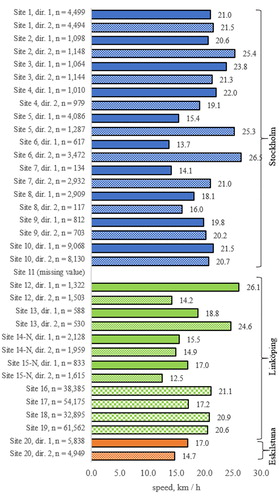
Figure 1. Average directional speed (km/h) of bicyclists passing the measurement sites. Based on weekdays (Monday to Friday). Direction 1 (dir. 1) is representing the direction towards the city center and direction 2 (dir. 2) is the opposite direction. The sites 16–19 have no information of directional average speeds. Blue bars = Stockholm, green bars = Linköping, orange bars = Eskilstuna.
From the existing measurements in Stockholm, 1–5 days of available data were extracted from the period August 31 to September 21, 2015. Data are aggregated by hour and direction. From the existing measurements in Linköping, available data for about 4 weeks in September and October 2015 were included in the analyses, aggregated by hour but not directionally divided. Data from Eskilstuna for all of 2015 are available, both on an individual level and directionally divided.
The complementary/new measurements in Stockholm and Linköping were carried out from August 30 to September 10, 2016, for 1–10 days at each site. If missing values existed for at least 1 h, the whole day was removed. In total, we only used 1 day per site (because of handling problems with the equipment), except for the site in Stockholm, where only parts of one day could be used.
Observations of road users on pedestrian and cycle paths
At the sites in Stockholm and Linköping where the new speed measurements took place (sites 11–15 in ), the traffic composition was also observed. Observations were conducted at 15 different occasions, where each occasion lasted about 1 h. All observations were conducted between 7:30 a.m. and 6:00 p.m. during the period August 30 to September 12. The number of occasions per site varied between 2 and 4. In total, 4,604 cyclists, 1,207 pedestrians, and 46 other types of road users were observed. During the observations, there was both cloudy and sunny weather, but it never rained, and the air temperature was between 10 and 24 °C.
At each occasion, the number of road users in different categories was observed using the following classification (we used the same classification as in Kircher et al. Citation2017):
Classic bicycle: Foot brake, handlebars higher than the saddle, rarely more than 7 gears, often basket. Includes minibikes.
Trekking bicycle: Rarely foot brake, handlebars and saddle approximately at the same height, often more than 7 gears.
Mountain bicycle: Regardless of type.
Racing bicycle: Rarely foot brake, handlebars lower than the saddle, narrow tires, and road handlebars.
Electric-assisted bicycle: Regardless of type. We presume that all electric bikes had pedal assistance up to 25 km/h; that is, they were pedelecs. Note: In Sweden, s-pedelecs are not allowed on cycle paths.
Other bicycles or bicyclists: Child (≤12 years old) with or without an adult cyclist. Box bikes and other more unusual types of bicycles were also included in this group.
Pedestrians: This group also included those who led their bicycle.
Other road users: This group includes electric wheelchairs, class 1 mopeds (max 45 km/h), class 2 mopeds (max 25 km/h), and wheeled adults/children (e.g., on roller skates or skateboards). A few cars also passed at one site, most likely service traffic.
Statistical analysis
An analysis of variance was conducted to study speed variation throughout the day, week, and year at site 20 where we had access to an entire year of data. Four explanatory variables were used in the analysis: Month (January–December), type of day (weekday, weekend), time of day (6:00 a.m.–9:00 a.m., 9:00 a.m.–3:00 p.m., 3:00 p.m.–6:00 p.m., 6:00 pm.–10:00 p.m., 10:00 p.m.–6:00 a.m.), and direction (1 = toward the city center, 2 = the opposite direction). Only main effects were included. The analysis is based on data from individual cyclists, which is only appropriate if the speed of each cyclist can be regarded as independent and not affected by, for example, congestion. At this site, we believe that this prerequisite was fulfilled because the cycle and pedestrian flow was rather low (only in a few cases was the flow was higher than 3 cyclists per minute).
The analysis was conducted using “proc GLM” in SAS 9.4 (SAS Institute, Cary, NC).
Results
Average speed of cyclists
Average speeds for all measurement sites are presented in (site 11 was excluded because we did not have data for a whole 24-h period). The results are divided by direction where this information is available. For some of the sites there were major differences in speed between the directions; the differences varied from only 0.5 km/h (site 1) to 12.8 km/h (site 6). At sites 5, 6, and 12, the average speed was higher than 25 km/h in one direction but only about 14 km/h in the other direction. This is explained by the fact that these sites are located at slopes. For the sites where the difference between directions was no more than 2 km/h, average speeds were approximately 15–22 km/h.
In addition to the obvious effect of road gradient on cyclists’ speeds, the differences in the average speed between the directions can be explained by, for example, differences in distance to intersections or other physical obstacles, visibility conditions, and traffic flow.
Variability in speed throughout the day, week, and year
The results of the analysis of variance applied to site 20 show that all 4 main effects (month, type of day, time of day, direction) were statistically significant (P < .0001 for each effect). Direction was only included in the model to account for the speed differences in the 2 directions and was not analyzed further. Results for the different months show that the lowest mean speed (13.8 km/h) was found for January and February (, Table A2, see online supplement; the mean speeds were adjusted to account for the other variables in the model). The speed difference compared to other months varied between 1.5 km/h (March) and 2.3 km/h (July). Thus, the difference was rather small but not negligible. An inspection of snow depth provided by the Swedish Meteorological and Hydrological Institute (www.smhi.se) showed that the area around the measurement site was covered by snow during parts of January and February in 2015, which might explain the lower speeds. However, we do not know the specific conditions at the measurement site. During the rest of the year there were only small seasonal differences, with slightly higher speeds during spring and summer (April–August; 15.9–16.1 km/h) than during autumn (September–December; 15.4–15.7 km/h).
Table 2. Results of analysis of variance applied to speed data from site 20.Table Footnotea
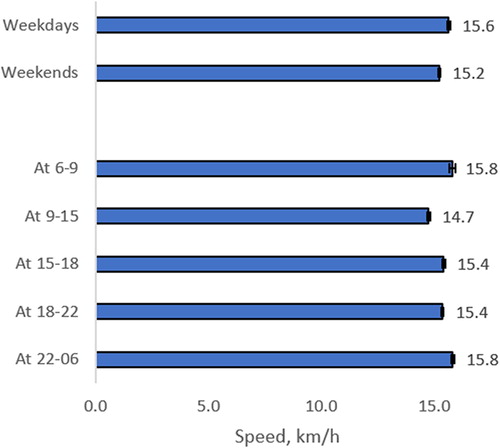
The results further show statistically significant but minor differences between weekdays and weekends (15.6 and 15.2 km/h, respectively; ). For time of day, all comparisons were statistically significant except for the difference between 6:00 a.m. and9:00 a.m. and between 10:00 p.m. and6:00 a.m. (both 15.8 km/h) and between 3:00 p.m. and 6:00 p.m. and between 6:00 p.m. and 10:00 p.m. (both 15.4 km/h). The time of day with the lowest speed was during the daytime (9:00 a.m.–3:00 p.m.; 14.7 km/h), although the differences in speed between time periods were in general rather small. Possible explanations for lower speed during the daytime can be other types of errands and other types of cyclists.
Figure 2. Adjusted mean values of speed at site 20 for type of day and time of day, 2015. The error bars represent 95% CI. Results from analysis of variance.
Speed distribution
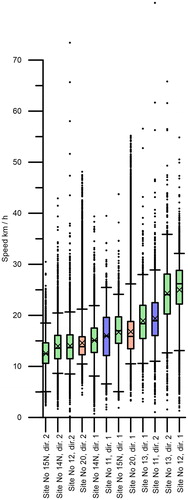
The speed distribution can be asymmetric (see an example in Figure A8, online supplement). Therefore, we used the difference between the 15th and 85th percentiles of the speed distribution (). The widest speed distributions were found at 2 of the commuter routes (sites 11 and 13, both directions) and at one of the downhill paths (site 12, direction 1). There also appeared to be a relationship between average speed and the width of the distribution: The higher the average speed, the greater the speed distribution. Histograms are available in the Appendix for sites 12–15 and 20 (Figures A5–A8, online supplement).
Figure 3. Speed distribution in box plot, divided by direction. Sorted by average speed. Based on weekdays (Monday to Friday). Box = 15th and 85th percentile, respectively. Line in box = The median speed. Cross in box = Average speed. Whiskers limitations = 5th and 95th percentile, respectively. Dots = Extreme values. Direction 1 (dir. 1) is representing the direction towards the city center and direction 2 (dir. 2) is the opposite direction.
Road user composition on pedestrian and cycle paths
Both the average speed and the deviation in cyclists’ speeds can be affected by road user composition. With a large proportion of pedestrians or other slower road users, the number of interactions appeared to increase, which in turn could affect cyclists’ abilities to maintain their desired speed (Eriksson et al. Citation2017). It can also increase the risk of conflicts. To study how the road user composition affected cyclists’ speeds, roadside observations were performed at sites where new measurements were conducted. At sites 12, 13, and 15, the user composition was about 90% cyclists, compared to less than 70% at sites 11 and 14 (see Table A3, online supplement, for more details). The composition of the categories of cyclists shows a large difference between the sites (). Worth noting is the relatively high percentage of electric-assisted bicycles and racing bicycles at sites 11 and 13.
Table 3. Number of observed cyclists and distribution of bicycle type, sites 11–15.
Discussion
Average speed of cyclists at combined pedestrian and cycle paths
The average speed of cyclists passing the measurement sites varied between 12.5 and 26.5 km/h. It is important to note that these results are based on speed data at a certain measurement site; that is, the time mean speed, which differs from the journey speed measured over a distance. It should also be noted that we analyzed speeds collected using different measurement methods. In general, the accuracy and usefulness of detection systems, such as systems that detect axle passages with rubber tubes, is still largely undetermined when it comes to speed measurements of bicycles, but they have been shown to provide accurate results for cars. The camera measurement system used in this study and its ability to detect speeds was evaluated in another study (Danial and Eriksson Citation2017). One of the conclusions was that the measurement equipment worked well in detecting speeds. This suggests that the data obtained in this study are of sufficient quality.
The diurnal, weekly, and yearly speed distributions could only be evaluated at one measurement site. The most noticeable result was that the average speed was lower in January and February (13.8 km/h compared to 15.3–16.1 km/h during the rest of the year). The average speed was also lower during daytime (14.7 km/h) than during other times of the day (15.4–15.8 km/h). Other statistically significant results were also found, but the differences in average speed were small for these comparisons. Our results contradict the conclusions from a previous study conducted in France based on data from a bike share system where average speeds were highest on weekdays mornings regardless of season (Jensen et al. Citation2010). The results of this study show higher speeds in winter. However, these 2 studies are not completely comparable, because Jensen et al. (Citation2010) described journey speed and because bicycles in bike share systems might be used to a greater extent by leisure cyclists and not by fast cycling commuters. In addition, the difference between winter and summer is not comparable between the 2 countries, because France in general has warmer temperatures than Sweden. A study by Boufous et al. (Citation2018) found that higher speed levels were more common during morning peak flows and weekdays compared to afternoon peak flows and weekends, respectively. This is in line with results from our study, although the differences in averaged speed were small. It should also be noted that cyclist flow was rather low at the measurement site in the city of Eskilstuna, and cyclists were in general able to choose their own desired speed. Another site with higher flow might provide other results.
The importance of infrastructure for cyclists’ speeds
Cyclists’ speeds are obviously affected by downhill and uphill slopes. According to Berg (Citation2017), cyclists increase speed from about 20 to 25 km/h for a longer downhill slope with 1% gradient and from 20 to 30 km/h at 3% gradient using the same power output. At site 12 in our study, it was found that the average speed uphill was significantly lower than that in the downhill direction, about 14 km/h compared to 26 km/h. The maximum gradient was 7% at the site. Furthermore, there were lower average speeds at sites near intersections (14 N, direction 2 and 15 N, direction 2, which was also preceded by minor uphill slopes). Based on a study by Chalmers and Gothenburg Municipality (Citation2016), the median speed can be explained (by more than half) by 9 different variables. Two of these are signal crossings (decrease in average speed) and downhill slope (increase in average speed), in line with the results of our study. Whatever the reasons, our conclusion is that it is important to have directional data in further analyses of cyclists’ speeds.
The importance of road user composition for cyclists’ speeds
Road user composition on pedestrian and bicycle paths affects cyclists’ speeds is the. Cyclists’ speeds decrease if the cycle path is shared with pedestrians (Bernardi and Rupi Citation2015; Boufous et al. Citation2018). Our study sites 11 and 14 had the largest pedestrian proportions (about 30%). The other 3 measurement sites had pedestrian proportions of 10% or less. The average speeds at site 11 was 16 km/h (direction 1) and 19 km/h (direction 2) and that at site 14 was around 15 km/h, which is in the lower end of the measured average speeds. It is difficult to conclude whether the speeds were affected by a larger proportion of pedestrians at these sites, because they also differed in other regards, but our results do appear to mirror those of Bernardi and Rupi (Citation2015) and Boufous et al. (Citation2018).
As for the type of bicycle, classic bicycles were the most frequently used type, followed by trekking bicycles. Electric-assisted bicycles were present at all sites but varied from 1% to 10%. Racer bikes also occurred at all sites, with a proportion of between 1% and 15%. There were quite large differences between the sites due to the types of bicycles. For example, site 13 had the largest share of cyclists using electric-assisted bicycles and a relatively large proportion of trekking bicycles but a lower proportion of classic bicycles. One of the highest average speeds was also measured at this site. This might, in addition to the relatively large share of electric-assisted bicycles, be related to the low proportion of classic bicycles and the high proportion of trekking bicycles; that is cyclists choose their bicycle in accordance with their desired speed. Unfortunately, it was not possible to measure the speed of the respective bicycle type during observations within the frame of this study due to handling errors.
A previous study let the cyclists’ themselves assess their desired speed by choosing 1 of 4 groups: Comfort cyclists (often overtaken), normal cyclists (riding at the same speed as others), fast cyclist (often overtaking other cyclists), and electrified cyclists (using electric-assisted bicycles; Kircher et al. Citation2018). The participants then cycled a specified track in the city of Linköping. The results showed that electrified cyclists and fast cyclists had significantly higher base speeds compared to normal and comfort cyclists. Another study showed that cyclists on electric-assisted bicycles rode significantly faster than riders of conventional bicycles. Pedelecs were on average 2 km/h faster and s-pedelecs were 9 km/h faster (Schleinitz et al. Citation2017).
This study is a first step in trying to describe the distribution in cyclists’ speeds. The next step, which would require more in-depth data, is to relate the outcome of accidents to the speed distribution and to investigate how high speeds affect accident outcomes.
Supplemental Material
Download PDF (616.6 KB)Acknowledgments
We thank the municipalities Stockholm, Linköping, and Eskilstuna for letting us use their data and we than Viscando for the loan of the camera measurement system.
Additional information
Funding
Related Research Data
References
- Berg S. 2017. Hållbar Tillgänglig Cykling, [in Swedish]. Sweden: Ramböll; Report 2017-02-01.
- Bernardi S, Rupi F. 2015. An analysis of bicycle travel speed and disturbances on off-street and on-street facilities. Transp Res Proc. 5:82–94.
- Berntman M. 2015. Pedestrians´ accidents and injuries in traffic environment with focus on accidental falls, [in Swedish, with English summary]. Sweden: Lund University, Department of Technology and Society, Transport and Roads; Bulletin 295.
- Boufous S, Hatfield J, Grzebieta R. 2018. The impact of environmental factors on cycling speed on shared paths. Accid Anal Prev. 110:171–176.
- Chalmers and Gothenburg Municipality. 2016. Measuring bikeability: ett FoU-projekt om smartare cykelnätsanalyser. Inledande metodutveckling och analys av planerat cykelnät i Frihamnen, [in Swedish]. Sweden: Gothenburg municipality, Trafikkontoret; PM 2016-10-31.
- Danial J, Eriksson J. 2017. Comparison of cycle flows and speeds from two different cycle measurement equipment’s, [in Swedish, with English summary]. Sweden: Swedish National Road and Transport Research Institute; VTI notat 12-2017.
- Eriksson J, Liu C, Forward S, Forsman Å, Niska A, Tapani A. 2017. The safety effect of an increased cycling – mapping of the current situation for planning for the future. [in Swedish, with English summary]. Sweden: Swedish National Road and Transport Research Institute; VTI report 951.
- Halldórsdóttir K. 2015. Behavioural models for cycling - Case studies of the Copenhagen Region. [PhD dissertation]. Technical University of Denmark, Transport.
- International Transport Forum. 2018. Speed and crash risk. ITF Research Report. International Transport Forum, Paris, France
- Jensen P, Rouquier JB, Ovtracht N, Robardet C. 2010. Characterizing the speed and paths of shared bicycles in Lyon. Transp Res Part D: Transp Environ. 15(8):522–524.
- Kircher K, Nygårdhs S, Ihlström J, Ahlström C. 2018. Cyclist efficiency and its dependence on infrastructure and usual speed. Transp Res Part F: Traffic Psychol Behav. 54:148–158.
- Kircher K, Nygårdhs S, Ihlström J, Ahlström C. 2017. Cyclists’ interaction with mobile devices, the infrastructure and other road users, [in Swedish, with English summary]. Sweden: Swedish National Road and Transport Research Institute; VTI report 940.
- Niska A, Eriksson J. 2013. Cycling accident statistics. Background information to the common policy strategy for safe cycling, [in Swedish, with English summary]. Sweden: Swedish National Road and Transport Research Institute; VTI report 801.
- Niska A, Gustafsson S, Nyberg J, Eriksson J. 2013. Single bicycle accidents. Analysis of injury data and interviews, [in Swedish, with English summary]. Sweden: Swedish National Road and Transport Research Institute; VTI report 779.
- Schepers JP, Fishman E, den Hertog P, Wolt KK, Schwab AL. 2014. The safety of electrically assisted bicycles compared to classic bicycles. Accid Anal Prev. 73:174–180.
- Schleinitz K, Petzoldt T, Franke-Bartholdt L, Krems J, Gehlert T. 2017. The German Naturalistic Cycling Study – Comparing cycling speed of riders of different e-bikes and conventional bicycles. Safety of Science. 92:290–297.
- Swedish Transport Administration. 2017. Hastighetsundersökningen 2016 – Teknisk rapport. [in Swedish]. Sweden: Swedish Transport Administration; Publication 2017:068.
- Ton D, Cats O, Duives D, Hoogendoorn S. 2017. How do people cycle in Amsterdam, Netherlands? Estimating cyclists’ route choice determinants with GPS data from an urban area. Transp Res Rec. 2662(1):75–82.