
Abstract
Objective
The aim of the present study was to investigate the relationship between bicycle helmet use and safety behavior at signalized intersections. Two hypotheses were investigated: The first states that bicycle helmet use leads to risker behavior because of the increased sense of protection (risk compensation), the other states that helmeted cyclists have a general inclination toward safer behavior (safety package) and that helmet use is one of several behaviors for improving safety.
Method
Based on video recordings of 1031 cyclists at 12 signalized intersections in Denmark, two indicators of risky behavior were compared between helmeted and unhelmeted cyclists: Speed and time after the onset of yellow at which the cyclists crossed the stop line. Linear regression models were developed with gender, type of bicycle, and intersection characteristics as predictor variables, in addition to helmet use.
Results
Helmeted and unhelmeted cyclists do not differ in how many seconds after the onset of yellow they cross the stopping line. This is consistent with the absence of both risk compensation and safety package, alternatively with a general inclination of helmeted cyclists toward safer behavior which is about offset by risk compensation. Helmeted cyclists had higher speed on average, which indicates that risk compensation may occur. However, the higher speed may also be due to the generally better fitness of helmeted cyclists which is likely to result from larger cycling volumes. Moreover, the effect of helmet use on speed may be overestimated because of a lack of control for potential confounding variables. The results show further that, regardless of helmet use, before-red (lights on a separate bicycle signal shift to red before the main signal) is related to later crossings of the stop lane after the onset of yellow and that cyclists stop earlier on average at intersections with right-turn signals.
Conclusions
The results do not provide support for the position that promoting or mandating bicycle helmet use will have adverse safety effects because of more risky behavior among helmeted cyclists.
Introduction
The aim of the present study is to compare behavior at signalized intersections in Denmark between helmeted and unhelmeted cyclists and to investigate possible differences in risk taking. In Denmark, where bicycle helmet use is voluntary, helmet use among cyclists (including pedelecs) has increased from 6% in 2004 to 39% in 2017 according to observations by Rådet for Sikker Trafik (“The Transport Safety Organization,” Larsen and Nielsen Citation2018). In countries with mandatory bicycle helmet legislation, helmet use is typically well above 70% and in some legislations even above 90% (Olivier et al. Citation2019).
Bicycle helmet use is associated with large reductions in injury risk and mandatory bicycle helmet legislation has also been found to reduce the incidence of head injury (Olivier and Creighton Citation2017; Høye Citation2018a, Citation2018b). However, beyond reducing injury risk, helmet use may also have an impact on cycling behavior and crash risk. Moreover, there may be general differences between helmeted and unhelmeted cyclists that affect cycling behavior and crash risk.
There are two hypotheses about the relationship between bicycle helmet use and behavior: (1) Risk compensation hypothesis: Helmeted cyclists take more risks while cycling; and (2) Safety package hypothesis: Helmeted cyclists behave more safely. These hypotheses are not mutually exclusive: A safety oriented cyclist may choose to wear a helmet but then adopt a riskier cycling style because of the helmet.
According to the first hypothesis, the use of bicycle helmets increases the sense of security and thus increases risky behavior, such as cycling fast or against red lights (Fyhri et al. Citation2018). According to the theoretical framework developed by Elvik (Citation2004), bicycle helmets may lead to behavioral adaptation because they are a salient measure with a potentially large effect on injury severity. Possible types of behavioral adaptation among cyclists are increased speed and general risk taking. Thus, behavioral adaptation may lead to utility gains (shorter travel time). On the other hand, injury reducing measures, such as bicycle helmets, are generally less prone to behavioral adaptation than crash reducing measures (Elvik Citation2004). Moreover, the concept of risk compensation is controversial. The theoretical basis is poor and the concept of an internal “risk monitor” which is continuously assessing the current risk, is questionable (Lewis-Evans et al. Citation2011).
The risk compensation hypothesis is methodologically challenging to investigate, and most empirical studies among cyclists do not support it (Esmaeilikia et al. Citation2019). For example, after the introduction of mandatory bicycle helmet legislation in Australia, helmet use increased by over 40% points (from around 25–30%), but the occurrence of several types of illegal cycling behavior, such as riding against red lights, riding on the footpath or riding without lights in the dark, was about unchanged or decreased (Walker Citation1991). Some attempts have been made to investigate this hypothesis experimentally. In a randomized crossover study, Fyhri et al. (Citation2018) did not find any significant effect of helmets on speed on a 2.4 km downhill route among cyclists who usually were not using a bicycle helmet. Phillips et al. (Citation2011) found decreased speed among routine helmet users on a 400-m downhill route when they were not wearing a helmet. However, no effects of helmet use on speed were found among cyclists who were not usually using a helmet.
According to the second hypothesis, cyclists who (voluntarily) are using helmets are generally behaving more safely. Empirical studies show that helmeted cyclists are less likely to commit red-light violations, to ride under the influence of alcohol, and to commit other traffic law violations, than unhelmeted cyclists. Such differences were found in countries with and without mandatory bicycle helmet legislation (McGuire and Smith Citation2000; Andersson and Bunketorp Citation2002; Lardelli-Claret et al. Citation2003; Olivier and Terlich Citation2016). None of these studies have explicitly investigated the direction of the relationship, i.e., if helmet wearing affects or is just related to other safety related types of behavior.
Relationships between speed and bicycle helmet use have been investigated in only few studies (in non-experimental settings). In a retrospective case-control study, Lardelli-Claret et al. (Citation2003) did not find any relationship between helmet use and speeding among crash involved cyclists. In a naturalistic cycling study, Schleinitz et al. (Citation2018) found slightly higher speeds on trips on which participants wore a helmet than on trips without a helmet, but the relationship disappeared when trip length was statistically controlled for. The studies by Schleinitz et al. (Citation2018) and Fyhri et al. (Citation2012) suggest that helmet use often is a part of a “package,” in the sense that helmeted cyclists often also use other safety equipment, cycle a lot, and are fond of speed. Moreover, helmet use is on average higher among commuter cyclists and those cycling for training purposes (Rodgers Citation2000). Both commuter and training cyclists can be assumed to be fitter on average than other cyclists. Thus, these cyclists are cycling fast because they want to and because they can, rather than because they are using helmets.
In the present study, the safety behavior of cyclists at signalized intersections has been studied by measuring speed and the time after the onset of yellow at which they cross the stop line. The later a cyclist enters the intersection, the greater will be the chance of coming in conflict with traffic from the side road if speed is held constant. According to the risk compensation hypothesis, helmeted cyclists would be expected to cross the stop line later, while they according to the safety package hypothesis would be expected to cross earlier than unhelmeted cyclists. Speed is in other studies often regarded as an indicator of safety behavior, assuming that higher speed implies a riskier cycling style. The background for this assumption is mainly the well documented relationship between speed and injury risk (Elvik et al., Citation2019).
Method
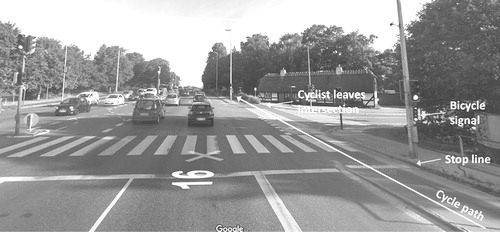
Cyclist behavior has been studied with the help of video recordings at 12 signalized intersections in the metropolitan area of Greater Copenhagen in Denmark. All study intersections have bicycle paths in the direction in which cyclists were observed. One intersection is a T-junction (three-legged), while the remaining 11 intersections have four legs. The speed limit for motorized traffic is between 50 and 70 km/h, and the size of the intersections varies from two to six through-lanes. A typical study intersection is shown in . At most intersections, only cyclists on either main or side road were observed. At a few intersections, cyclists were observed on both the main and side road (depending on the availability of video footage).
Figure 1. Study intersection (example; Source: Google maps, Street view).
The video recordings were made by Via trafik, using own MioVision Scout cameras during August, September, and October 2017 within the project Determining safety times at traffic signals (Jensen et al. Citation2018). This project determined the criteria for the choice of intersections, camera placement, and camera settings but it allowed the use of the material in the present study for observing cyclist behavior. Video footage was available for 1031 cyclists. It was analyzed with the “Watch dog”-software RUBA (Road User Behavior Analysis), developed at the University of Aalborg in Denmark (Madsen et al. Citation2016). The cameras were positioned on lighting poles; they were visible but not easily recognizable as video recorders.
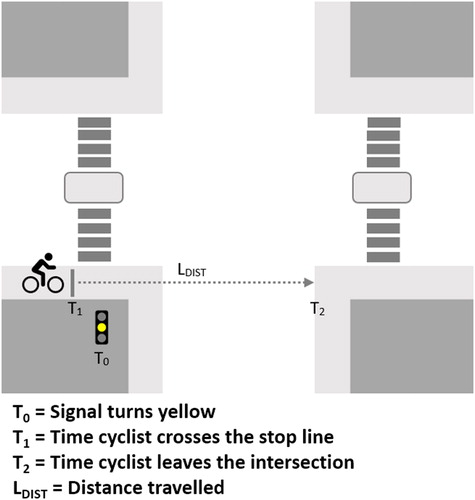
Types of behavior that were studied are time after yellow and speed. Time after yellow is the time (in seconds) after the signal switches from green to yellow, as the cyclist crosses the stop line. In Denmark, the yellow light always appears for 4 s before the signal turns to red, regardless of the type of signal (main signal, bicycle signal, or other). Speed is the cyclists’ speed in meters per second. It is calculated based on the time elapsed between crossing the stop line and exiting the intersection (see ). Since video footage was used for calculating speed, reliable speed measurements at the stop line or before the intersection were not possible. Both parameters were measured for one cyclist crossing the intersection within each cycle. When there was more than one cyclist, the last one was used. There were not too many cyclists and the last one was in most cases in free flow and not slowed down by other cyclists. Only cyclists continuing through the whole intersection were included, cyclists who turned left or right at the intersection, were not included.
Figure 2. Speed measurement.
For each cyclist, the following variables were registered manually from the video recordings: Helmet use (yes/no), gender (male/female), and type of bicycle. Types of bicycle were: Racing bicycle, mountain bike, pedelec, cargo bike, and ordinary bicycle (mostly classical and hybrid bicycles).
Characteristics of the intersections that were included in the analysis are:
Gradient: Whether the cyclists’ path through the intersection is uphill, flat or downhill (uphill and downhill is defined as cycle paths with a gradient of at least ±25‰).
Separate bicycle signal: This is an additional signal specifically for cyclists. It is usually located lower than the main signal and directly beside the bicycle path (see ). Before-red and right-turn signals can only be found at intersections with a separate bicycle signal.
Before-red: With before-red, the bicycle signal turns from green to yellow and from yellow to red before the main signal. All intersections with before-red have a separate bicycle signal.
Right-turn signal: With a right-turn signal, the main signal has an additional green arrow that allows right-turning movements for motor vehicles when green, after the main signal has turned to red. All intersections with a right-turn signal have a separate bicycle signal, but not all have before-red.
Discontinued bicycle path: This is a bicycle path that terminates at some distance before the stop line (cyclists from the bicycle path merge with right-turning motor vehicles) or continues to the stop line but not beyond. This variable is perfectly related to gradient. All discontinued bicycle paths are on uphill grades, while all other bicycle paths are flat or on downhill grades.
Results
Descriptive statistics for time after red and speed
Descriptive statistics for time after yellow and speed among helmeted and unhelmeted cyclists are shown in . For mean time after yellow, there is almost no difference between helmeted and unhelmeted cyclists; those with a helmet are on average crossing the stop line 0.04 s later than those without a helmet. Mean speed is 0.41 m/s (or 1.47 km/h) higher among helmeted cyclists than among those without a helmet, which is far less than one standard deviation (SD).
Table 1. Descriptive statistics for time after red and speed, helmeted vs. unhelmeted cyclists.
The results for time after yellow show that most cyclists cross the stop line before the signal turns to red (it turns to red 4 s after it switches from green to yellow). The proportion of cyclists crossing at red light is 16.1% among helmeted cyclists and 16.7% among those without a helmet (16.4% in total).
shows average time after yellow and speed for all cyclist and intersection related variables (except for vertical grade), including red-light running. Red-light running is here defined as crossing the stopping line after the light switched to red (which is an offense in Denmark). Descriptive statistics for all cyclist and intersection related variables are in , online supplement.
Figure 3. Mean time after yellow and speed by cyclist and intersection related variables.
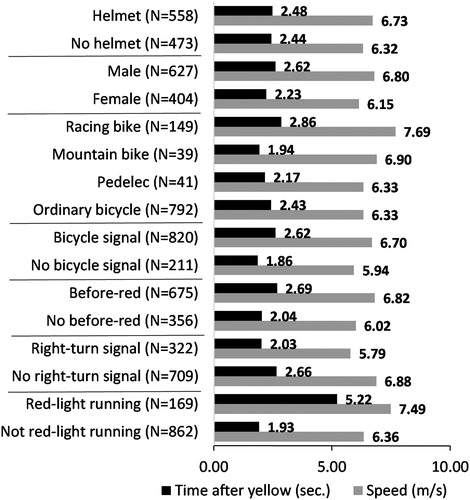
The results in (and online supplement ) show that red-light running cyclists have higher speed on average than those crossing the stop line at yellow. The bivariate correlation between time after yellow and speed is r = .292 (p < .000). The results for cyclist and intersection related factors are discussed below.
Helmet use by bicycle type and gender
shows the percentages of helmeted cyclists by gender and type of bicycle. Women are more often wearing a bicycle helmet than men on all types of bicycle. Helmet use is by far highest among those riding a racing bicycle and it is lowest among those riding a cargo bike. Between other types of bicycle, there are no big differences when the results for all cyclists are combined.
Table 2. Helmet use by bicycle type and gender.
Multivariate analysis for time after yellow and speed
The relationships between helmet use, cyclist and intersection related variables on the one hand and time after yellow and speed on the other hand, has been investigated by calculating linear regression models with either time after yellow or speed as the dependent variable.
For each dependent variable, four models have been calculated: The first with helmet use as the only predictor variable, the second with helmet use and cyclist related variables (gender and type of bicycle), the third with helmet use and intersection related variables, and the fourth with all predictor variables included in the model. The unstandardized coefficients (with p-values) for helmet use in all models are shown in . The full models are shown in online supplement for time after yellow and in online supplement for speed. Model characteristics are summarized in for all models, including R-squared and adjusted R-squared, as well as mean square error (MSE) and the square root of MSE, as goodness-of-fit statistics. The number of cyclists varied between intersections, but this did not have any substantial effects on the results.
Table 3. Linear regression models for time after yellow and speed; unstandardized coefficients for helmet use and model characteristics (N = 1031 for all models).
The results of the multivariate models () show that helmet use is not related to time after yellow which is in accordance with the results from the descriptive analysis (). However, helmeted cyclists are on average cycling faster than those without a helmet (). The speed coefficient for helmet use is smaller in the two models including cyclist related variables than in the other models. This indicates that gender and type of bicycle type can explain a part of the relationship between helmet use and speed.
The full models (online supplement ) show that male cyclists are cycling faster, and that they cross the stop line later than female cyclists on average. Among the different types of bicycle, racing bicycles are the fastest and the last to cross the stop line. Mountain bikes are second-fastest; cargo bikes are slowest. These results are consistent with the results from the descriptive analysis.
The cyclists’ speed is, not surprisingly, related to gradient. They are fastest downhill and slowest uphill. Time to yellow is somewhat later on uphill grades than otherwise. However, the p-value of the coefficient is relatively large and in the descriptive analysis, time to yellow is earlier on uphill grades and later on downhill grades than on flat grades.
All uphill grades have discontinued bicycle paths, while the bicycle paths on all flat and downhill grades continue to the intersection. We do not know how type of bicycle path is related to speed or time after yellow. It is therefore not possible to determine whether the relationships between gradient and speed and time after yellow would have been different if all bicycle paths had been of the same type.
At intersections with before-red, cyclists crossed the stop line later and faster than at other intersections. With a separate bicycle signal, they crossed the stop line later, but not faster, although the descriptive analysis showed that average time after yellow is later at intersections with separate bicycle signal. The latter is probably due to the effect of before-red. In other words, a separate bicycle signal in itself is not directly related to speed, but all intersections with before-red, which is related to speed, have a separate bicycle signal.
At intersections with a right-turn signal, cyclists cross the stop line earlier on average than at intersections without a right-turn signal.
The goodness-of-fit statistics in show that the full models provide a better fit than partial models. For time after yellow, including gender and type of bicycle in the models, improves the models only slightly. Adding the intersection related variables, improves the models far more. For speed, the pattern is the same, but adding gender and type of bicycles leads to larger improvements than for time after yellow. These results indicate that the intersection related variables have a greater effect on time after yellow and speed than the cyclist related variables.
Discussion
The present study aimed to investigate two hypotheses about the relationship between bicycle helmet use and behavior. The risk compensation hypothesis predicts riskier behavior among helmeted cyclists (assuming that helmet use leads to riskier behavior) and the safety package hypotheses predicts the opposite (assuming that safety oriented cyclists are more likely to use a helmet). The hypotheses are not mutually exclusive which implies that the design of the present study only allows conclusions about the relative strengths of the two mechanisms, but not about their presence or absence.
The results show no differences between helmeted and unhelmeted cyclists regarding how late they enter signalized intersections after the onset of yellow. This result is consistent with either the absence of both risk compensation and safety package, or the presence and about equal strength of both. In other words, if helmeted cyclists have a general inclination toward safer behavior, this is about offset by risk compensation.
The results show further that helmeted cyclists cycle faster on average than unhelmeted cyclists. If one interprets high speed as risk taking behavior, this result is consistent with the risk compensation hypothesis and a safety-package effect that is absent or smaller than the risk compensation effect. In other words, the result for speed is consistent with the assumption that helmet use leads to riskier behavior and inconsistent with the assumption that helmeted cyclists generally behave so safely that this offsets the risk compensation effect.
However, the relationship between helmet use and speed gets weaker when the cyclists’ gender and type of bicycle are controlled for statistically, indicating that a part of the relationship between helmet use and speed results from differences between helmeted and unhelmeted cyclists in terms of gender and type of bicycle. For example, cyclists on racing bicycles are on average faster and more often wearing a helmet than cyclists on other bicycles. There are far more characteristics of cyclists that are related to both cycling speed and helmet use, such as age, cycling volume and general fitness (Rodgers Citation2000; Olivier and Terlich Citation2016; Schleinitz et al. Citation2018). If such factors had been statistically controlled for in addition to gender and type of bicycle, the relationship between helmet use and speed would most likely have diminished further. This implies that the risk compensation effect is likely to be smaller than it appears (or offset by a safety package effect).
Moreover, the interpretation of higher speed among helmeted cyclists as riskier behavior in other studies is not necessarily adequate in the present study. Firstly, most intersections are level, while other studies (e.g., Phillips et al. Citation2011; Fyhri et al., Citation2018), measured speed on steep downhill grades to avoid confounding effects of physical fitness. Helmeted cyclists are probably fitter than unhelmeted cyclists, and thus able to cycle faster. They are cycling more on average (Rodgers Citation2000; Høye & Hesjevoll, Citation2016) and in the present study they are often using racing or mountain bikes which indicates that they are more likely to ride for the purpose of fitness. Secondly, speed was measured while the cyclists crossed the intersection after having crossed the stop line at yellow or even after the onset of red. The desire to clear the intersection as fast as possible may have amplified the effect of fitness on speed. If helmeted cyclists also are generally more focused on safety, they may have been additionally motivated to clear the intersection as fast as possible.
Speed and time after yellow (and red-light running) were found to be positively correlated. Cyclists who are cycling fast while approaching the intersection, may cross the stop line later than slower cyclists, and then continue at high speed through the intersection. Some of them may have been too fast for stopping safely and therefore chosen to cross at the beginning of the red cycle. Another possible explanation is that cyclists who are crossing the stop line late, accelerate in order to clear the intersection as fast as possible.
In summary, the results indicate that risk compensation among helmeted cyclists either does not occur or, if it occurs, that it about offsets the general inclination of helmeted cyclists toward safer behavior. According to the results for speed, there may be a risk compensation effect that is somewhat stronger than a safety-package effect. However, high speed cannot necessarily be regarded as an indicator of risky behavior. Higher speed among helmeted cyclists may be affected by their general fitness level (rather than risk compensation), and the relationship between helmet use and speed may be overestimated because of a lack of control for confounding factors such as age and cycling volume.
The results for intersection related variables reveal some types of behavioral adaptation. At intersections with before-red, cyclists cross the stop line later and faster than at intersections without before-red. This indicates that cyclists regard cycling against a red bicycle signal as more acceptable than cycling against a red main signal. Thus, before-red on separate bicycle signals cannot always be expected to have the desired effect.
Right-turn signals on the other hand are related to earlier crossings of the stop line. The likely explanation is that cyclists must expect right-turning vehicles crossing their path with a right-turn signal, but not without. In other words, cyclists adapt to right-turn signals by behaving more safely. This indicates that right-turn signals are not necessarily a safety problem for cyclists.
Based on the results of the present study, we can draw the following conclusions:
Helmeted cyclists do not on average show riskier behavior than unhelmeted cyclists. They cycle faster on average, but this may be due to other mechanisms.
If risk compensation occurs, it is unlikely to more than offset a general inclination of helmet users toward safer behavior.
The assumption that promoting or mandating bicycle helmet use will have adverse safety effects because of riskier behavior among helmeted cyclists, is not supported.
To study the risk compensation and safety package hypotheses separately, a within-subject longitudinal design would be preferable.
Before-red for cyclists cannot always be expected to have the desired effect. Additional adjustments to the signaling or infrastructure adjustments may have to be considered for improving the safety of cyclists.
Right-turn signals will not necessarily have adverse safety effects for cyclists.
Supplemental Material
Download MS Word (56.8 KB)Acknowledgments
This research did not receive any specific grant from funding agencies in the public, commercial, or not-for-profit sectors.
References
- Andersson AL, Bunketorp O. 2002. Cycling and alcohol. Injury. 33(6):467–471. doi:10.1016/S0020-1383(02)00028-1
- Elvik R. 2004. To what extent can theory account for the findings of road safety evaluation studies? Accid Anal Prev. 36(5):841–849. doi:10.1016/j.aap.2003.08.003
- Elvik R, Vadeby A, Hels T, van Schagen I. 2019. Updated estimates of the relationship between speed and road safety at the aggregate and individual levels. Accid Anal Prev. 123:114–122. doi:10.1016/j.aap.2018.11.014
- Esmaeilikia M, Radun I, Grzebieta R, Olivier J. 2019. Bicycle helmets and risky behaviour: A systematic review. Transp Res Part F Traffic Psychol Behav. 60:299–310. doi:10.1016/j.trf.2018.10.026
- Fyhri A, Bjørnskau T, Backer-Grøndahl A. 2012. Bicycle helmets: A case of risk compensation?. Transp Res Part F Traffic Psychol Behav. 15(5):612–624. doi:10.1016/j.trf.2012.06.003
- Fyhri A, Sundfør H, Weber C, Phillips R. 2018. Risk compensation theory and bicycle helmets–Results from an experiment of cycling speed and short-term effects of habituation. Transp Res Part F Traffic Psychol Behav. 58:329–338. doi:10.1016/j.trf.2018.06.025
- Høye A. 2018a. Bicycle helmets: To wear or not to wear? A meta-analyses of the effects of bicycle helmets on injuries . Accid Anal Prev. 117:85–97. doi:10.1016/j.aap.2018.03.026
- Høye A. 2018b. Recommend or mandate? A systematic review and meta-analysis of the effects of mandatory bicycle helmet legislation. Accid Anal Prev. 120:239–249. doi:10.1016/j.aap.2018.08.001.
- Høye A, Hesjevoll IS. 2016. Synlige syklister - Bruk av sykkellys i Norge og effekt på ulykker [Bicycle conspicuity – Use and effects of bicycle lights in Norway]. TØI Report1478/2016. Oslo: Institute of Transport Economics.
- Jensen ML, Knudsen TA, Møller M, Lahrmann HS. 2018. Fastlaeggelse af sikkerhedstider i trafiksignalanlaeg [Determining safety times at traffic signals]. Via Trafik and Aalborg University.
- Lardelli-Claret P, Dios J, Jimenez-Moleon J, Garcia-Martin M, Bueno-Cavanillas A, Galvez-Vargas R. 2003. Risk compensation theory and voluntary helmet use by cyclists in Spain. Inj Prev. 9(2):128–132. doi:10.1136/ip.9.2.128
- Larsen S, Nielsen KS. 2018. Hjelmrapport – Brug af cykelhjelm 2017 [Helmet report – Use of bicycle helmet 2017]. Rådet for Sikker Trafik [The transport safety organization].
- Lewis-Evans B, de Waard D, Brookhuis KA. 2011. Speed maintenance under cognitive load - Implications for theories of driver behaviour. Accid Anal Prev. 43(4):1497–1507. doi:10.1016/j.aap.2011.02.030
- Madsen TK, Lahrmann H, Christensen PM, Bahnsen C, Jensen MB, Moeslund TB. 2016. RUBA – Videoanalyseprogram til trafikanalyser [RUBA – Video analysis program for traffic analyzes]. Aalborg University.
- McGuire L, Smith N. 2000. Cycling safety: Injury prevention in Oxford cyclists. Inj Prev. 6(4):285–287. doi:10.1136/ip.6.4.285
- Olivier J, Boufous S, Grzebieta R. 2019. The impact of bicycle helmet legislation on cycling fatalities in Australia. Int J Epidemiol. 48(4):1197–1203. doi:10.1093/ije/dyz003
- Olivier J, Creighton P. 2017. Bicycle injuries and helmet use: a systematic review and meta-analysis. Int J Epidemiol. 46(1):278–292. doi:10.1093/ije/dyw153
- Olivier J, Terlich F. 2016. The use of propensity score stratification and synthetic data to address allocation bias when assessing bicycle helmet effectiveness. Paper presented at the 2016 IRCOBI Conference Proceedings–International Research Council on the Biomechanics of Injury; Malaga, Spain.
- Phillips RO, Fyhri A, Sagberg F. 2011. Risk compensation and bicycle helmets. Risk Anal. 31(8):1187–1195. doi:10.1111/j.1539-6924.2011.01589.x
- Rodgers GB. 2000. Bicycle and bicycle helmet use patterns in the United States in 1998. J Saf Res. 31(3):149–158. doi:10.1016/S0022-4375(00)00033-5
- Schleinitz K, Petzoldt T, Gehlert T. 2018. Risk compensation? The relationship between helmet use and cycling speed under naturalistic conditions. J Saf Res. 67:165–171. doi:10.1016/j.jsr.2018.10.006
- Walker M. 1991. Law compliance among cyclists in New South Wales, April 1991. Roads and Traffic Authority, Rosebery, NSW.