
Abstract
Objectives
Different design alternatives used to separate freeway-opposing traffic may produce varying safety levels. State-of-the-art design guidelines have provided guidance in respect to a number of median features such as width, slope, and barrier installation. Guidance provided has been based on benefit-cost procedures; however, because project costs may significantly vary across different countries/jurisdictions, findings from benefit-cost procedures may be meaningless on a broader geographical scope. The objective of this study is to quantify the safety level of a number of design alternatives commonly used to separate opposing freeway traffic based solely on annualized crash costs.
Methods
The safety performance of 14 design alternatives were assessed using the Roadside Safety Analysis Program (RSAPv3).
Results
A test-level 3, low-tension cable barrier installed in the middle of a wide, hazard-free median was found to be the safest design alternative. Road sections containing: i) cable barriers were found to be safer than those containing w-beam guardrails, ii) low-tension cable barriers installed in the middle of the median were found to be safer than those containing high-tension cable barriers installed on one side of the median, regardless of median width, iii) wide, hazard-free medians were found to be safer than those containing WB guardrails, and iv) concrete barrier installations were found to be only safer than those containing unshielded medians, except when the median was 20 meters wide and hazard-free.
Conclusions
This paper not only provides evidence that some of the design alternatives often installed in real-world scenarios are not the safest, but it also discusses how some of these alternatives may not be the most cost-effective either. These findings make this study relevant and timely, as designers and policy/decision makers should always seek to maximize safety while optimizing the allocation of limited public funds.
Introduction
Background
Single-vehicle, run-off-road (SVROR) crashes have been found to account for a significant number of all road crash fatalities worldwide (Roque et al. Citation2015; Shawky et al. Citation2016). In the United States (US), for example, the number of fatalities caused by SVROR crashes have historically been elevated (National Highway Traffic Safety Administration Citation2018). Thus, literature suggests that, in order to improve road safety, great focus needs to be placed on preventing SVROR crash-related injuries.
A portion of these SVROR crashes may happen in the median, which can be defined as the portion of the highway cross-section separating opposing traveling traffic, including the left shoulders. Previous research has provided guidance in respect to a number of median features such as width, slope, and barrier presence (Graham et al. Citation2014), including:
Wider medians should be preferred. Wider medians have been found to decrease the likelihood of cross-median crashes (CMCs) but to increase the propensity for rollover crashes, with CMCs being defined as crashes where the vehicle departs from the left side, fully crosses the median and strikes a vehicle traveling in the opposing lanes. However, because CMCs have been found to be more severe than rollover crashes, the net effect due to the adoption of wider medians has been lowered crash costs;
6H:1V (i.e., 1 meter vertical drop for every 6 meters of horizontal distance) median slopes may be acceptable. However, 8H:1V or flatter median slopes should be preferred; and
Barrier installation is (a) recommended where the median is 9.1 meters in width or less and the average daily traffic (ADT) is higher than 20,000 vehicles per day (vpd), (b) considered where the median is wider than 9.1 meters but less than 15.2 meters in width and the ADT is higher than 20,000 vpd, and (c) optional where the median is wider than 15.2 meters in width or the ADT is lower than 20,000 vpd.
State-of-the-art design guidelines have been based on research previously cited (AASHTO Citation2011). Thus, while guidelines providing guidance on median design elements such as median configuration and barrier presence/type are available, these guidelines focus on (i) identifying when specific design features should be adopted, (ii) providing specific values or value ranges for these features based on a set of traffic/road/roadside characteristics, and (iii) basing design recommendations on benefit-cost procedures. The problem is that while taking costs into consideration and comparing them to the reaped benefits of each design option is a sound approach, costs may significantly vary across different countries, making findings from benefit-cost procedures meaningless on a broader geographical scope. This is important because different jurisdictions have adopted different design options; yet, not all jurisdictions have backed their design selection by local research.
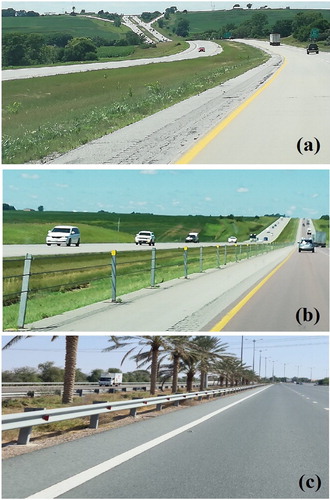
For example, shows a wide, hazard-free median, while shows a cable barrier installed on one side of a relatively narrow, hazard-free median. These two different median design alternatives were observed in the US state of Illinois during the summer of 2020. This suggests that the decision to adopt different design alternatives might have been influenced by factors such as different traffic volumes and median widths (Miaou et al. Citation2005). On the other hand, in the United Arab Emirates (UAE), as well as in other countries in the Gulf Council Cooperation (GCC) region, medians have often contained objects such as palm trees and light poles shielded by w-beam (WB) guardrails, as shown in . In the GCC countries, road sections containing cable barriers on the outside edge of each median shoulder as shown in Figure A1 (see online supplement), as well as road sections containing no median provision but rather the installation of concrete barriers can also often be found, as shown in Figure A2 (see online supplement).
Figure 1. (a) Hazard-free median in Illinois, USA, (b) Cable barrier installed on one side of a hazard-free median in Illinois, USA, and (c) W-beam guardrail installed on both sides of a hazard-populated median in the UAE.
Therefore, there is a need to assess design alternatives to separate opposing-freeway traffic based solely on safety performance in relation to a combination of median presence/absence, median width, and barrier presence/type characteristics. Similar research methodology has successfully been implemented in the past to study the performance of safety treatments for roadside culverts (Albuquerque et al. Citation2011).
Research objectives
The objective of this study is to quantify the safety performance of a number of design alternatives often used to separate freeway-opposing traffic based on a combination of median presence/absence, median width, and barrier presence/type characteristics. Safety performance shall be quantified in terms of annualized crash costs. Thus, the primary objective of this research is neither to investigate the safety performance of all design alternatives possible, nor to investigate the impact individual design features (e.g., median width) have on safety performance, which has been widely investigated by previous studies now available in the literature (AASHTO Citation2011).
Methods
Design alternatives
The baseline design alternative was based on a road section located at geographic coordinates 24°12'44.73"N and 55°29'41.33"E. The other design alternatives were then created based on variations from the baseline alternative in respect to median width, barrier type, barrier presence/absence, and hazard presence/absence. shows a picture taken from the baseline design alternative. contains design variations to the designs contained in . also includes a design option with no physical median provision but rather a concrete barrier separating opposing traffic, resulting in 14 design alternatives.
Table 1. Fourteen design alternatives to separate freeway-opposing traffic.
Simulation tool
The design alternatives were simulated using the Roadside Safety Analysis Program (RSAPv3). RSAPv3 is a computer program used for performing benefit-cost analyses of roadside design alternatives (Ray et al. Citation2012a). The original version of the Roadside Safety Analysis Program (RSAP) was developed under the National Cooperative Highway Research Program (NCHRP) project 22-9(1) (Mak and Sicking Citation2003). RSAPv3 is composed of 4 modules:
Encroachment probability module: it assigns an encroachment rate for a highway segment based on adjusted real-world encroachment data (Hutchinson Citation1962; Cooper Citation1981). That is, RSAPv3 uses adjusted Cooper’s data;
Crash prediction module: it assigns the likelihood of a crash occurrence given an encroachment has happened. RSAPv3 assigns vehicle trajectories and identifies whether those trajectories are intercepted by user-built obstacles. These vehicle trajectories are based on crash reconstruction data (Mak et al. Citation2010);
Severity prediction module: it assigns a crash severity given a collision has occurred. This module accounts for object collision and penetration, as well as vehicle vaulting or rollover. It uses the Equivalent Fatal Crash Cost Ratio (EFCCR) to determine the total crash cost for each trajectory case. The effective EFCCR value for each collision is determined by multiplying the EFCCR value for each collision by the probability of the collision event occurring. RSAPv3 uses EFCCR instead of the previously used Severity Index (SI), as SI was heavily based on subjective judgment whereas EFCCR relies on observable crash data (Ray et al. Citation2012b). The EFCCR values used in this study are contained in Table 35 from NCHRP report 22-27 (Ray et al. Citation2012b); and
Benefit/cost analysis module: it compares crash costs calculated by the modules previously described (i.e., based on the number and severity of predicted crashes) to project (i.e., construction, maintenance, and repair) costs associated with each user-inserted design alternative. This module follows an incremental benefit-cost procedure in the sense that design alternatives are compared to each other in a pairwise fashion.
Thus, RSAPv3 uses a conditional encroachment-collision-severity approach to determine the frequency, severity and societal cost of roadside crashes for each user-entered design alternative. RSAPv3 accompanies the 2011 AASHTO RDG (AASHTO Citation2011).
Simulation parameters
Simulated scenarios were created based on a 1-km long, flat-terrain road section. shows the values for the traffic, road, and roadside attributes used to build the modeled road scenarios. The values for attributes listed in were based on the baseline scenario shown in , which is located at geographic coordinates 24°12'44.73"N and 55°29'41.33"E. Thus, spacing between trees and between light poles of 7.5 and 70 meters, respectively, were used. Tree and light pole diameter values of 0.6 and 0.5 meters, respectively, were used. Values related to traffic attributes were provided by the Abu Dhabi Department of Transport (DOT).
Table 2. Traffic, road, and roadside attributes used to build the modeled road scenarios.
The posted speed limit selected was 120 km/h, which is the highest posted-speed-limit value available in RSAPv3. The total number of lanes was 6, meaning that there were 3 lanes in each traffic traveling direction. Lane and left shoulder values were 3.6 and 3 meters, respectively, which are the values typically recommended for freeway facilities (AASHTO Citation2018). A narrow and wide median width was defined to be 10 and 20 meters, respectively. The rationale behind choosing the 10-meter median width value was (i) a 9-meter clear-zone (CZ) width has long been recommended for rural freeways (AASHTO Citation1977) and (ii) state-of-the-art guidelines recommend barrier installation on road segments with median width less than 10 meters and traffic volume higher than 20,000 vehicles per day (vpd) (AASHTO Citation2011). On the other hand, the rationale behind choosing the 20-meter median width value was (i) state-of-the-art guidelines consider barrier installation as optional on road segments with median widths of at least 15 meters, (ii) previous research has recommended median widths wider than 15 meters (Graham et al. Citation2014) and have shown that median widths of 20 meters or wider may be cost-justified at certain CMC rates and average annual daily traffic (AADT) levels (Miaou et al. Citation2005), and (iii) median widths of 20 meters or wider have been adopted in the GCC region. With respect to barrier performance level, test-level (TL) 3 cable and WB guardrails, as well as TL-4 concrete barriers, were selected.
An encroachment increment of 0.5 m was used. The minimum number of trajectories used at each encroachment location was 1, which was the only number of trajectories that yielded an acceptable composite score value. That is, RSAPv3 assigns scores to trajectories as a means to select those that have characteristics similar to trajectories in the scenario under investigation. A “special edge” feature was used to define the median edges.
RSAPv3 has default values for injury costs which are now outdated. These values correspond to the 2009 Federal Highway Administration (FHWA) Economic Value of a Statistical Life (VSL) (Szabat Citation2009). In an effort to use more recent cost figures, the 2016 VSL was used, which corresponds to 9.6 million US dollars (Moran Citation2016). This cost was adjusted by inflation based on the Consumer Price Index (CPI) in order to determine the 2020-equivalent cost value, which was found to be 10.3 million US dollars (U.S. Bureau of Labor Statistics Citation2021). Even though these are US-based injury cost values, and therefore, may not be representative of other countries’ cost values, the main purpose of this study is to assess different design options based on crash cost ranking and not to determine crash costs to be used verbatim in benefit-cost analyses across different geographies. This can be accomplished regardless of the specific crash cost values adopted.
All other input values used are the same as the default input values utilized in RSAPv3.
Results
Table A1 shows the annual crash costs resulting from each design alternative analyzed. As can be seen, the design containing a TL-3, low-tension (LT) cable barrier installed in the middle of a 20-meter, hazard-free median was found to result in the lowest annual crash cost value (US$43,526) per kilometer of road, indicating that this design is the safest. Because this alternative did not contain any unshielded hazard and the barrier used was flexible and located farther away from the roadway edge, crash costs significantly decreased due to combined lower crash frequency and severity. On the other side of the spectrum, the design alternative containing a 10-meter, hazard-populated median proved to be the most unsafe option, resulting in the highest annual crash cost value (US$1,538,800) per kilometer of road.
Design options with WB guardrails were found to be less safe than those with cable barriers. The alternative containing a concrete barrier installation was found to be only safer than the design options containing unshielded medians, except when the median was 20 meters wide and hazard-free.
The right-most column in Table A1 indicates the crash cost reduction associated with the implementation of a given design alternative versus another. For example, the crash cost reduction associated with the installation of a TL-3, LT cable barrier in the middle of a 20-meter, hazard-free median (i.e., alternative 1) versus having no cable barrier in such a median (i.e., alternative 6) is estimated to be US$263,421. These pairwise comparisons were made between alternatives that differed from each other with respect to one single design feature. For example, the only difference between alternatives 1 and 6 is barrier presence/absence. Hence, the increase in crash cost of US$263,421 can be attributed to cable barrier removal. Similarly, the only difference between alternatives 6 and 13 or 12 and 14 is median width. Thus, “6 − 13 = − 895,409” and “12 − 14 = − 535,903” (as shown in Table A1) indicate the magnitude of crash cost changes when median widths of hazard-free (6-13) and hazard-populated (12-14) medians are changed from 10 to 20 meters. Alternatively, the only difference between alternatives 6 and 12, 7 and 8, 9 and 10, or 13 and 14 is hazard presence/absence. Thus, “6 − 12 = − 695,950”, “7 − 8 = − 90,489”, “9 − 10 = − 24,052”, and “13 − 14 = − 336,444” indicate how crash costs change based on whether alternatives with 20-m medians (6 − 12) containing TL-3 WB guardrails (7 − 8) or 10-m medians (13 − 14) containing TL-3 WB guardrails (9 − 10) have median hazards or not. However, crash cost change values shown in Table A1 also show the impact of other features such as barrier type (4 − 8 = − 324,680), barrier presence (1 − 6 = − 263,421), and barrier location (1 − 2 = − 55,579).
Discussion
The findings from this study provide evidence that road median design alternatives often installed in real-world situations (as shown in ) may not necessarily be the safest. That is:
shows a relatively wide, hazard-free median. Crash costs shown in Table A1 indicate that this design option is not as safe as the option with a cable barrier installed in the middle of a wide median. However, whether installing TL-3, LT cable barriers in such medians is cost-effective or not is something that should be investigated in light of barrier installation, maintenance, and repair costs. Nevertheless, it can be ascertained that in order for one to prefer the adoption of the 20-meter, hazard-free median alternative (sixth safest design option) over the alternative containing a cable barrier installed in the middle of a wide median (safest design option), increased crash costs (i.e., US$263,421) would have to be more than compensated by lower project costs (i.e., due to no barrier related costs). The increase in crash cost would obviously change as road or traffic parameters change. For example, differences in crash costs between alternatives 1 and 6 would be halved if AADT dropped to 70,000. This change is relevant in light of the fact that project costs would remain the same.
shows a design option with a cable barrier installed only on one side of the median. This option was limited to the installation of high-tension (HT) cable barriers because deflection distances associated with LT cable barriers may be larger than the median shoulder width (AASHTO Citation2011). As can be seen from Table A1, this design alternative was found to be safer than those containing unshielded medians, WB guardrails, and concrete barriers. However, crash frequency involving vehicles traveling on the side with the narrower barrier offset significantly increases as the barrier is moved from the middle of the median (i.e., alternative 1) to the edge of the shoulder (i.e., alternative 2). This increase was not fully offset by the decrease in crash frequency involving vehicles traveling on the side with the wider barrier offset, considering that i) encroachment distance distribution is not linear, and ii) a small percentage of the vehicles that hit the barrier installed on the shoulder edge of the opposite traveling direction would end up penetrating the barrier regardless of where it was installed and cause CMCs.
In scenarios where medians contained hazards, cable barriers were installed only on roads with 20-meter medians due to limited distance to accommodate barrier deflection in the case of 10-meter medians. In these hazard-populated medians, the presence of rigid hazards increased the number of fixed-object collisions involving vehicles that were not contained by the barrier. This is relevant since research has found that barrier non-containment rates may be too high and that non-containment events tend to result in higher fatality risk (Albuquerque & Awadalla Citation2020). In fact, RSAPv3 indicated that there would be a small percentage of errant trucks that would penetrate even both WB guardrails, each installed on a side of the median. Because CMCs involving trucks are likely to be very severe events, these events significantly contributed to higher crash costs. In addition, previous research has also shown that crashes involving obstacles such as trees and poles tend to result in higher fatality risk as compared to crashes involving non-rigid barriers (Albuquerque and Awadalla Citation2020). This implies that having trees or light poles in the median space may have negative safety implications even when these hazards are shielded.
shows a design option with a WB guardrail installed on both sides of a 10-meter, hazard-populated median. This design option was only safer than the design alternatives containing i) 20-meter, hazard-populated medians, ii) 10-meter, unshielded medians, and iii) concrete barriers. This may be explained by the following: i) guardrails are more rigid than cable barriers, producing higher-severity crashes, and ii) the presence of long guardrails in close proximity to the road edge tends to significantly increase crash costs, as the benefit of lower crash severity produced by guardrail crashes (i.e., in relation to point-hazard crashes) tends to be outweighed by the increased crash frequency resulting from the guardrail being not only longer than the shielded hazard, but also being installed in closer proximity to the road edge than the shielded hazard (Albuquerque et al. Citation2016).
Finally, the design option containing a concrete barrier separating opposing traffic was also found to be only safer than the design options containing i) 20-meter, hazard-populated medians and ii) 10-meter, unshielded medians. It is important to note that this design option may be selected due to reasons that are not safety related, such as limited right-of-way availability and lower maintenance/repair demand associated with more rigid barriers. The latter reason is especially relevant in urban/suburban freeways where high traffic volumes may warrant barriers that may not require immediate post-collision repair.
In the case of cost-conscious agencies, not only crash costs but also project (i.e., construction, maintenance, and repair) costs should be considered in order to determine the most cost-effective design alternative. In the current study, alternatives were ranked based solely on a crash-cost basis. Nevertheless, the likelihood that the alternatives shown in (as well as others often adopted in real-world applications) are also not the most cost-effective alternatives may still be reasoned. That is:
Because the design option shown in involves barrier-related costs that are likely to be similar (i.e., though slightly higher for HT than for LT cable barriers) to those associated with the safest design alternative, it is unlikely to be the most cost-effective option considering it produced an annualized crash cost that is higher than that of the safest alternative.
The same reasoning applies to the design alternative shown in as well as other similar scenarios containing WB guardrails instead of cable barriers. That is, i) WB guardrails present higher installation costs than cable barriers do, and ii) alternatives containing WB guardrails produced higher crash costs than those containing cable barriers, regardless of median width and hazard presence patterns. In addition, the alternative shown in involves not only barrier-related costs, but also installation and operation costs associated with light poles (not to mention tree planting and care costs).
Finally, the alternative involving the installation of a concrete barrier along extended lengths of roadway may be prohibitively expensive. On the other hand, while concrete barriers are often associated with lower maintenance and repair costs as compared to other barrier types, these costs may not be low enough to offset concrete barriers’ higher installation costs, especially if the expected crash frequency is not high enough. Thus, in rural freeway scenarios (where moderate to low traffic volumes prevail), this design option would likely not be a cost-effective alternative.
In sum, this study indicates that many of the median design alternatives installed in real-world scenarios may be neither the safest nor the most cost-effective. This conclusion makes this study’s findings relevant and timely, as designers and policy/decision makers should always seek not only to maximize safety, but also to optimize the allocation of limited public funds.
Limitations
This study does not equip researchers and practitioners with crash cost values they can use verbatim in benefit-cost analyses across different geographies, though this could be considered reasonable for US projects given the crash costs used in this study and the encroachment rates embedded in RSAPv3.
Supplemental Material
Download Zip (1 MB)Acknowledgments
The authors would like to thank the Abu Dhabi Department of Transport (DOT) for providing traffic-related information.
Disclosure statement
None.
Additional information
Funding
Related Research Data
References
- AASHTO 1977. Guide for selecting, locating, and designing traffic barriers. Washington (DC): American Association of State Highway and Transportation Officials.
- AASHTO 2011. Roadside design guide. 4th ed. Washington (DC): American Association of State Highway and Transportation Officials.
- AASHTO 2018. A policy on geometric design of highways and streets. 7th ed. Washington (DC): American Association of State Highway and Transportation Officials.
- Albuquerque FDB, Awadalla DM. 2020. Roadside fixed-object collisions, barrier performance, and fatal injuries in single-vehicle, run-off-road crashes. Safety. 6(2):27. doi:https://doi.org/10.3390/safety6020027
- Albuquerque FDB, Sicking DL, Faller RK, Lechtenberg KA. 2011. Evaluating the Cost-Effectiveness of Roadside Culvert Treatments. J Transp Eng. 137(12):918–925. doi:https://doi.org/10.1061/(ASCE)TE.1943-5436.0000266
- Albuquerque FDB, Sicking DL, Stolle C. 2016. Optimal guardrail runout lengths for freeways. J Transp Saf Secur. 9(4):403–418.
- Cooper PJ. 1981. Analysis of roadside encroachment data from five provinces and its application to an off-road vehicle trajectory model. Vancouver, Canada: British Columbia Research Council.
- Graham JL, Hardwood DW, Richard KR, O’Laughlin MK, Donnell ET, Brennan SN. 2014. Median cross-section design for rural divided highways. Washington (DC): National Cooperative Highway Research Program.
- Hutchinson JW. 1962. The significance and nature of vehicle encroachment on medians of divided highways. Chicago (IL): University of Illinois.
- Mak KK, Sicking DL. 2003. Roadside safety analysis program (RSAP): Engineer’s manual. Washington (DC): National Cooperative Highway Research Program.
- Mak KK, Sicking DL, Albuquerque FDB. 2010. Identification of Vehicular Impact Conditions Associated with Serious Ran-off-Road Crashes. Washington DC: National Cooperative Highway Research Program.
- Miaou S-P, Bligh RP, Lord D. 2005. Developing guidelines for median barrier installation: benefit–cost analysis with texas data. Transp Res Rec. 1904(1):2–19. doi:https://doi.org/10.1177/0361198105190400101
- Moran MJ. 2016. Guidance on treatment of the economic value of a statistical life (VSL) in US department of transportation analyses - 2016 adjustment.
- National Highway Traffic Safety Administration 2018. Fatal crashes by crash type and relation to roadway. National Highway Traffic Safety Administration [Internet]. Washington DC: United States Department of Transportation [accessed 2020 Nov 23]. https://www-fars.nhtsa.dot.gov/Crashes/CrashesLocation.aspx.
- Ray MH, Carrigan CE, Plaxico C. 2012a. Roadside safety analysis program. [place unknown]: RoadSafe, LLC.
- Ray MH, Carrigan CE, Plaxico C, Miaou S-P, Johnson TO. 2012b. NCHRP 22-27: roadside safety analysis program (RSAP) update. Washington (DC): National Cooperative Highway Research Program.
- Roque C, Moura F, Cardoso J. 2015. Detecting unforgiving roadside contributors through the severity analysis of ran-off-road crashes. Accid Anal Prev. 80:262–273. doi:https://doi.org/10.1016/j.aap.2015.02.012
- Shawky M, Hassan HM, Garib A, Al-Harthei HA. 2016. Examining the factors affecting the severity of run-off-road crashes in Abu Dhabi. Can J Civ Eng. 43(2):132–138. doi:https://doi.org/10.1139/cjce-2014-0393
- Szabat J. 2009. Guidance on treatment of the economic value of a statistical life in US department of transportation analyses - 2009 annual revision.
- U.S. Bureau of Labor Statistics. 2021. CPI for All Urban Consumers (CPI-U). US Bureau of Labor Statistics [Internet]. [accessed 2021 Jan 11]. https://data.bls.gov/timeseries/CUUR0000SA0&output_view=pct_1mth.