
Abstract
Objective
Crashes between cars and cyclists at urban intersections are common, and their consequences are often severe. Typical causes for this type of crashes included the excessive speed of the cyclist as well as car drivers failing to see the cyclist. Measures that decrease the cyclists’ speed may lead to safer car-cyclist interactions. This study aimed to investigate the extent to which cyclists may approach intersections at a lower speed when nudged to do so.
Methods
Visual flat-stripe nudges were placed on bicycle lanes in the proximity of uncontrolled intersections (with a history of car-cyclist crashes) in two locations in Gothenburg, Sweden. This specific nudge was the one obtaining the best results from a previous study that tested different nudges in controlled experiments. Video data from the intersections were recorded with a site-based video recording system both before (baseline), and after (treatment), the nudge was installed. The video data was processed to extract trajectory and speed for cyclists. The baseline and treatment periods were equivalent in terms of day of the week, light, and weather conditions. Furthermore, two treatment periods were recorded to capture the effect of the nudge over time in one of the locations.
Results
Leisure cyclists showed lower speeds in treatment than in baseline for both locations. Commuters were less affected by the nudge than leisure cyclists. This study shows that visual nudges to decrease cyclist speed at intersections are hard to evaluate in the wild because of the many confounders. We also found that the effect of visual nudges may be smaller than the effect of environmental factors such as wind and demographics, making their evaluation even harder.
Conclusions
The observed effect of speed might not be very high, but the advantage both in terms of cyclist acceptance and monetary cost makes an investment in the measure very low risk. This study informs policymakers and road authorities that want to promote countermeasures to intersection crashes and improve the safety of cyclists at urban intersections.
Introduction
Crashes between cars and cyclists at urban intersections are common and their consequences are often severe (European Commission Citation2018). In the Europe Union only 2% of all passenger kilometers traveled relate to bicycles, but cyclists still make up 8% of road fatalities (European Commission Citation2018).
The interaction between cyclists and motorized vehicle is crucial to cycling safety; a Swedish study based on insurance claims found that eight out of ten car-to-bicycle crashes occur at intersections, where the car driver fails to see the cyclist in the majority of the cases (Isaksson-Hellman and Werneke Citation2017). (The supplementary Appendix A summarizes results from a literature review of relevant contributing factors that influence critical interactions between cyclists and cars at intersections.) Measures that decrease the cyclists’ speed may lead to safer driver-cyclist interactions, for instance, by providing more time to the car driver and the cyclist to spot and become aware of each other.
In traffic, infrastructure measures such as nudging have recently become a popular solution to alter human behavior on a subconscious level without forbidding or ruling out other choices (Thaler and Sunstein Citation2008). However, few attempts have been performed to investigate the effect of nudging on cyclist’s behavior in the wild. The MeBeSafe project (Twisk and De Hair-Buijssen Citation2017) aimed at reducing the number of crashes through implementing nudging measures that influence road user attention and speed. When it comes to cyclists, one of the concerns were intersections, where a cyclist speed that is too high may become a hazard. Numerous studies have investigated possible factors that affect cyclist speeds (for review, see Kassim, Tayyeb, and Al-Falahi (Citation2020)). For instance, commuter cyclists have been found to be more sensitive to factors related to travel time than, for example, infrastructure factors (Stinson and Bhat Citation2005). Regardless of the purpose of the bicycle trip, unpleasant weather conditions, such as windy conditions, have been presented to challenge bicyclists and demand more effort when cycling, thus influencing speed behavior (Fioreze et al. Citation2019).
The aim of this study, which was part of the MeBeSafe project, was to investigate the extent to which cyclists may approach intersections more safely when a novel type of visual nudge is used to decrease their speed. By combining site-based naturalistic data with other data, we investigated the environmental factors that may confound the effect of a visual nudge in the wild. We also hypothesized that the different motivations to cycle (commute or leisure) may lead to different responses to the nudge. Interviews with passing cyclists have been used to explain the results from the analysis.
Method
Locations
Several types of nudges have been tested in a previous pilot study. The study showed that while many of the tested nudges had similar effects in terms of speed reduction, transverse stripes had the added benefit of not distracting the rider focus from the surrounding traffic situation (Wallgren and Bergh-Alvergren Citation2019). Consequently, the transverse nudge, shown in supplementary Figure B1, was selected for this study that assessed its effect in a field test. To investigate the effect of this visual nudge, two locations in the city of Gothenburg, Sweden, were selected (Nobelplatsen and Götaälvbron), see supplementary Figure B2. The requirements for choosing the locations were: a) the location had cyclist lanes that led to an uncontrolled intersection between cyclists and vehicles, and b) crashes and/or incidents must have happened at the intersection during the last 5 years according to the Swedish crash database STRADA.
The transverse nudge has a gap decrement of 7.25% per gap from an initial gap of two meters, leading to 17 gaps and a total decrement of 70% over 19.9 meters. The nudge was installed on the bicycle lane by using a white road tape which did not produce any vibrations or haptic feedback for the cyclist.
Camera-based system
Video data from the locations were recorded with a site-based, video-recording system provided by Viscando (Viscando Citation2020), which uses a pair of cameras producing a stereo image that is processed by the device resulting in trajectory and speed recordings for individual road users. The processing involves machine learning for object classification and extended Kalman filtering for tracking (Viscando Citation2020). The trajectory data (see ) are transferred wirelessly to Viscando.
Figure 1. An example of the cyclist tracks as processed from the Viscando system for location 1 (left) and location 2 (right).
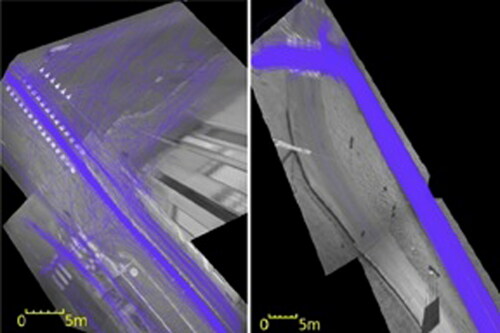
This wireless transfer makes the units GDPR compliant as the trajectories are generated in real-time, and the video frames are neither sent nor stored.
Data
The data provided from the video-recording system included the following attributes for every road user that entered the camera field of view: timestamp, type of road user (cyclist, pedestrian, car, or truck), position, and speed (Viscando Citation2020). The data was filtered only to include cyclists who traveled on the lane were the nudge was installed. The trajectories considered were straight (no turning) and at least 25 m long.
Viscando data was also labeled according to cyclist type (commuter/leisure), and wind (direction and speed) to control for possible confounders. Cyclists were crudely divided into commuters and leisure cyclists, depending on their time of travel. A single wind component was derived from wind direction and speed. The wind component was categorized in neutral (between −1 and 1 km/h), headwind (>1 km/h), and tailwind (< −1 km/h).
Experiment design
The experiment was designed to compare the cyclists’ speed before (baseline) and after (treatment) the nudge was installed. The baseline and treatment periods were equivalent in terms of the duration of the data collection and seasons. The data were collected for four consecutive days from Wednesday to Saturday to capture weekdays and weekends, except for the baseline condition in location 1, which was only three days (Thursday to Saturday) due to a technical problem. Furthermore, in location 1 a second treatment period was recorded after the nudge had been present for 1.5 months to to capture the effect of the nudge over time, a time period deemed sufficient to reach a steady-state cyclist behavior.
Data analysis
The average cyclist speed was analyzed for three positions along with the nudge: at the beginning, middle (nine meters from the beginning), and end of the nudge. Furthermore, the percentages of cyclists with speeds greater than 20, 25, and 30 km/h at the end of the nudge was computed. This measure helped us assessing the individual cyclist behavior to control for different populations across locations and conditions. Another measure about the individual cyclist behavior was also computed, with details and results given in the supplementary Appendix C. These types of measures have been previously used for the evaluation of traffic-calming techniques for vehicles (Charlton Citation2003; Hallmark et al. Citation2007). Different factors that may affect the cyclist speed at the end of the nudge (namely, cyclist type, and wind) were further investigated, since decreasing the speed while approaching the intersections may play a role in reducing the conflicts with vehicles.
The statistical analysis of the cyclist speed at the different positions used a two-way analysis of variance (ANOVA). To find out which groups were statistically significantly different from one another, the Tukey’s Honestly Significant Difference (Tukey’s HSD) post-hoc test for multiple comparisons was performed. The threshold for statistical significance for the tests was set to α = 0.05. A Chi-square test was performed for comparisons among two proportions (α = 0.05). The statistical analyses were performed on the whole dataset and on sub-datasets that had been sanitized according to different potential confounding factors. The rationale for this analysis was both 1) to tell apart the effect of the nudge from factors that are known to affect cyclist speed and 2) to compare the effect size of the speed reduction from the nudge with that of these factors.
Interviews
Short interviews with passing bicyclists were conducted at both test locations on the first day of the treatment. The interviewers were standing just out of sight of the location of the installed measure, to assure that their presence did not affect the behavior of the cyclists. The bicyclists were approached and asked if they could spare a minute to talk about cycling. They were then asked if they had seen anything special on the cyclist lane; if not, they were shown a picture of the site of the nudge. They then were asked what they thought was the purpose of the markings, if they thought it had any effect on their behavior, and if they would have liked to see such markings in the cyclist lanes. The nature of how we approached the bicyclists resulted in few of the fast bicyclists being interviewed.
Results
Does the nudge reduce cyclists’ speed?
The number of cyclist trajectories that satisfied the criteria explained in the Method section for baseline, treatment 1, and treatment 2 for location 1 was 740, 1151, and 995, respectively, while for location 2 was 1301 and 1292 for baseline and treatment, respectively. The speed distribution at the three positions for baseline and treatment is shown in for both locations.
Figure 2. Distribution of cyclist speed at different positions and conditions for location 1 (top) and location 2 (bottom). The numbers on the top report the sample size for each boxplot.
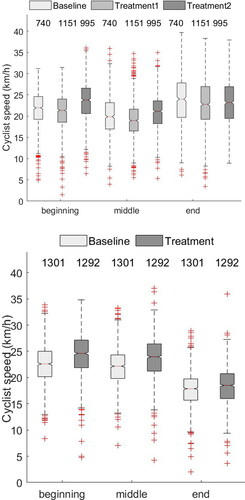
The main effects, condition (baseline vs. treatment) and position (beginning, middle, and end of the nudge), and their interaction were statistically significant for both locations. The effect of the nudge on average speed at the end of nudge was opposite across locations and treatment repetition, though. The average and standard deviation (SD) of the speed at the end of the nudge for location 1 was 23.4 km/h (SD = 5.9), 22.7 km/h (SD = 5.7) and 23.1 km/h (SD = 5.2) in baseline, treatment 1 and treatment 2, respectively, while for location 2 was 17.7 km/h (SD = 3.2) and 18.4 km/h (SD = 3.5) (see supplementary Table B1). In fact, while the nudge decreased cyclist speed at location 1, it did increase cyclist speed at location 2. An overview of the ANOVA, including the main effects and interactions for each location, can be found in .
Table 1. Summary of ANOVA results for location 1 and location 2 for factors condition and position.
For location 1, the post-hoc comparisons showed that the speed in baseline was higher than in treatment 1 and lower than in treatment 2, both these results were statistically significant (p < .001). The results of the post-hoc comparison are detailed in the supplementary Appendix B.
In the rest of the results, we investigated the different factors that may affect the speeds at the end of the nudge (see supplementary Figure B3) and may help explain some of the contradictory results across locations.
Are leisure cyclists nudged to reduce speed more than commuters?
Leisure cyclists showed lower speeds in treatment than in baseline for both locations. Commuters were less affected by the nudge than leisure cyclists, see supplementary Figure B4 (see supplementary Table B2). The main effects, condition and cyclist type, reached the threshold for statistical significance in location 1, F(2, 1472) = 3.34, p = 0.03, ηp2 = 0.005 and F(1, 1472) = 26.51, p < .001, ηp2 = 0.018, respectively, while their interaction was not statistically significant, F(2, 1472) = 0.46, p = 0.63, ηp2 = 0.001. Post-hoc comparisons showed that at location 1, at the end of the nudge speed was statistically significantly lower in treatment 1 compared to baseline (p = 0.03), and the effect was not statistically significant between treatment 2 and baseline (p = 0.19).
At location 2, the main effect of condition was not statistically significant F(1,1296) = 0.01, p = 0.98, ηp2 < .001 while cyclist type and the interaction between condition and cyclist type were statistically significant, F(1,1296) = 16.71, p < .001, ηp2 = 0.013 and F(1,1296) = 26.34, p < .001, ηp2 = 0.020, respectively. At this location, the post-hoc comparisons showed that leisure cyclists had lower speeds in treatment than in baseline, and this result was statistically significant (p = 0.02). This effect was opposite for the commuters, again, the result was statistically significant (p < .001).
Can wind reconcile the opposite effect of the nudge across locations?
When taking into consideration the wind, the contradicting results across locations were not evident or statistically significant any longer, see supplementary Figure B5. (Details are shown in Table B3.) The main effect, wind, led to statistically significant results, both for location 1, F(2,2877) = 3.66, p = 0.03 and location 2, F(2,2587) = 16.42, p < .001, see , confirming that tailwind increases speed while headwind reduces it.
Table 2. Summary of ANOVA results for location 1 and location 2 for factors condition and wind (wind threshold = 1 km/h).
Specifically, post-hoc comparisons showed that the speeds in treatment in neutral wind were statistically significantly higher than in headwind, p < .001, for location 2. Likewise, in treatment, the speeds in tailwind were higher than in headwind, and this result was statistically significant (p < .001) for location 2.
Is the nudge more effective in reducing speed for faster cyclists?
The percent of cyclists that arrived at the end of the nudge with speeds greater than a threshold was, in general, lower in treatment than in baseline for all speed thresholds for location 1 (see Table B4). The largest decrease in the percentage of cyclists was observed for the speeds greater than 25 km/h, almost 6% in treatment 1 compared to baseline, which was statistically significant χ2(1) = 6.44, p = 0.01. The percentage of cyclists in treatment 2 was almost 4% less than in baseline, but this was not statistically significant, χ2(1) = 2.32, p = 0.13. In contrast, at location 2 the percentage of cyclists riding over 20 km/h was higher in treatment than in baseline, and this result was statistically significant χ2(1) = 33.46, p < .001. To determine whether the nudge was more effective on faster cyclists, we investigated the proportions of the cyclists over the different speed thresholds by dividing the data by wind, see supplementary Table B5 and supplementary Table B6. (The results in the supplementary Appendix B show that once the wind was considered, the nudge did not slow down faster bikers more than slower ones.)
Interviews
In total, 54 interviews were performed, 31 and 23 at location 1 and location 2, respectively. More females than males stopped for interviews, 30 and 24, respectively. We attribute this to more men choosing to leave the cycle lane and ride on the road before the place we stopped the cyclists for interviews, as well as more men than women belonging to the fast cycling group. The majority of the participants 44 (from 54) noted the nudge, while ten had no recollection of passing the nudge, even after being shown a picture of it. More than 70% (N = 39) of the participants interpreted the nudge as something that intended to slow down bicyclists and/or warn for a dangerous intersection. Half of the participants thought that the nudge affected their behavior in that they slowed down more and were more careful than usual. Interestingly, almost 90% (48 of 54) of participants said that they thought this type of markings would be a good idea in dangerous intersections, often stating that everything that makes the traffic situation safer is good. The few participants who did not want to see these markings in bicycle lanes stated, without exception, that they did not understand their purpose and that they, therefore, did not see the reason for installing them.
Discussion
In this paper, we investigated how a visual nudge affects the cyclist speed. This was done both quantitively, by collecting site-based video data, and qualitatively, by conducting interviews with passing cyclists. One of the main contributions of this paper is showing how these video data can be analyzed while keeping into account different factors that influence cyclist speed in the wild.
The effect of the nudge on the average speed (measured at the end of nudge) was not consistent across locations and treatment repetitions until the effect of the wind was considered. The speed at baseline was higher than at treatment 1 and lower than at treatment 2, for location 1, while location 2, the speeds at treatment were higher than at the baseline. This speed variation (that wind alone seemed to explain) may also, in part, reflect the differences between the location conditions and, possibly, other factors that were not recorded in this study. In fact, other factors than the nudge may have large effects on cyclists’ speed; for instance, crossing pedestrians (Davies et al. Citation2003), visibility conditions (obstructed view), slope, the width of the cycle path, and road standards and regulations (Kassim, Tayyeb, and Al-Falahi Citation2020; Räsänen, Koivisto, and Summala Citation1999; Vansteenkiste et al. Citation2013; Warner et al. Citation2018). Different speed patterns were observed in the locations independent of the nudge. In location 1, lower speeds were observed in the middle than at the beginning and end of the nudge. The proximity to a zebra-crossing with pedestrians may explain these lower speeds. Indeed, the pedestrians needed to cross both the zebra-crossing and the cyclist path to reach the pedestrian lane. In location 1, there were also on-street parking to the left, and shops and restaurants to the right of the bicycle lane that may help explain this result. In fact, it has been reported in Davies et al. (Citation2003) that the cyclists’ speed decreased with an increase in the level of pedestrian flow. Furthermore, the cyclist view of the intersection from the right was obstructed by a building approximately until the middle of the nudge, which may have made the cyclists first slow down and then accelerate to the end of the nudge to pass the intersection. On the other hand, in location 2, where there was an unobstructed view, the cyclists slowed down from the beginning to the end of the nudge. In fact, several studies have identified that cyclists change their behavior in response to sight distance and the available field of view (Kassim, Tayyeb, and Al-Falahi Citation2020; Prati et al. Citation2018; Räsänen, Koivisto, and Summala Citation1999), the type of intersection, the width of the cyclist path and its gradient (Kassim, Tayyeb, and Al-Falahi Citation2020). In conclusion, cyclist infrastructure was different between the locations and it is crucial to keep in mind how the infrastructure may influence the behavior of cyclists (including their speed) to properly understand the effect of a nudge at that specific location.
Commuters were less affected by the nudge than leisure cyclists at both locations. Leisure cyclists showed lower speeds in treatment than in baseline for both locations. These results may be explained by the different motivations for cycling that drive commuters and leisure cyclists. Commuters may be under a tight schedule or pressure to arrive on time (Stinson and Bhat Citation2005), leaving them less affected by the nudge.
Winds can often be considered the most challenging weather aspect of cycling, especially in a city close to the sea, such as Göteborg. In this study, when taking into consideration the wind, the apparently contradicting results across locations were not evident any longer. The main effect of the wind was, of course, significant, confirming that tailwind increases speed while headwind reduces it. These two results combined suggest that the effect of the nudge was smaller than the wind effect. Further, future evaluations of such speed nudges should not neglect wind direction.
A larger proportion of cyclists decreased speed from the beginning to the end of the nudge, in treatment than in baseline (see the supplementary Appendix C). Furthermore, the percent of cyclists traveling over 25 km/h at the end of the nudge was significantly lower in treatment 1 than in baseline for location 1. However, once wind was considered, the nudge did not slow down faster bikers more than slower ones. In location 2, it was observed that there were few cyclists traveling over 25 km/h (14 in baseline and 26 in treatment) and the average baseline speeds at the end of the nudge were 17.7 km/h, in comparison to 23.4 km/h for location 1. In previous studies on vehicle traffic-calming treatments, Hallmark et al. (Citation2007) have shown that the true effectiveness of the treatments was their ability to significantly reduce the number of vehicles traveling over the speed limit in comparison to the modest decrease in average speeds. Currently, there is no speed limit for cyclists, but a study by Schepers et al. (Citation2014) showed an increased degree of cyclists injury severity when comparing speeds above 25 km/h with speeds in the range 15-25 km/h.
In our study, the interviews with the cyclist confirmed that the cyclists noticed the nudge and correctly interpreted it, which supports the causality claimed by the results from video data. The respondents to the short interviews were, to a large extent, positive to the solution tested. It should be noted that stopping people on the cyclist lane to answer questions tends to favor people who are already biking at a moderate pace. This means that acceptance may have been lower for faster cyclists. At the same time, the results from the speed measurements indicated that the fast bikers were not affected more by the installed measure. These results, combined with the fact that most of the interviewees had noticed the markings in the lane, point toward the conclusion that the measure did not work as a nudge at all, but rather a sign that consciously was interpreted and acted upon (or ignored).
In sum, the tested nudge, transverse stripes over the bike lane, although demonstratively working to slow down cyclists in experimental studies had very small effect in real conditions.
Ethics statement
This study was performed in accordance with the ethical guidelines for naturalistic data collection in place in Sweden in 2019.
Supplemental Material
Download MS Word (1.9 MB)Data availability statement
The data in this study are not publicly available.
Disclosure statement
The authors declare that they have no conflict of interests or personal relationships that could have appeared to influence the work reported in this paper.
Additional information
Funding
References
- Charlton SG. 2003. Restricting intersection visibility to reduce approach speeds. Accid Anal Prev. 35(5):817–823. doi:10.1016/S0001-4575(02)00052-0
- Davies D, Chinn L, Buckle G, Reid S. 2003. Cycling in vehicle restricted areas. Wokingham; Available at: http://www.trl.co.uk/online_store/reports_publications/trl_reports/cat_traffic_engineering/report_cycling_in_vehicle_restricted_areas.htm.
- European Commission 2018. 2017 road safety statistics: What is behind the figures? Brussels.
- Fioreze T, Thomas T, Huang B, van Berkum E. 2019. How employees view smart cycling to work: A regional survey in the Netherlands. Travel Behav. Soc. 16(October 2017):224–234. doi:10.1016/j.tbs.2018.04.002
- Hallmark SL, Peterson E, Fitzsimmons E, Hawkins N, Resler J, Welch T. 2007. Evaluation of gateway and low-cost traffic-calming treatments for major routes in small, rural communities. 160.
- Isaksson-Hellman I, Werneke J. 2017. Detailed description of bicycle and passenger car collisions based on insurance claims. Saf Sci. 92:330–337. doi:10.1016/j.ssci.2016.02.008
- Kassim A, Tayyeb H, Al-Falahi M. 2020. Critical review of cyclist speed measuring techniques. J Traffic Transp Eng. 7(1):98–110. Available at: doi:10.1016/j.jtte.2019.09.001
- Prati G, Puchades VM, De Angelis M, Fraboni F, Pietrantoni L. 2018. Factors contributing to bicycle–motorised vehicle collisions: A systematic literature review. Transp Rev. 38(2):184–208. Available at: doi:10.1080/01441647.2017.1314391
- Räsänen M, Koivisto I, Summala H. 1999. Car driver and bicyclist behavior at bicycle crossings under different priority regulations. J Safety Res. 30(1):67–77. doi:10.1016/S0022-4375(98)00062-0
- Schepers JP, Fishman E, Den Hertog P, Wolt KK, Schwab AL. 2014. The safety of electrically assisted bicycles compared to classic bicycles. Accid Anal Prev. 73:174–180. Available at: doi:10.1016/j.aap.2014.09.010.
- Stinson MA, Bhat CR. 2005. A comparison of the route preferences of experienced and inexperienced bicycle commuters. In: Transportation Research Board 84th Annual Meeting.
- Thaler R, Sunstein H. 2008. Nudge: Improving decisions about health, wealth, and happiness. New Haven: Yale University Press.
- Twisk D, De Hair-Buijssen S. 2017. MeBeSafe: Developing and testing infrastructure and car based nudges to improve cyclist safety. In: 6th Annual International Cycling Safety Conference.; p. 4–7.
- Vansteenkiste P, Cardon G, D’Hondt E, Philippaerts R, Lenoir M. 2013. The visual control of bicycle steering: The effects of speed and path width. Accid Anal Prev. 51:222–227. doi:http://dx.doi.org/10.1016/j.aap.2012.11.025
- Viscando 2020. Viscando. https://www.viscando.com/en/. Accessed December 3, 2020.
- Wallgren P, Bergh-Alvergren V. 2019. Haptic nudges to influence cyclist behaviour – an experimental study. In: 8th International Cycling Safety Conference. Brisbane, Australia.
- Warner HW, Niska A, Forward S, Björklund GM, Eriksson J, Kircher K, Patten C, Gustafsson S, Nygårdhs S. 2018. En modell för säker cykling. Available at: www.vti.se/publikationer.