
Introduction
Traffic accident data analysis is the basis for developing countermeasures to mitigate injuries and fatalities. There are already several examples of data analysis studies that have been formally used in the real-world to evaluate risk factors or develop more advanced protective measures. For example, an injury risk prediction model based on logistic regression algorithm has been applied to interpret the relationships between crash casualties and attributes (Malliaris et al. Citation1997).
Further, pre-crash related studies are also significant as they provide the possibility of avoiding collisions or minimizing damage of collisions. By analyzing pre-crash data, it is worth constructing a collision-type prediction model that can be applied to autonomous driving systems (ADS) or advanced driver assistance systems (ADAS). One particular difficulty is that the myriad factors of the traffic environment, driver, and vehicle information are interrelated in an ever-changing environment, resulting in changing crash scenarios. It is important to prioritize the development of systems by considering which crash scenarios are caused by the above accident factors and how much the risk of injury is reduced, and to determine the crash scenarios to be used in the performance evaluation tests of ADS and ADAS. Furthermore, if we can predict possible collision types and scenarios based on information on the surrounding traffic environment, driver, and vehicle before the accident and also predict the risk of injury in such cases, it is expected to contribute to the control algorithms for ADS and ADAS. However, few related studies have been conducted to date.
Therefore, this study aimed to construct a collision-type prediction model using a non-linear machine learning method, light gradient boosting machine (LGBM) (Meng Citation2017), based on pre-crash traffic accident data categorized into physical environment-, vehicle-, and driver-related. Moreover, a Bayesian network was used to elucidate the causality and correlation between factors, which may have important implications for the cause of accident and determination of liability.
Methods
Data and pre-processing
The crashworthiness data system of the national automotive sampling system (NASS-CDS) and crash investigation sampling system (CISS) data provided by the national highway traffic safety administration (NHTSA Citationn.d.) for the years between 2001 and 2020 were selected, which included a total of over 140,000 cases. For accident analysis in this study, only cases involving only two vehicles were focused, while some exceptional conditions were excluded. Hence the following inclusion criteria were used in this study. First, cases involving only two vehicles were included; then, only cases of sedans, sports utility vehicles (SUVs), vans, and pickup trucks were included; furthermore, drivers over 15 years of age were included; finally, only cases with recorded driver distractions were included. Thus, the final number included was 6,378 after the deficiency values were eliminated.
The type of collision, as the variable to be predicted, was classified into five categories: Rear End, Head On/Side Swipe, Turn/Across from Opposite, Turn/Across from the Same Side and Straight Path, which were mainly from NHTSA (n.d.).
Explanatory crash variables were extracted from the dataset; furthermore, these variables were divided into physical environment-related, vehicle-related, and driver-related variables. For the physical environment-related variables, the lanes (LANES) and traffic flows (TRAFFLOW), whether related to the intersection (RELTOINTER), speed limit (SPLIMIT), roadway alignment (ALIGNMNT) and light conditions (LIGHTCOND) were chosen. For vehicle-related variables, pre-crash movements (PREMOVE), maneuver (MANEUVER), relative force directions (DOF) and pre-crash locations (PRELOC) were chosen; and to determine the obstacles to collision, a new variable “OBSTACLE” was defined according to the relative head angle. For driver-related variables, driver age (AGE) and driver distraction information (DRIVDIST) were extracted.
Additionally, the distribution of the collision-type was imbalanced; type “Turn/Across from the Same Side” only accounted for approximately 5% of the total data, while type “Turn/Across from Opposite” accounted for over 40%. To avoid extremely imbalanced performance, resampling was conducted with random oversampling (ROS) and the synthetic minority oversampling technique (SMOTE). Considering that the amount of data was only 6378, oversampling was also a method of data augmentation.
Construction of prediction model
In this study, 5-fold cross-validation was used to search for the best hyper-parameters of LGBM. First, the data were divided into two parts: 80% for training and 20% for test. For the training part, 80% was divided into training data, and the remaining 20% into validation data. Finally, the Hyper-Opt and grid search algorithms were used to train the model, while the test data were used to verify the performance. Considering that the total performance should be balanced, the weighted f1 score was used as an evaluation index.
Construction of relevance model
Bayesian networks were used to illustrate the causality and relevance of different factors. Bayesian networks, also known as a confidence networks, are an extension of the Bayesian approach and are currently one of the most effective theoretical models in the field of uncertain knowledge representation and reasoning. Bayesian networks are directed acyclic graphs (DAG) consisting of nodes representing variables and directed edges connecting these nodes. The nodes represent random variables, the directed edges between the nodes represent the interrelationships between the nodes (from the parent node to its children), and the strength of the relationships is expressed in terms of conditional probabilities, whereas those without parents are expressed in terms of prior probabilities. In this study, the data were divided into two parts:80% for training and the remaining 20% for test.
Results
Prediction model
The search for hyper-parameters was performed for four parameters: learning rate (learning_rate) varied from 0.01 to 0.3, the maximum depth (max_depth) of each estimator varied from 6 to 15, the number of estimators (n_estimators) varied from 100 to 140, and the number of leaves (num_leaves) of each estimator varied from 20 to 40. lists the highest f1 score and corresponding hyper-parameter for each resampling method. The ROS model shows an f1 score above 97.3% in cross-validation, which is the best among the three models.
Table 1. Cross-validation data result.
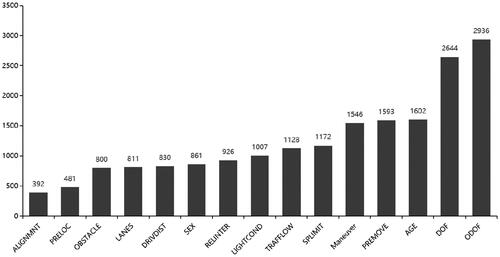
The ranking of the importance of each factor is shown in . From , it is clear that the relative force direction and pre-crash movement affect collision-type most, which is also considered to be highly related to injury risk.
Figure 1. Importance ranking of ROS model.
Relevance model
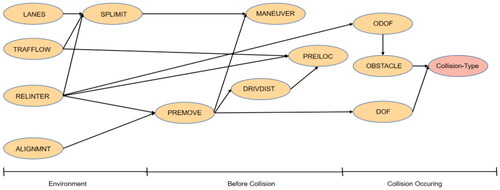
The DAG generated by the Bayesian network in shows that the collision type is highly related to “OBSTACLE” and “DOF,” which are the obstacles in the collision, and the relative direction of force. While physical environment, vehicle, and driver related factors are well divided, it is possible to identify the relevance of factors that have the potential to avoid collisions or to reproduce the process of traffic accidents.
Figure 2. Relevance DAG by Bayesian network.
Conclusion
A collision-type prediction model based on the LGBM algorithm was constructed using traffic data from the NHTSA, which had an overall performance f1 score of 97.3% on the weighted f1 score. Moreover, a relevance model based on Bayesian networks was constructed to elucidate data causality and relevance. Both of these have potential in ADAS and ADS to avoid collisions or minimize the damage of collisions.
Correction Statement
This article has been corrected with minor changes. These changes do not impact the academic content of the article.
Additional information
Funding
References
- Malliaris AC, Digges KH, DeBlois JH. 1997 Feb 24–27. Relationships between crash casualties and crash attributes. In: SAE International Congress & Exposition Paper, Detroit, MI, p. 970393.
- Meng Q. 2017. LightGBM: a highly efficient gradient boosting decision tree. Adv Neural Inf Process Syst. 30:2.
- National Highway Traffic Safety Administration. n.d. Crashworthiness data system | NHTSA. https://www.nhtsa.gov/data/crash-data-systems.