
Abstract
Objective
Drivers using level 2 automation are able to disengage with the dynamic driving task, but must still monitor the roadway and environment and be ready to takeover on short notice. However, people are still willing to engage with non-driving related tasks, and the ways in which people manage this tradeoff are expected to vary depending on the operational design domain of the system and the nature of the task. Our aim is to model driver gaze behavior in level 2 partial driving automation when the driver is engaged in an email task on a cell phone. Both congested highway driving, traffic jams, and a hazard with a silent automation failure are considered in a driving simulator study conducted in the NADS-1 high-fidelity motion-based driving simulator.
Methods
Sequence analysis is a methodology that has grown up around social science research questions. It has developed into a powerful tool that supports intuitive visualizations, clustering analysis, covariate analyses, and Hidden Markov Models. These methods were used to create models for four different gaze behaviors and use the models to predict attention during the silent failure event.
Results
Predictive simulations were run with initial conditions that matched driver state just prior to the silent failure event. Actual gaze response times were observed to fall within distributions of predicted glances to the front. The three drivers with the largest glance response times were not able to take back manual control before colliding with the hazard.
Conclusions
The simulated glance response time distributions can be used in more sophisticated ways when combined with other data. The glance response time probability may be conditioned on other variables like time on task, time of day, prevalence of the current behavior for this driver, or other variables. Given the flexibility of sequence analysis and the methods it supports (clustering, HMMs), future studies may benefit from its application to gaze behavior and driving performance data.
Introduction
Level 2 automation provides control over vehicle steering and speed while still requiring the driver to monitor the roadway and environment, and be prepared to take over on short notice (SAE Citation2021). Level 2 automated driving systems (ADS) are available in various operational design domains (ODDs) such as in traffic jams and on highways at higher speeds. Under partial automation the driver remains responsible for monitoring their environment and the automation, as well as hazard detection and avoidance.
Situational awareness (SA) consists of seeing, understanding, and being able to predict elements of a person’s environment (Endsley Citation1995). Many tasks, driving included, are thought of as a closed-loop of perception, planning, and action. This has led to a characterization of situational awareness as being in, out of, or on “the loop” (Merat et al. Citation2019). Lapses in the monitoring task, or being out of the loop, arises because SA fades as users are no longer actively engaged in the driving task. Under automation people are often willing to engage with non-driving related tasks (NDRTs) to different degrees. Inappropriate (dis)trust in the automation can lead to misuse, disuse, and abuse of the system (Lee and See Citation2004). A key challenge in partial automation is therefore how to safely keep drivers on-the-loop when the automated feature is active.
Measures of gaze are commonly used to assess SA since looking is a prerequisite for awareness (de Winter et al. Citation2019). Well-developed models of distraction, like AttenD, now exist to characterize inattention (Ahlström et al. Citation2022) Eye glance behavior has been widely examined in the context of NDRT engagement while using automation (Gaspar and Carney Citation2019; Noble et al. Citation2021). Experienced drivers have different scanning strategies from novice drivers (Zeeb et al. Citation2015). Notably, they found that glances to an NDRT were 11 times longer in automated driving then they were in manual driving (12.6 sec vs 1.1 sec). Gaze behavior may also be an indicator of trust, with more trusting drivers engaging to greater degrees in an NDRT (Hergeth et al. Citation2016).
This paper models driver gaze behavior under traffic jam assist and highway assist while using a distracting visual-manual NDRT. A silent failure during a hazard reveals at the end of the drive tests the driver’s ability to notice and respond to the hazard. Zangi et al. (Citation2022) studied a similar situation and found that distracted drivers were less aware of hazards, having a lower probability of identifying them. In contrast to the latent hazards used by Zangi, our silent failure event revealed a materialized hazard — a dead deer in the driver’s lane.
Hidden Markov models (HMMs) have been applied to gaze data in several ways. Haji-Abolhassani and Clark (Citation2014) predicted driver task from eye movement patterns (Haji-Abolhassani and Clark Citation2014). Muñoz et al. (Citation2016) used both glance location and duration as inputs to a set of HMMs, one per class (just driving, visual-manual interactions, voice interface), each with two hidden states (Muñoz et al. Citation2016). Fridman et al. (Fridman et al. Citation2017) divided six-second glance epochs into 25 state samples, spaced 250 ms apart. They were interested in several driver states and behaviors (following too closely, failed to signal, speeding, adjusting radio, fatigue, talking, normal). Their approach was to train a binary HMM for each driver state or behavior that classified it as normal or not (e.g., normal vs. adjusting radio). The HMM with the highest probability had the winning vote for detected driver state. They achieve classification accuracy above 75% for talking, fatigue, radio-tuning activity, and failure to signal.
Sequence analysis is a methodology that has grown up around social science research questions. It has developed into a powerful tool that supports intuitive visualizations, clustering analysis, covariate analyses, and hidden Markov models (Helske et al. Citation2018). Some authors have applied it to driving topics from a social science perspective (Keatley et al. Citation2017; Xiao et al. Citation2020). We propose a novel application of sequence analysis to model driver attention-sharing behavior using gaze data. For more details on the methodology and results, we refer the reader to the accompanying supplement.
Methods
Apparatus
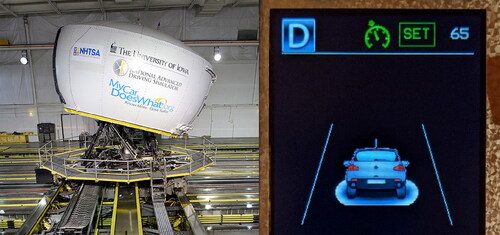
Data were collected using the high-fidelity full-motion NADS-1 simulator at the National Advanced Driving Simulator at the University of Iowa. The simulator consists of a 24-foot diameter dome enclosing a full-size 2014 Toyota Camry sedan with active steering and pedal feedback. A 13-degree of freedom motion system provides participants accurate acceleration, braking, and steering cues they expect from driving (see , left). Sixteen high-definition (1920 × 1200) LED (light emitting diode) projectors display seamless imagery on the interior walls of the dome with a 360-degree horizontal field of view. The data sampling rate was 240 Hz. The simulator is equipped with a research-grade eyetracker that records head position and eye movements throughout the drive.
Figure 1. NADS high-fidelity motion-based simulator (left), AutoDrive display (right).
Non-driving related task
While driving with the level 2 ADS, participants were instructed to perform an email task using a NADS-provided smart phone. The inbox in the email application contained fictional messages that were work-related, personal, or promotional. The participant was given rules for which actions to take with each type of message and was instructed that their final compensation would depend on how many emails they were able to process correctly during their drive. Since there was no need to turn off automation until the final event, the driver could be engaged with the same NDRT for almost the entire drive.
Experiment design
The simulator study was designed as a within-subject experiment in which participants experienced six traffic jam events (≈22 mph), six highway congestion events (≈55 mph), and one silent-failure event at the end of the drive. Data were collected from a sample of 24 licensed drivers aged 25-55 (50% male/female), and all study procedures were approved by the University of Iowa Institutional Review Board (IRB #202105014). Participants completed a ten-minute acclimation drive followed by a study drive. The simulator drives were located on a freeway loop, with three lanes of divided traffic in each direction. The two drives lasted about 60 minutes.
Participants received training about the capabilities and limitations of the ADS, including how to engage and disengage it. They were informed that they should remain engaged in the driving task by monitoring the environment and automation. When automation was engaged, they were permitted to remove their hands from the steering wheel. This experiment did not include a driver monitoring system (e.g., eyes on road, hands on wheel). At the end of each drive, there was a silent-failure hazard event in which a low-profile object was placed in the road (dead animal) that the ADS failed to detect. A lead vehicle swerved to reveal the object, and the driver was required to detect it, take over control, and evade it, though they were not instructed that such an event might occur.
Data
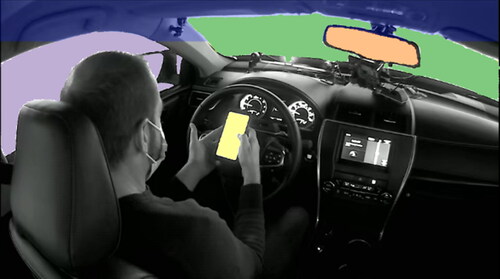
Data were collected from three sources: the simulator, an eye tracker, and video of the front scene and driver. After examining the eye-tracker data and potential areas of interest (AOI), four AOIs were selected: front, rearview mirror, left window and mirror, and phone task. The first three AOIs are static while the last is dynamic. Due to the dynamic nature of the phone task, video coding was done to classify task gaze. Eye-tracker data were relied on to classify glances to the static AOIs but supplemented in some cases with extra video coding. The AOIs are color-coded in .
Figure 2. Gaze AOIs: front, rearview mirror, left window and mirror, phone task.
Similar to the development in (Fridman et al. Citation2017), driver gaze was subdivided into consecutive 250 ms windows regardless of boundaries suggested by glance dwell time and saccades. Each window was assigned one of the AOIs or NA according to the gaze locations of a majority of frames in the window. Gaze location data were augmented by manual video coding where data quality was poor. The sequence of AOI classifications, sampled at 4 Hz, over the course of a drive is called the scan path. Scan-path sequences represent the main type of data analyzed in this project. Scan paths were supplemented by simulator data that indicated when drivers were in each event, vehicle speed, whether automation was engaged, and when the hazard was revealed and passed.
Modeling
HMMs are a discrete form of Bayesian model with both observable and hidden states. In our case, the observable states were gaze AOIs and the hidden states were not given any semantic meaning a priori. After training, one can track the observable states over time and deduce the most likely evolution of the hidden state. The modeling workflow began by creating scan path sequences from gaze AOI. Next we windowed down the sequences to 30 second consecutive sub-sequences. This window size is short enough to represent a single class of behavior, yet long enough to capture transitions from 120 AOI values. All scan-path data starting at the hazard reveal are reserved for a final testing step.
Scan-path sequences display almost infinite variability, even when windowed down, yet differences and commonalities can be used to cluster gaze behavior into a small number of distinct types. Hierarchical agglomerative clustering is an attractive method in that the number of clusters can easily be selected and changed after the computation is performed. However, clustering requires a distance (or dissimilarity) metric which is not obviously available for scan-path sequences. Considering AOI gaze zones as letters in an alphabet suggests the use of an edit distance as such a metric. The Levenshtein distance, also known as optimal matching edit distance (Navarro Citation2001), represents the minimal cost of transforming one sequence into another by insertion, deletion, and substitution operations.
With gaze behavior clusters in hand, we train an HMM for each one using approximately 75% of the scan-path subsequences per cluster as a training set and the rest as a validation test set. The train/test split was done by subject so that data from any given driver was used solely to either train or test. This sampling approach is stricter than simple stratification but makes it harder to achieve proportionately balanced classes. The validation procedure consists of running every test scan-path sub-sequence through each HMM model. The algorithm that estimates the hidden state given a sequence of observable states yields a log likelihood that serves as a confidence measure. The HMM with the highest log likelihood on a given sub-sequence is the one that best represents that data.
The models were tested on the reserved hazard response data to estimate the probability of a driver looking forward. We compared these predictions to the observed gaze response time as well as which drivers took over and evaded a crash. HMM evaluation leading up to the final event was used to categorize each driver by gaze behavior cluster at the moment of hazard reveal as well as which hidden state of that model was last active. That information forms the initial conditions of a simulation that was run for each driver for a period of 25 seconds. The first instance of front AOI observed in the simulation was used to compute the predicted gaze response time.
Results
Data analysis was conducted with the R statistical language (R Core Team Citation2017). We relied heavily on two packages for the analysis. The first was TraMineR, which facilitates sequence analysis and visualization (Gabadinho et al. Citation2011). The second was seqHMM, which builds upon TraMineR and provides the capability to create HMMs with sequence data (Helske and Helske Citation2019).
Scan path sequences
Scan-path sequences for event 11 (traffic jam) are visualized in . Gaze AOI is color-coded using the same scheme in . The x axis shows samples (four per second). The y axis has a row for each participant (N = 24). While some drivers spent the vast majority of the event looking at the task, some spent long periods looking to the front or out the left window.
Figure 3. Scan path sequences for one event.
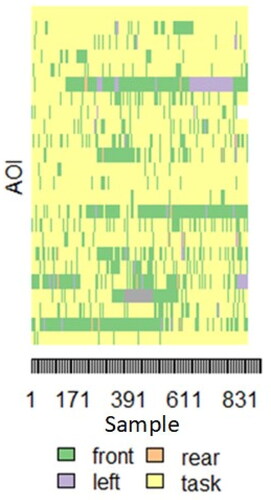
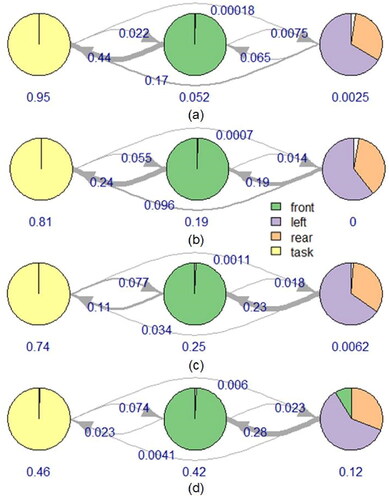
Figure 4. Four clusters in 30 second sequences describe driver behaviors. (a) disengaged, (b) mostly disengaged, (c) split evenly, (d) engaged.
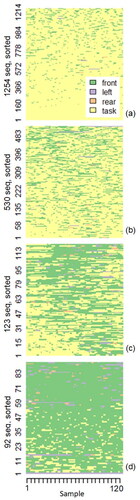
Figure 5. Hidden Markov Models for each cluster. Circles denote hidden states. State compositions show emission probabilities for each gaze AOI. (a) disengaged, (b) mostly disengaged, (c) split evenly, (d) engaged.
Segmented sequence clustering
TraMinR supports optimal matching edit distance as dissimilarity metric. The cost of performing insertions and deletions was set to a constant one, while the cost of substitutions was set using the AOI transition probability matrix. Thus, the cost of performing a substitution corresponding to a rarely-seen transition was more expensive than a common one. To use an English language analogy, substituting a ‘t’ with an ‘h’ is cheap, but with an ‘x’ it is expensive.
Sequence segments were clustered using hierarchical agglomerative clustering from the cluster R library. The resulting cluster dendrogram is a tree-like structure that demonstrates the nested hierarchy. Clustered scan-path sub-sequences with four clusters are shown in . Each row is a separate segmented sequence. The rows are ordered using the dissimilarity metric, thus revealing a gradient in the pattern from top to bottom. There is a clear shift in visual attention from task engagement to monitoring engagement across the clusters. Following this shift, we labeled the distinct gaze behaviors as disengaged (from the road-monitoring task), mostly disengaged, split, and engaged (with road-monitoring).
Hidden Markov models
HMMs with different numbers of hidden states were trained and evaluated on the test set. Two metrics were used to select the optimal number of states, one on the training side and one on the testing side. The Bayesian Information Criterion (BIC) for the trained HMMs were compared, with lower values preferred. The BIC indicated that four or five states gave the best fit in the HMM clusters. Testing performance was evaluated using balanced accuracy of classification performance where the reference class comes from clustering and the predicted class is the HMM with the greatest log likelihood for each sub-sequence. HMMs with three hidden states had better balanced accuracies for all four behavior types than did ones with more states. In the tradeoff between better training fit versus better testing performance, we prefer the latter and thus select three hidden states. The balanced accuracies across the four clusters was between 81% and 87%.
The HMMs trained for each behavior cluster are shown in , and they appear similar upon first glance. The first state is dominated by task glances, while the second is almost all front glances. The third hidden state is characterized by a mixture of glances, mostly composed of left and rear AOIs. Given these descriptions, we might label the states as task, front, and check. The arrows mark allowed transitions and the corresponding numbers denote the transition probabilities. Line width of the arrows serves as a visual indicator of transition probability. The numbers below each hidden state show it’s learned initial probability.
Predictive simulations
How can we use the HMMs? Given an initial probability, HMMs can be simulated over any duration of time. We used this to predict glance time to the front in the silent failure event. The procedure followed these steps:
Determine the last behavior cluster before the silent failure for each participant.
Determine the final estimated hidden state probabilities before the silent failure.
Configure the HMM from step 1 with initial probabilities set to the final state probabilities from step 2.
Simulate the HMM 100 times for 25 seconds each.
Measure the distribution of response times before the first observed front glance.
The distribution of glance response times is a function of both which HMM is run as well as in which state the simulation begins. If the initial hidden state is front then the glance response time is immediate; however, if the initial state is task or check then there is some probability at each step that the state will transition to front.
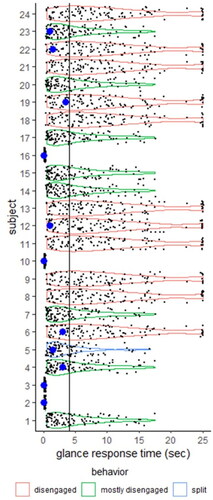
Predicted glance response time distributions are shown in . Observed glance times are overlaid as large blue points and the end of the event, where the driver passes the hazard, is draw as a line just before five seconds. None of the participants were in the engaged behavior prior to the silent failure event. The three drivers with the largest glance response times (subjects 4, 6, 19) did not have enough time to take control before colliding with the hazard.
Figure 6. Simulated glance response times during the silent failure event. Large dots show actual glance response times. Driver behavior prior to the event is color coded.
Discussion
Despite being instructed to monitor the road and automation, analysis of the gaze AOIs revealed a high degree of engagement with the NDRT. Each driver adopted their own strategy of context switching between task engagements and monitoring their environment. Some outlier occurrences of long gaze times out the left window were observed late in the drive (see ) and attributed to mental fatigue, boredom, and mind wandering.
There are some potential limitations in this study. Our workflow for predictive simulations assumed that no other cues were available in the silent failure. Since motion cues or system alerts were not included in the model, they would have had to be accounted for in some other way, had they occurred. Only one type of NDRT, a phone email task, was used in the current project. By its nature, the task was ‘chunkable’ and drivers were able to develop strategies to switch their attention between the task and the environment. Different tasks will place different cognitive, visual, manual, and emotional demands on the driver and should be studied. The level 2 system tested would not be appropriate for commercial deployment since it lacked enforcement of an eyes-on-road or hands-on-wheel policy. We would expect most drivers to drastically lessen their engagement with a visual-manual NDRT under such a policy. Another factor that should lessen NDRT engagement is prior experience with reduced system reliability, something that brief exposure to the simulated ADS did not provide.
The simulated glance response time distributions can be used in more sophisticated ways when combined with other data. The glance response time probability may be conditioned on other variables like time on task, time of day, prevalence of the current behavior for this driver, or other variables. The application of sequence analysis to real-time gaze behavior appears to be novel. Given the flexibility of this technique and the methods it supports (clustering, HMMs), future studies may benefit from applying sequence analysis to gaze behavior and driving performance data.
Supplemental Material
Download Zip (5.4 MB)Disclosure statement
No potential conflict of interest was reported by the authors.
Additional information
Funding
References
- Ahlström C, Georgoulas G, Kircher K. 2022. Towards a context-dependent multi-buffer driver distraction detection algorithm. IEEE Trans Intell Transport Syst. 23(5):4778–4790.
- de Winter JC, Eisma YB, Cabrall C, Hancock PA, Stanton NA. 2019. Situation awareness based on eye movements in relation to the task environment. Cogn Tech Work. 21(1):99–111. doi: 10.1007/s10111-018-0527-6.
- Endsley MR. 1995. Toward a theory of situation awareness in dynamic systems. Hum Factors. 37(1):32–64. doi: 10.1518/001872095779049543.
- Fridman L, Toyoda H, Seaman S, et al. 2017. What can be predicted from six seconds of driver glances? CHI ’17: Proceedings ot the 2017 CHI Conference on Human Factors in Computing Systems, 2805–2813. doi: 10.1177/0018720815625.
- Gabadinho A, Ritschard G, Mueller NS, Studer M. 2011. Analyzing and visualizing state sequences in R with TraMineR. J Stat Softw. 40(4):1–37. doi: 10.18637/jss.v040.i04.
- Gaspar J, Carney C. 2019. The effect of partial automation on driver attention: A naturalistic driving study. Hum Factors. 61(8):1261–1276. doi: 10.1177/0018720819836310.
- Haji-Abolhassani A, Clark JJ. 2014. An inverse Yarbus process: Predicting observers’ task from eye movement patterns. Vision Res. 103:127–142. doi: 10.1016/j.visres.2014.08.014.
- Helske S, Helske J, Eerola M. 2018. Combining sequence analysis and hidden Markov models in the analysis of complex life sequence data. In: Ritschard G, Studer M, editors. Sequence analysis and related approaches. Cham: Springer. p. 185–200.
- Helske S, Helske J. 2019. Mixture hidden Markov models for sequence data: The seqHMM package in R. J Stat Softw. 88(3):1–32. Doi: 10.18637/jss.v088.i03.
- Hergeth S, Lorenz L, Vilimek R, Krems JF. 2016. Keep your scanners peeled: Gaze behavior as a measure of automation trust during highly automated driving. Hum Factors. 58(3):509–519. 10.1177/0018720815625.
- Keatley D, Barsky A, Clarke D. 2017. Driving under the influence of alcohol: a sequence analysis approach. Psych Crime Law. 23(2):135–146. doi: 10.1080/1068316X.2016.1228933.
- Lee JD, See KA. 2004. Trust in automation: designing for appropriate reliance. Hum Factors. 46(1):50–80. dis: 10.1518/hfes.46.1.50_30392.
- Merat N, Seppelt B, Louw T, Engström J, Lee JD, Johansson E, Green CA, Katazaki S, Monk C, Itoh M, et al. 2019. The “out-of-the-loop” concept in automated driving: Proposed definition, measures and implications. Cogn Tech Work. 21(1):87–98. doi: 10.1007/s10111-018-0525-8.
- Muñoz M, Reimer B, Lee J, Mehler B, Fridman L. 2016. Distinguishing patterns in drivers’ visual attention allocation using Hidden Markov Models. Trans Res Part F: Traffic Psych Beh. 43:90–103. 10.1016/j.trf.2016.09.015.
- Navarro G. 2001. A guided tour to approximate string matching. ACM Comput Surv. 33(1):31–88.
- Noble AM, Miles M, Perez MA, Guo F, Klauer SG. 2021. Evaluating driver eye glance behavior and secondary task engagement while using driving automation systems. Accid Anal Prev. 151:105959. dis: 10.1016/j.aap.2020.105959.
- R Core Team. 2017. A language and environment for statistical computing. Vienna, Austria. https://www.R-project.org/.
- SAE. 2021. Taxonomy and definitions for terms related to driving automation systems for on road motor vehicles. SAE J 3016-2021.
- Xiao J, Su R, McBride EC, Goulias KG. 2020. Exploring the correlations between spatiotemporal daily activity-travel patterns and stated interest and perception of risk with self-driving cars. AGILE GIScience Ser. 1:1–15. doi: 10.5194/agile-giss-1-22-2020.
- Zangi N, Srour-Zreik R, Ridel D, Chasidim H, Borowsky A. 2022. Driver distraction and its effects on partially automated driving performance: A driving simulator study among young-experienced drivers. Accid Anal Prev. 166:106565.
- Zeeb K, Buchner A, Schrauf M. 2015. What determines the take-over time? An integrated model approach of driver take-over after automated driving. Accid Anal Prev. 78:212–221. Doi: 10.1016/j.aap.2015.02.023.