
Abstract
Objective
Drivers’ ability to extract visual information efficiently from mirrors or camera-based visibility systems impacts driving performance when carrying out maneuvers such as lane changes. The objective of the research was to compare drivers’ eye gaze behavior and driving performance with mirrors versus camera-based visibility systems (i.e., CMS, or camera monitor system) to identify any differences and possible impacts on safety.
Methods
A test track study was conducted comparing drivers’ eye gaze and lane change behavior when driving a vehicle equipped with outside mirrors versus a prototype CMS. Participants’ opinions regarding usability and comfort in using mirrors versus the tested CMS were also obtained using a post-drive questionnaire.
Results
Study results were somewhat mixed but did demonstrate that with the tested CMS, participants took longer to pass a slower moving vehicle and maintained a greater resultant distance from the passed vehicle. Additionally, participants had a greater number of fixations to the CMS displays compared to the outside rearview mirrors. Results also found slight perceived advantages for the tested CMS in regard to ease of use, comfortability, and visibility. When asked to choose which rear visibility technology they would prefer to use in everyday driving, most participants preferred the outside rearview mirrors over the tested prototype CMS or having both systems. However, not all lane change and gaze metrics followed the same pattern.
Conclusions
In this study, participants’ longer time to pass a slower moving vehicle, greater distance when passing a slower moving vehicle, greater number of fixations, and lower subjective ratings with the tested CMS may indicate difficulty in judging distances and focusing on the electronic image. This study provides preliminary findings that suggest differences in driving behavior exist between a single tested prototype CMS and outside rearview mirrors and is a foundational step toward evaluating whether these trends are consistent across different systems and overall implications for safe driving behavior.
Introduction
Camera monitor systems (CMS) are designed to supplement or replace vehicle outside mirrors using cameras that transmit video images to electronic visual displays inside the vehicle. Currently, Federal Motor Vehicle Safety Standard (FMVSS) No. 111 (Citation2022) contains specific requirements for equipping light vehicles with “inside” and “outside” rearview mirrors to provide a driver with a view of areas aft of the driver location. The National Highway Traffic Safety Administration (NHTSA) has received rulemaking petitions from manufacturers seeking permission to install CMS, instead of outside rearview mirrors, on both light and heavy vehicles. This article describes research conducted to support determination of whether CMS can provide the same level of safety as required rearview mirrors.
NHTSA’s 2019 Advance Notice of Proposed Rulemaking (ANPRM) outlined CMS performance concerns and human factors questions regarding drivers’ ability to safely use CMS for which data are needed to inform the decision whether to permit CMS in lieu of required outside mirrors (NHTSA Citation2019). Past research has shown both potentially positive findings and identified safety concerns regarding CMS in heavy trucks (Fitch et al. Citation2011; Wierwille et al. Citation2008) and light vehicles (Large et al. Citation2016; Mazzae et al. Citation2018; Schmidt et al. Citation2016). The ANPRM outlines research questions for investigation including whether a CMS equivalently “provides a clear and reasonably unobstructed view” and whether CMS affect drivers’ ability to “visually discern and focus on objects in an electronic visual display as compared to objects reflected by mirrors” (NHTSA Citation2019). Mirrors allow for the disparity in visual angle of two eyes, providing a correlate to direct vision. However, light does not reflect off electronic displays in the same way as mirrors, perhaps affecting the binocular cues signaling depth and image clarity.
Study objectives
To begin investigating research questions set forth in the ANPRM (NHTSA Citation2019), a small experiment was performed to examine drivers’ use of a prototype CMS replacing outside mirrors as compared to outside rearview mirrors alone. Analyses sought to answer whether lane change performance, eye gaze behavior, and subjective impressions of visibility and comfort differed between the CMS and mirrors conditions.
Method
Recruitment
The nine participants were 25-65 years old, held a U.S. driver’s license with no more than two points, had no uncorrected vision or hearing problems, and drove at least 11,000 miles annually. Candidates were required to be either current or recent owners of the vehicle model used in testing (2 participants), or owners of a similar compact vehicle (7 participants).
Approach
This experiment used a 2 (rear visibility technology) × 2 (time of day) completely within-subjects experimental design. Rear visibility technology included two technologies: outside rearview mirrors and CMS. Time of day included two levels: daylight and darkness. Participants completed two experimental sessions on different days in which experimental conditions were quasi-randomized and counterbalanced. Participants completed both rear visibility technology conditions within one time of day condition, but the order of conditions was counterbalanced. In each condition, participants completed test-track drives requiring lane changes to pass a slower moving vehicle.
Rear visibility technologies and test vehicle
The test vehicle was a European-market compact vehicle model that has a similar U.S. version. The vehicle was equipped with both original equipment (OE) European-specification mirrors and a production-ready prototype CMS. In the CMS condition, the outside rearview mirrors were unavailable for use, and vice versa. The vehicle’s OE planar inside rearview mirror was available for use in both conditions.
CMS components included two exterior-mounted cameras and two electronic visual displays mounted inside the vehicle just aft of the respective A-pillars at a height similar to that of outside mirrors. Each camera’s horizontal field of view angle was approximately 46 degrees.
The test vehicle’s European OE driver-side outside rearview mirror was not planar and, thus, not FMVSS No. 111 compliant. The driver-side mirror was primarily convex (1300 mm radius of curvature) with a small outer aspheric section. The passenger-side mirror was convex (1300 mm radius of curvature). The outside mirrors’ horizontal field of view angles as estimated for a 50th percentile male driver were approximately 19 degrees for the driver side and 13 degrees for the passenger side. Test participants were permitted to adjust the mirrors, so the available fields of view likely differed for each driver. Even though the OE driver-side outside rearview mirror was convex, this vehicle was used for this preliminary research as it provided a way to test a CMS and mirrors within the same vehicle.
Apparatus
Two identical sedans served as scenario vehicles that created the need for the participant to change lanes and pass a slower lead (scenario) vehicle. A custom-built data acquisition system (DAS) was used to record data from the vehicle’s CAN bus and from an Oxford Technical Solutions (OxTS) RT (RT3000 v2) with an OxTS RT Range. Vehicle position, acceleration, and velocity for the test vehicle and scenario vehicles were recorded. A Smart Eye Pro off-the-head eye-tracking system and iMotions software were used to record driver eye gaze information. All data was time-synchronized through the DAS.
Procedure
The participant completed an informed consent process and received instructions about driving on the track and the test scenarios. The participant was instructed to drive normally and maintain a constant speed of 60 mph. Additionally, the participant was instructed to change lanes to pass any slower moving vehicles and return to the original lane afterward.
The experimenter showed the participant the test vehicle, demonstrated use of the assigned rear visibility technology, and calibrated the eye tracker. The experimenter then moved to one of the scenario vehicles to prevent observation biases and to provide and monitor communication with the participant. The experimenter limited communication with the participant to only relaying the primary driving lane and deviations from the procedure due to other traffic.
Participants drove on an oval test track with two 2-mile straightaways in which lane change scenarios were presented (). A detailed explanation of the driving task is provided in A1. The data collection drive consisted of an initial “familiarization” lap and four test laps. After completing the driving protocol, the participant completed a questionnaire about the rear visibility technology.
Figure 1. Visual representation of the lane change scenarios for two left passing maneuvers within one straightaway.
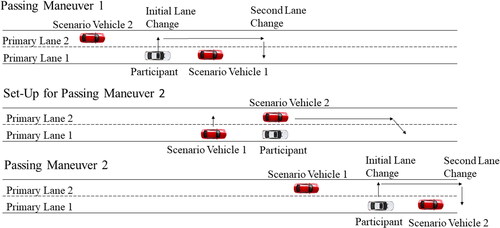
The same procedural steps were followed for the second rear visibility technology including a second iteration of the questionnaire. Lastly, the participant was debriefed and paid for participation. Each participant’s experimental session was approximately 3 hours.
Results
Data processing
Lane change start was designated by a heading angle of more than 1.2 degrees and a lateral offset to the lane center of more than 1 meter.
Each passing maneuver included two lane changes: as the participant approached the slower moving scenario vehicle, an initial lane change was made into the adjacent lane followed by a second lane change of opposite direction that returned the test vehicle to the primary lane ahead of the slower scenario vehicle. Each participant completed 16 passing maneuvers.
Lane change performance
The following metrics quantified lane change performance: time to complete a passing maneuver and overtake distance in front of the passed slower moving vehicle. Linear mixed effects analysis was performed in R (R Core Team Citation2021) using the lmer package and figures were produced using the ggplot2 package (Wickham Citation2009).
Separate linear mixed effects models were run on the total passing maneuver completion time and overtake distance. In these models, fixed effects of rear visibility technology, time of day, and lane change direction and their interactions were included as well as a random intercept term for participant. Satterthwaite’s (Citation1946) method was used to obtain t- and p- values and degrees of freedom. Tukey’s method was used for multiple comparisons corrections.
Passing maneuver total completion time
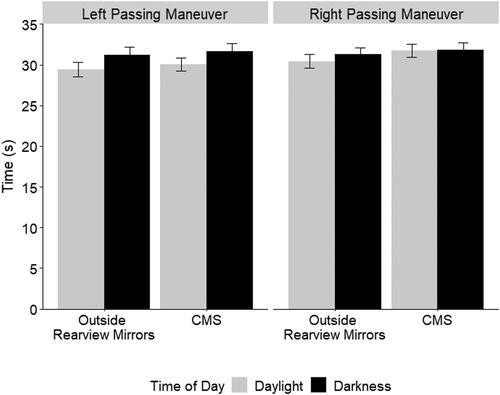
Results found significant effects for rear visibility technology, time of day, and passing maneuver direction. The average time to complete a passing maneuver was longer for drives with the CMS (M = 31.33 s, SE = 2.26 s) compared to outside rearview mirrors (M = 30.57 s, SE = 2.26 s). The average time to complete a passing maneuver was longer for drives in darkness (M = 31.48 s, SE = 2.26 s) compared to daylight (M = 30.42 s, SE = 2.26 s, p < 0.05). The average time to complete a passing maneuver was longer for right passing maneuvers (M = 31.34 s, SE = 2.26 s) compared to left passing maneuvers (M = 30.57 s, SE = 2.26 s). All other tests failed to gain significance. The results are displayed in .
Figure 2. Average duration in seconds to complete a full passing maneuver. The left panel displays the time to complete a left passing maneuver for outside rearview mirrors and the tested camera monitoring system (CMS) in daylight and darkness and the right panel displays the time to complete a right passing maneuver for outside rearview mirrors and the tested camera monitoring system (CMS) in daylight and darkness. Error bars are standard error.
Overtake distance
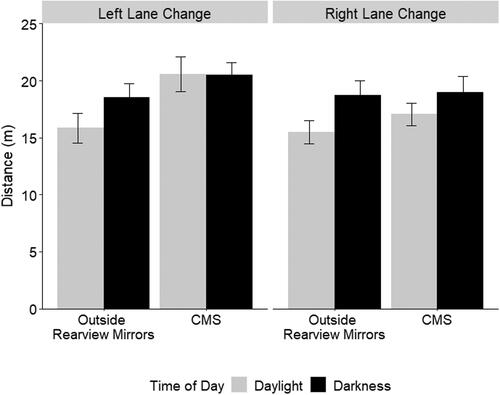
The overtake distance was defined using the resultant distance which includes both the lateral and longitudinal distances to the slower moving vehicle as the participant’s vehicle passes and changes lanes in front of it. Results found significant effects for rear visibility technology, time of day, and lane change direction. The average overtake distance was greater for the CMS (M = 19.27 m, SE = 2.69 m) compared to outside rearview mirrors (M = 17.14 m, SE = 2.69 m, p < 0.05). The average overtake distance was greater in darkness (M = 19.17 m, SE = 2.69 m) compared to daylight (M = 17.24 m, SE = 2.69 m, p < 0.05). The average overtake distance was greater for making a left lane change in front of the passed vehicle (M = 18.86 m, SE = 2.69 m) compared to making a right lane change in front of the passed vehicle (M = 17.56 m, SE = 2.69 m, p < 0.05). Results also found a significant rear visibility technology × lane change direction interaction. The average overtake distance differed between the CMS and outside rearview mirrors when making a left lane change in front of the passed vehicle. The average overtake distance was greater for making a left lane change with the CMS (M = 20.53 m, SE = 2.73 m) compared to making a left lane change with outside rearview mirrors (M = 17.19 m, SE = 2.73 m, p < 0.05). The average overtake distance did not differ between the CMS and outside rearview mirrors when making a right lane change (p = 0.30). All other tests failed to gain significance. The results are displayed in .
Figure 3. Average overtake distance in meters when passing the slower moving scenario vehicle. The left panel displays the overtake distances for left lane changes with outside rearview mirrors and the tested camera monitoring system (CMS) in daylight and darkness and the right panel displays the overtake distances for right lane changes with outside rearview mirrors and the tested camera monitoring system (CMS) in daylight and darkness. Error bars are standard error.
Visual behavior
Eye-gaze metrics included the number of visual fixations, average duration of fixations, and total fixation durations. Fixations were calculated using an I-VT algorithm with a velocity threshold of 40 deg/s and a minimum fixation duration of 100 ms. A median filter with a window of three samples was used for noise reduction.
Gaze analyses looked at a lane change timeframe including the 3 seconds prior to lane change initiation through lane change completion. Only fixations to the driver-side CMS display, driver-side outside rearview mirror, inside rearview mirror, passenger-side CMS display, and passenger-side outside mirror were included in the analysis. Additionally, even though the CMS and outside mirrors were always present on the vehicle, since the CMS displays were not usable when driving with outside rearview mirrors and vice versa, when comparing areas of interest, only useable areas of interest were included within a rear visibility technology.
Analyses were performed in a two-step process involving a first step linear mixed effects model which included fixed effects of rear visibility technology, time of day, and lane change direction and their interactions as well as a random intercept term for participant. A follow-up linear mixed effects model was performed which included fixed effects of rear visibility technology, time of day, and area of interest and their interactions as well as a random intercept term for participant. Three specific areas of interest were included in the second model: driver-side rear outside rearview mirror/CMS display, inside rearview mirror, and passenger-side outside rearview mirror/CMS display.
Number of fixations
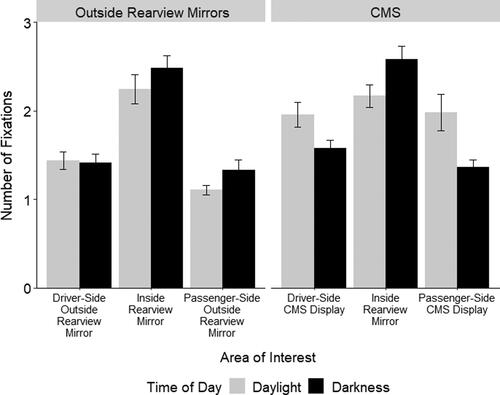
The number of fixations during a lane change is the sum of all the individual fixations made during a lane change. The first step Poisson linear mixed effects model found a significant time of day effect. Participants made more fixations in darkness (M = 0.63, SE = 0.09) compared to daylight (M = 0.54, SE = 0.09, p < 0.05). All other tests failed to gain significance. The second step Poisson linear mixed effects model found significant fixed effects for rear visibility technology and area of interest. Participants made more fixations with the CMS (M = 0.57, SE = 0.08) compared to outside rearview mirrors (M = 0.42, SE = 0.08, p < 0.05). Participants made more fixations to the inside rearview mirror (M = 0.75, SE = 0.08) compared to both the driver-side outside rearview mirror/CMS display (M = 0.43, SE = 0.09, p < 0.05) and the passenger-side outside rearview mirror/CMS display (M = 0.31, SE = 0.09, p < 0.05). All other tests failed to gain significance. The results are displayed in .
Figure 4. Number of fixations to relevant areas of interest during lane changes. The left panel displays the number of fixations across areas of interest for outside rearview mirrors in daylight and darkness and the right panel displays the number of fixations across areas of interest for the tested camera monitoring system (CMS) in daylight and darkness. Error bars are standard error.
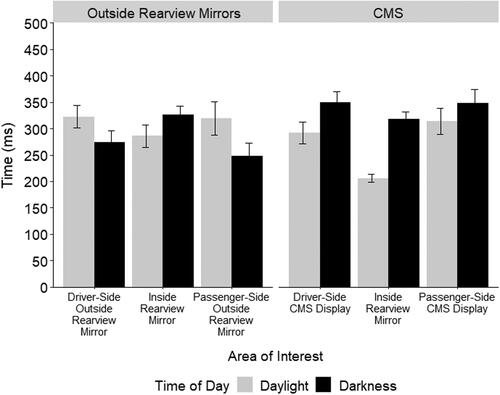
Average fixation durations
The average fixation duration is the average of the individual fixation durations during a lane change. The first step linear mixed effects model found a significant effect for time of day and a significant rear visibility technology × time of day interaction. Participants fixated for a longer average duration in darkness (M = 296.51 ms, SE = 24.87 ms) compared to daylight (M = 268.26 ms, SE = 24.88 ms, p < 0.05). Within daylight, participants fixated for a longer average duration with outside rearview mirrors (M = 297.43, SE = 26.26 ms) compared to the CMS (M = 239.08 ms, SE = 25.69 ms, p < 0.05). Average fixation durations did not significantly differ between the CMS and outside rearview mirrors in darkness (p = 0.11).
The second step linear mixed effects model found an effect approaching significance (p = 0.052) for area of interest, as well as significant rear visibility technology × time of day, rear visibility technology × area of interest, and time of day × area of interest interactions. Participants fixated for a longer average fixation duration to the driver-side outside rearview mirror/CMS display (M = 296.42 ms, SE = 25.29 ms) compared to the inside rearview mirror (M = 268.16 ms, SE = 24.32 ms, p < 0.05).
Within daylight, participants fixated for a longer average fixation duration with the mirrors (M = 303.68 ms, SE = 25.90 ms) compared to the CMS (M = 253.06 ms, SE = 25.52 ms, p < 0.05). However, within darkness, participants fixated for a longer average fixation duration with the CMS (M = 315.59 ms, SE = 25.20 ms) compared to mirrors (M = 268.92 ms, SE = 26.76 ms, p < 0.05). Additionally, participants fixated for a longer average fixation duration to the inside rearview mirror when driving with mirrors (M = 289.77 ms, SE = 25.78 ms) compared to CMS (M = 246.56 ms, SE = 24.95 ms, p < 0.05). The results are displayed in .
Figure 5. Average fixation duration to relevant areas of interest during lane changes. The left panel displays average fixation durations across areas of interest for outside rearview mirrors in daylight and darkness and the right panel displays average fixation durations across areas of interest for the tested camera monitoring system (CMS) in daylight and darkness. Error bars are standard error.
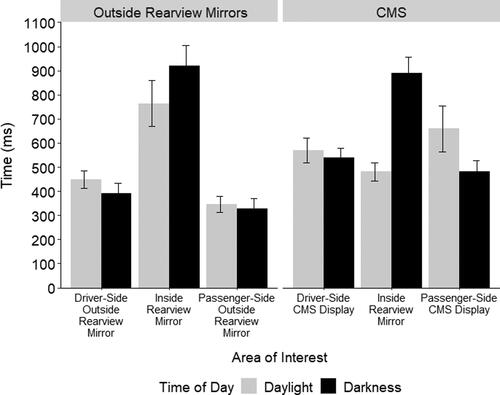
Total fixation durations
The total fixation duration is a sum of the individual fixation durations during a lane change. The first step linear mixed effects model found a significant effect for time of day. Participants fixated for a longer total duration during darkness (M = 629.66 ms, SE = 105.66 ms) compared to daylight (M = 475.55 ms, SE = 105.69 ms, p < 0.05).
The second step linear mixed effects model found significant effects for time of day, area of interest, and significant rear visibility technology × area of interest and time of day × area of interest interactions. Participants fixated for a longer total duration in darkness (M = 552.87 ms, SE = 100.22 ms) compared to daylight (M = 470.91 ms, SE = 99.83). Participants fixated for a longer total duration to the inside rearview mirror (M = 661.46 ms, SE = 99.32 ms) compared to either the driver-side outside rearview mirror/CMS display (M = 457.58 ms, SE = 102.30 ms) or the passenger-side outside rearview mirror/CMS display (M = 416.64 ms, SE = 104.42 ms). Specifically, participants fixated for a longer total duration to the inside rearview mirror when driving with mirrors (M = 718.31 ms, SE = 103.79 ms) compared to the CMS (M = 604.61 ms, SE = 101.25 ms, p < 0.05). Total fixation durations did not differ between rear visibility technologies to the other areas of interest. Additionally, in darkness, participants fixated for a longer total duration to the inside rearview mirror (M = 789.25 ms, SE = 101.96 ms) compared to both the driver-side outside rearview mirror/CMS display (M = 445.31 ms, SE = 108.12 ms, p < 0.05) and the passenger-side outside rearview mirror/CMS display (M = 424.06 ms, SE = 114.28 ms, p < 0.05). Within daylight, total fixation durations did not differ across areas of interest. The results are displayed in .
Figure 6. Total fixation duration to relevant areas of interest during lane changes. The left panel displays total fixation durations across areas of interest for outside rearview mirrors in daylight and darkness and the right panel displays total fixation durations across areas of interest for the tested camera monitoring system (CMS) in daylight and darkness. Error bars are standard error.
Post-drive subjective questionnaire
The post-drive questionnaire assessed participants’ opinions of each rear visibility technology. Participants provided ratings on a Likert-type scale of 1 (strongly disagree) to 7 (strongly agree). Statistical comparisons were not performed on subjective ratings, but mean ratings are summarized below.
In general, participants rated the mirrors (M = 6.00) as slightly easier to use than the CMS (M = 5.50). They also rated outside rearview mirrors (M = 6.00) as slightly more comfortable to use than the CMS (M = 5.56). Participants rated the field of view size provided by outside rearview mirrors to be more acceptable (M = 6.28) compared to the CMS (M = 5.67).
In darkness, participants rated the image quality of the CMS as worse than the outside rearview mirrors. The image quality of the CMS was rated almost a full scalar lower (M = 4.89) in darkness compared to daylight (M = 5.56), while the rating difference between darkness (M = 5.78) and daylight (M = 6.00) with the outside rearview mirrors was considerably smaller. In the daylight, participants indicated they were less able to judge distances with the CMS (M = 4.44). Participants rated being able to judge distances with the CMS better in darkness (M = 5.50); however, still rated this accuracy as lower than judging distances with outside rearview mirrors in daylight (M = 6.50) or darkness (M = 5.61). When asked which technology they would prefer to use in everyday driving, most participants preferred the outside rearview mirrors (N = 5) over the CMS (N = 2) or having both systems (N = 2).
Discussion
Participants took longer and maintained a greater distance when passing a slower moving vehicle with the tested CMS compared to outside rearview mirrors when making a left lane change in front of the slower vehicle. Participants also made more fixations when driving with the tested CMS compared to the outside rearview mirrors. While participants also had longer average fixation durations when driving with the CMS in darkness, other gaze metrics did not always follow a similar pattern. Average fixations were longer when driving with outside rearview mirrors in daylight and total fixation durations did not differ overall between conditions. When looking across areas of interest, average fixation and total fixation durations were longer to the inside rearview mirror in the mirrors condition. This may imply that participants were allocating attention differently across the three areas of interest with the tested CMS compared to outside rearview mirrors. Subjective questionnaire ratings were slightly higher for the tested CMS regarding ease of use, comfortability, and image quality, but these differences were generally on the scale of half a level of a Likert scale rating, were not assessed statistically, and reflect a small sample’s opinions about a specific CMS. Participants also rated being less able to accurately judge distances with the CMS compared to the outside rearview mirrors and preferred the outside rearview mirrors over the CMS or having both systems.
Interpreting the greater number of fixations, longer and slower overtakes for right passing maneuvers, and ratings of the tested CMS, provides some evidence of inaccuracies when judging distances. However, overtake distance and passing time did not differ for left passing maneuvers and other eye metrics did not always show a difference between the outside rearview mirrors and the tested CMS. While disentangling these results is beyond the scope of this preliminary study, it is part of a larger research program which will attempt to evaluate this distinction more fully.
Conclusions
Overall, results of this small, preliminary study suggest that drivers’ behavior in using the tested prototype CMS was different in terms of lane change performance, eye gaze behavior, and subjective impressions. The results showed differences in overtake distance, passing maneuver completion time, number of fixations, average fixation durations, and total fixation durations when comparing the tested CMS to OE outside rearview mirrors. However, the pattern of results was not always in the same direction. Further, participants were exposed to the CMS only for the duration of the study and were less familiar with the tested CMS overall compared to mirrors, although the OE driver-side convex (not FMVSS No. 111 compliant) mirror on the European model test vehicle was also less familiar to the U.S. driver participants. This study is part of a larger research program that will gather additional data on drivers’ use of CMS to assess whether these trends are consistent with a larger sample size, other systems, and the implications for driving safety.
Disclosure of ethics approvals
The authors confirm this manuscript obtained necessary ethics approvals prior to data collection through Sterling Institutional Review Board with protocol approval number 7786. All aspects of recruitment, data collection, and analysis were conducted in accordance with this approval.
Supplemental Material
Download Zip (30.6 KB)Additional information
Funding
References
- Code of Federal Regulations. 2022. Code of Federal Regulations, 49 CFR Ch. V, Sec. 571.111, Standard No. 111. Rear visibility. Available at: https://www.ecfr.gov/current/title-49/subtitle-B/chapter-V/part-571/subpart-B/section-571.111.
- Fitch G, Blanco M, Hanowski R, Camden M. 2011. Field demonstration of heavy vehicle camera/video imaging systems. SAE Int J Commer Veh. 4(1):171–184. (2011-01-2245):
- Large DR, Crundall E, Burnett G, Harvey C, Konstantopoulos P. 2016. Driving without wings: The effect of different digital mirror locations on the visual behaviour, performance and opinions of drivers. Appl Ergon. 55:138–148.
- Mazzae EN, Baldwin GHS, Andrella AT. 2018. Examination of a prototype camera monitor system for light vehicle outside mirror replacement (Report No. DOT HS 812 582). Washington, DC: National Highway Traffic Safety Administration.
- National Highway Traffic Safety Administration (NHTSA). 2019. Federal Motor Vehicle Safety Standard No. 111, Rear Visibility: Advance notice of proposed rulemaking (ANPRM). 84 FR 54533. Docket No. NHTSA-2018-0021.
- R Core Team. 2021. R: A language and environment for statistical computing. Vienna, Austria: R Foundation for Statistical Computing. Available at: https://www.R-project.org/.
- Satterthwaite FE. 1946. An approximate distribution of estimates of variance components. Biometrics Bulletin. 2(6):110–114.
- Wickham H. 2009. ggplot2: elegant graphics for data analysis. New York: Springer.
- Schmidt EA, Hoffmann H, Krautscheid R, Bierbach M, Frey A, Gail J, Lotz-Keens C. 2016. Camera-monitor systems as a replacement for exterior mirrors in cars and trucks. In Handbook of camera monitor systems, p. 369–435. Cham: Springer.
- Wierwille WW, Schaudt WA, Spaulding JM, Gupta SK, Fitch GM, Wiegand DM, Hanowski RJ. 2008. Development of a performance specification for camera/video imaging systems on heavy vehicles. Washington (DC): National Highway Traffic Safety Administration. Report No. DOT HS 810 960.