
 ?Mathematical formulae have been encoded as MathML and are displayed in this HTML version using MathJax in order to improve their display. Uncheck the box to turn MathJax off. This feature requires Javascript. Click on a formula to zoom.
Abstract
Objectives
Automated driving (AD) from SAE level 3 onwards represents a paradigm change from human driver controlling the vehicle to a technical system controlling it. In this light, different regulatory bodies (European Commission, Germany, etc.) have defined guidelines for the operation of such a system. One core principle of these guidelines is that the automated operation needs to be at least as safe as human driving—often referred to as the “positive risk balance.” However, these guidelines are general and do not provide details on what this means in a practical sense. This article discusses a method to demonstrate how positive risk balance can be addressed in practice.
Methods
Starting from a detailed analysis of corresponding guidelines and a literature review of possible risk assessment frameworks, a comprehensive approach has been developed to consider ethical requirements for the development of AD. This approach covers different development stages. The PrOACT-URL (Problems, Objectives, Alternatives, Consequences, Trade-offs, Uncertainty, Risk attitudes, and Linked decisions) approach was chosen for reporting of the work.
Results
The article will present the approach developed by BMW to ensure that a positive risk balance is achieved for an AD system. The approach is presented per development stage (concept phase, AD development phase, verification and validation phase, post–start of production phase). In the concept phase, the scope is to define how good a human driver is and how good an AD needs to be. In the AD development phase, first the relevant system requirements need to be derived. Monte Carlo experiments in combination with Bayesian networks are applied. The fulfillment of these requirements is checked in the verification phase through simulations and test track and real-world tests. For validation of the risk balance, the impact of AD in terms of traffic safety is derived by means of simulation. In the post–start of production phase, field observation is used.
Conclusion
The safety of AD is paramount when it comes to its operation and ensuring trust in this technology. The described approach contributes directly to building this trust by considering the principle of a positive risk balance throughout the development in addition to existing safety standards for advance driver assistance systems, such as ISO 26262, ISO21434 or ISO 21488.
Introduction
Highly automated driving (AD)—that is, automated driving with SAE level 3 or higher (SAE Citation2021)—is associated with a variety of improvements for road traffic, such as comfort, traffic flow, emission reduction, and road safety (Payre et al. Citation2014; Kyriakidis et al. Citation2015), compared to today’s traffic. However, it also represents a paradigm change from a human driver controlling the vehicle to a technical system controlling it. Against this background, different regulatory bodies (European Commission, Germany, etc.) have defined (ethical) guidelines for the operation of AD systems. In 2016, the German government established an ethics commission to address legal and ethical issues of AD. The commission’s report stated that approval of AD technology should only be issued if it causes fewer collisions than human drivers; that is, the technology must have a positive risk balance (PoRiBa; Di Fabio et al. Citation2017). The 2020 report by the European Union’s Commission Expert Group also expects a decrease in accident risk with AD (Bonnefon et al. 2020). The White Paper “Safety First for Automated Driving” (Wood et al. Citation2019) proposed safety by design and verification and validation methods for AD systems of SAE level 3 and level 4 (SAE Citation2021) to demonstrate PoRiBa. In 2021, the United Nations Economic Commission for Europe (UNECE) released Regulation No. 157 for automated lane keeping systems up to 60 kph. Regarding safety, it states that the driver as well as surrounding traffic participants should not be exposed to a higher risk with the introduction of AD systems. This was underlined by the requirement to compare AD to a competent and careful driver, which should be the baseline for scenarios that are not explicitly addressed by automated lane keeping systems (UNECE Citation2021). In the same year, ISO published Technical Report 4804 (ISO 4804 Citation2020), which describes steps for the development and validation of ADS based on fundamental safety principles derived from globally applicable publications.
A core principle of all of the guidelines and reports is that an automated system needs to be at least as safe as a human driver—often referred to as “positive risk balance.” However, all guidelines and reports address the question of how PoRiBa should be proven in practice in a general way. This is understandable from a political perspective because the target is set but the implementation is up to industry. However, this lack of guidance poses the risk that different approaches will be taken, that comparisons will be made differently, and/or that results will not be comparable or even misleading. This article proposes a comprehensive framework to consider and assess PoRiBa for AD.
PoRiBa framework
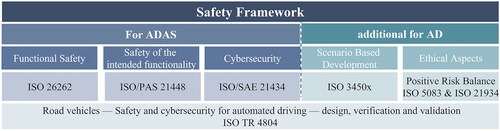
Before the PoRiBa framework is defined, a broader view on the safety framework for advance driver assistance systems (ADAS) and AD systems needs to be taken. Several safety standards in the domains of functional safety (ISO 26262), safety of the intended functionality (ISO 21448), and cybersecurity (ISO 21434) exist. These standards are successfully applied for today’s ADAS. In addition to the scenario-based development that is currently defined in ISO 3450x (e.g., ISO 34502), the ethical aspect of PoRiBa comes into play for AD systems with paradigm changes toward a (temporarily) non-human-controlled vehicle as an additional aspect. All of these above mentioned standards should be adhered to in the overall safety framework (see ).
Figure 1. Overall safety framework for ADAS and AD systems.
A two-step approach was taken for the definition of the PoRiBa framework. First, the requirements of the framework were defined by means of a detailed analysis of the German ethics committee report (Di Fabio et al. Citation2017). The main resulting requirements for the framework were as follows:
to provide transparent information about new technologies and their use,
to handle the many unknown factors in the approval process of ADS,
to combine quantitative and qualitative methods,
not to include aspects regarding the monetary cost.
In the second step, a review of existing safety frameworks in other transport domains, such as aviation (International Civil Aviation Organization Citation2018) and railway transportation (e.g., European Standards 2018), were conducted. In both domains, there are established frameworks that are accepted by regulatory authorities. These abovementioned frameworks were compared to the requirements. However, many of these frameworks were not applicable for the AD case in the automobile industry. For example, some frameworks are only applicable in their defined context and therefore cannot be applied to this process, such as TRStrab Brandschutz (Citation2014) in the area of structural fire protection in traffic facilities and European Standards (2019) for medical devices. Other frameworks show deficiencies in transparency in decision making (U.S. Food and Drug Administration Citation2018) or consider the monetary cost of incidents in risk analysis (e.g., European Standards 2019).
A good match between the requirements for the AD case and those for the approval of pharmaceuticals in Europe was identified. Both deal with a limited amount of data prior to the approval process. The duty of the industry to inform stakeholders about favorable and unfavorable effects of a pharmaceutical product match the challenges of PoRiBa. Therefore, approaches in the pharma sector were investigated further, specifically a research project funded by the European Medicines Agency (EMA). Based on exemplary initial approval and subsequent withdrawal of approval of drugs, a systematic procedure for the creation and maintenance of a risk balance sheet was developed (EMA Citation2012). Using the initial letters of the individual process steps, this approach was referred to as PrOACT-URL (Problems, Objectives, Alternatives, Consequences, Trade-offs, Uncertainty, Risk attitudes, and Linked decisions; EMA Citation2022). In further developments, the PrOACT-URL framework was adapted to the requirements of the automotive industry. The PrOACT-URL framework serves as the structure to document the PoRiBa process. It must be noted that only the steps from Problems to Uncertainty concern the industry, whereas the last two aspects concern the regulatory body. This article covers only the industry-relevant aspects.
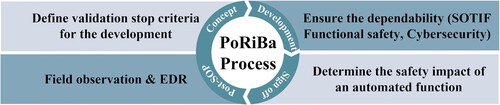
According to Kauffmann et al. (Citation2022), PoRiBa should not be understood as a single value to be calculated at the end of development. Rather, PoRiBa needs to be seen as a guiding ethical principle thought the entire AD development process from the concept phase to the release in the post–start of production phase (see ). Otherwise, it cannot be ensured that the final product will achieve a positive risk balance. Thus, the principle of PoRiBa needs to be considered early in AD development and needs to be check throughout the entire development process as well as after its introduction in the market. In the following, the PoRiBa steps for the different AD development stages are described and discussed.
Figure 2. Overview about the PoRiBa process at different development stages (Kauffmann et al. Citation2022).
Concept phase
Methods
The concept phase covers the step of describing the general problem. In this case, a new AD system should be introduced into the market that reduces the number of collisions.
For this purpose, several aspects need to be defined. First, a comprehensive description of the operational design domain (ODD) of the AD is required. The ODD description is required to appropriately identify the baseline for PoRiBa; that is, the safety performance (reciprocal of accident risk) of a human driver (SPHD). The safety performance of the human drivers needs to be compared later to the safety performance of the AD (SPAD). PoRiBA is achieved if EquationEq. (1)(1)
(1) applies:
(1)
(1)
The safety performance needs to be expressed as a certain metric. Different options are feasible here. We propose using the average distance (d) or time (t) between 2 collisions as a safety metric. In general, the safety performance can be calculated for a related distance metric as
(2)
(2)
where m denotes the annual mileage and
refers to the annual number of crashes (with different severities). Other metrics, such as crashes per hour (crash rates), can be derived accordingly.
Two additional aspects need to be considered for the safety performance:
A fair comparison between the safety performance of a human driver and AD should be ensured. This means that for the baseline case, which accidents should be included and which should not needs to be carefully considered. Just focusing on the ODD of the AD is not sufficient, because the AD also affects accidents outside its ODD. For instance, an AD system that does not perform any lane changes affects lane change collisions simply by the absence of this maneuver. To cover this wider view on accidents addressed by the AD, the term function field of application (FFoA) has been introduced (Kauffmann et al. Citation2022).
The development of AD is associated with different uncertainties and assumptions. Therefore, achieving only the determined safety performance value results in a high risk of failure of the final product. Instead, additional factor(s) should be considered to ensure that the PoRiBa target is met; that is, a significant improvement in the safety performance with AD.
Results for an exemplary AD system
To demonstrate the process, an exemplary SAE level 3 AD system was chosen that was designed to operate passenger cars on motorways up to a speed of 130 km/h. The system cannot perform lane changes automatically and the minimum risk maneuver is executed by a constant deceleration with 2 m/s2 up to standstill within the current lane. It should be noted that this is an exemplary AD. In this article, this very general description serves as the description of the ODD, though for a real AD the description would be more detailed. Furthermore, all calculations were done for the case of Germany; for other countries, the situation will be different. However, the principle of calculation should apply for them as well.
Evaluating the national accident statistics—in this example, Destatis (Citation2021)—revealed the collision occurrence for different vehicle types. Because the focus is on passenger vehicles on motorways, the analysis is limited to collisions involving at least 1 passenger car on a motorway. To reduce the complexity in this example, the question of who is at fault is neglected in identifying relevant collisions. Although the speed of the AD is limited to 130 km/h, all crashes on the motorway are considered when describing the FFoA, because the safety effect due to the technically limited speed need to accounted for as well. Hence, collisions which happen for the human driver outside of the AD's speed range are affected also by the technology. According to the FFoA definition, these crashes should be considered for the baseline as well. Furthermore, for the calculation of the safety performance, the miles driven is required. The miles driven needs to be extrapolated by means of assumptions, because the last detailed analysis in Germany was conducted in 2014 (Bundesanstalt für Straßenwesen Citation2014). Accident statistics and miles driven for years 2015 to 2019 are provided in .
Table 1. Accident statistics and miles driven on German motorways from 2015 to 2019 and the resulting safety performance of human drivers per year (Bundesanstalt für Straßenwesen Citation2014; Destatis Citation2021).
In , the required safety performance per year is calculated for 2 types of injuries. According to the definition by Destatis (Citation2021), “slight injuries” covers all types of injuries, whereas “serious injuries” covers traffic participants who are hospitalized within 24 h after a crash. The individual safety performances per year need to be combined to one to define a requirement for the development. In this case, it is done by taking the average. The deviation in results between years is also an important factor when deriving the development criteria, which aims at a significant improvement in safety performance (see item 2 above). In this case, the significant improvement is represented by achieving a safety performance that is 2 times the standard derivation higher than the calculated one; see EquationEq. (3)(3)
(3) :
(3)
(3)
The author of this article recommend to consider an additional safety factor to account for uncertainties in the development tools and used data. It should be noted that today’s crash statistics also include the effectiveness of today’s ADAS and infrastructures measures, although we referred to it above as “human drivers’ safety performance.”
Development phase
Methods
The development phase covers the design of the AD system according to PoRiBa. For this purpose, the derived development criteria are used and distributed among a list of all scenarios the AD encounters in its ODD. This leads to driving scenario individual criteria for the safety performance, like for instance in a lane change scenario the AD shall not have more than X crashes per driving hour. These criteria need to be maintained by the AD to achieve PoRiBa. During development, compliance with criteria is regularly checked by means of a combination of Bayesian networks and Monte Carlo simulation. More details on this approach can be found in Werling et al. (Citation2021). The analysis in this step is also supported by other tests in the real world; that is, on test tracks or public roads. Within the PrOACT-URL framework, the development phase contributes to 2 aspects: Objectives and Alternatives.
Results for an exemplary AD system
The results in this stage include a set of requirements that define the required performance of the AD per scenario. The performance results from the expected occurrence frequency in the field and the technical performance the AD needs to achieve in the scenario (the AD should not fail once in X tests). During development, the performance of the AD system is regularly checked against this requirement. This is done via applying different test tools, such as test track tests and simulations. At a later stage in the development, tests on public roads are also conducted.
Sign-off phase
Methods
After development, the sign-off phase begins. Regarding the PoRiBa process, the focus in this phase is on validating and confirming the AD’s PoRiBa with respect to the results of the previous step. This includes 2 tasks. The first is verification of the defined requirements, for which different test tools are applied. A major focus here is on test tracks tests and later tests on public roads, by which it is proven that the requirements to achieve PoRiBa are achieved.
The second step is to assess the safety performance of the AD system in a prospective manner. Due to the lack of real-world crash data with AD systems, this step relies on virtual simulation tools. This process, which is based on ISO 21934, (Citation2021) “Prospective Safety Performance Assessment of Pre-Crash Technology by Virtual Simulation” and the work of the P.E.A.R.S. Consortium (Citation2021) covers the following aspects of the PrOACT-URL framework:
Consequences: Compare the baseline (without the AD system) with the treatment (with the AD system) condition in different scenarios. The AD system’s behavior in traffic is also analyzed. Direct effects (avoidance of collisions) as well as indirect effects (change in the driving scenario frequency) are considered.
Trade-offs: Combing the individual results of the earlier assessment and scaling up the results to provide the resulting risk balance.
Uncertainty: Because every prospective assessment must deal with uncertainties, transparent reporting is imperative.
Results for an exemplary AD system
The focus here is on the prospective safety assessment of an exemplary AD by virtual simulation. To demonstrate the assessment, a small simulation study according to the method defined in ISO 21934 was conducted. We used a traffic-based Monte Carlo approach as described by Helmer (Citation2014). The considered AD system is an SAE level 3 system. The AD’s control logic is similar to the one assessed in the L3Pilot project (Bjorvatn et al. Citation2021). As described above, the minimum risk maneuver (MRM) of the AD is designed as braking at approximately 2 m/s2 until either the driver takes over or the ego vehicle is stopped. During the MRM, the ego–vehicle (i.e., vehicle under test that is equipped with AD) does not perform any lane changes. The MRM is simulated for 2 scenarios. In the first scenario, no driver takeover is considered. This represents rather a worst-case scenario. The second situation considers driver takeover. In the simulation, driver takeover is performed by a switch from the AD control to the driver behavior model used. The time after activation of the MRM at which the takeover occurs is varied by sampling from a gamma distribution (see Bjorvatn et al. Citation2021). In a final study, the distribution should be derived based on experiments or considering multiple literature sources (e.g., Gold et al. Citation2013). Furthermore, it must be noted that the MRM is only activated when the driver does not react in time to the AD’s takeover request. Simulations can focus on the MRM, because from the takeover request up to the start of the MRM the AD will continue operation. This should also be considered when deriving the distribution of the reaction time to the MRM.
The simulations were conducted using open-source simulation software openPASS (Citation2023). The simulation covered conflict-related driving scenarios (short sequences with a predefined conflict types) as well as traffic scenarios (longer simulation without predefined conflict types but with predefined traffic densities). The first type of simulation investigates the change in the crash rate (see Table S1, online supplement), and the second type investigates the changes in the frequency of certain scenarios (see Table S2, online supplement). A safety-oriented ADAS has an effect only on the outcome of the scenario (i.e., crash rate and consequence), because it is only active for a short period of time. AD systems, however, due to the continuous control of the vehicle, affect the outcome within a driving scenario and the frequency with which driving scenarios are encountered. Therefore, both effects (scenario outcome and frequency) need to be considered. If an AD encounters a certain scenario less often but with a similar collision risk as a human driver, the number of collisions will be reduced.
For most of the analyzed scenarios, a clear reduction in accident risk was determined (see Table S1, online supplement). This applies in particular to the longitudinal conflict scenarios that reveal a high reduction in collision risk, such as rear-end conflicts and cutout scenarios. For these 2 scenarios, in which an object suddenly enters the ego-vehicle’s lane (i.e., passive cut-in conflict and passing a motorway entrance), lower reductions in collision risk are detected. The reduction in these scenarios is −57.3% (cut-in) and −11.5% (passing motorway entrance). In the scenario in which a reduced speed limit is upcoming, a minor reduction in crash frequency is detected (−29.2%) as well. This results from the earlier and smoother braking strategy of AD systems. However, this speed limit scenario is not associated with a high collision risk in the real world. Therefore, the expected absolute benefits for this scenario are low. The safety effect detected in simulation of this scenario might even be related more to the general driving strategy of the AD system than to its behavior in the situation. Nevertheless, the scenario was included in the analysis to check for potential negative effects of the AD system.
However, for a few scenarios, an increase in crash risk was detected. Typically, these were scenarios in which the system reached its technical boundary (e.g., MRM without driver takeover), resulting in braking maneuvers. Because these braking maneuver are absent in the baseline without the system, the increase is not surprising. However, the frequency of these scenarios shall be due to technical countermeasure in the development (inter alia function safety, safety in use) in reality very low, i.e. the overall implication of the traffic safety is low. A common aspect in the other scenarios, for which either no effect of the AD or even a slightly higher collision rate with the AD system is detected, is the difference in speed between the ego vehicle and the conflicting traffic participant. These scenarios are “approach end of traffic jam” and “jaywalking pedestrian.” The safety performance of the AD system in these scenarios is defined by its sensor range, reaction time, and ability to predict the movement of other traffic participants. However, it should be noted that a reduction in accident severity was detected for the scenario with a jaywalking pedestrian.
Regarding the change in scenario frequency (see Table S2, online supplement) a reduction in rear-end and lane change conflicts was detected. On the other hand, the frequency of cut-in maneuvers increased, which can be explained by the driving strategy. An AD system will maintain the legal speed and distance from the vehicle in front. Slower driving results in fewer overtaking maneuvers, which is the primarily reason for lane changes on motorways, and the larger gap provides a longer reaction time. However, the larger gap could potentially trigger more vehicles to perform lane changes in front of the ego vehicle. We did not analyze whether the criticality of the cut-in maneuver was the same for the baseline and treatment scenarios. It is very likely that the scenario parameter distribution (speed, distance etc.) of the cut-in maneuvers would change with AD due to its changed driving style.
In the last steps, the results of both simulations were combined and weighted according to the occurrence of certain conflict types in the national accident statics. The analysis of the exemplary AD’s risk balance showed the expected reduction in crash occurrence of 31.8%. Thus, it can be presumed that the system will achieve PoRiBa.
Although the results are only presented for the overall occurrence of crashes, the analysis can be broken down by injury severity.
Post–start of production phase
Methods
In this phase, the AD system is fully developed and deployed to the market. The focus in this phase is on analyzing PoRiBa based on actual field data and validating the results of the previous steps. Therefore, comprehensive field monitoring of the AD equipped vehicles is required. Traditional approaches like accident investigation and research need to be accompanied by data loggers that record relevant driving scenarios, as described, for instance, by UNECE (Citation2021). Relevant scenarios can be any technical issue or safety-critical driving scenario (SCS). The recorded scenarios will be investigated regarding the performance of the AD system. They can also be used for further improvements of the system.
Because crashes are rare events, observing a stochastically sufficient number of crashes to analyze the risk balance will take quite some time, in particular for severe crashes. In the meantime, the logged SCS should be used as surrogate measure for assessing the safety performance. However, the relation between SCS and accidents is not fully known (Najm et al. Citation2006). Therefore, benefits derived for the SCS cannot necessarily be transferred to the benefits in terms of accident prevention. However, they provide an indication of to what extent PoRiBa has been achieved after market introduction.
Results for an exemplary AD system
The exemplary AD system needs to be capable of detecting relevant scenarios by means of its sensors. A catalogue of scenarios supports the identification of certain scenarios. Different approaches are feasible for detection of different scenarios. Different detection algorithms have been described in the context of field operation test or naturalistic driving study projects by, for example, Dingus et al. (Citation2006) and Benmimoun et al. (Citation2011). These studies have also shown the usefulness of video imaging to interpretate the given scenarios.
Despite SCS detection, the AD system should inform the manufacture when any crash is detected so the manufacture can perform a crash investigation. Crash data also need to be collected for non-AD vehicles to obtain a reasonable baseline for assessing PoRiBa.
Discussion
This article provides a methodological approach to addressing and proving PoRiBa for AD systems as required by regulatory authorities. The focus needs to be on different aspects at different stages of development. In this article, steps for each stage are described and explained by means of an exemplary AD.
This article presents a first step toward a common practice in the industry to consider and assess the expected and ethical benefits of AD systems. We are aware that the proposed PoRiBa approach needs to be updated based on future practical experiences to account for today’s limitations. These limitations are mainly due to the data and tools used in the process. One limiting factor is crash data to derive the safety performance of human drivers, where data differ by country. Detailed data are available for some countries, whereas for some they are not. A common challenge that limits the implementation of the PoRiBa approach is the level of detail provided. Most data sources report limited FFoA-relevant information (e.g., road type). Therefore, additional data sources need to be used to derive these details, such as whether a collision occurred in a traffic jam. This increases the uncertainty in the calculation. The access to such additional detailed data sources can be limited, which potentially limits the application of the presented approach.
Furthermore, the output of available development tools is associated with uncertainty. This needs to be considered when estimating the risks. Continuous optimization of development tools and processes will help to reduce uncertainties in the future. A special emphasis on virtual development tools is made, because their application is inevitable for the development and testing of AD systems due to the number and complexity of encountered scenarios. However, experience with them is limited, which cause uncertainty. Therefore, validation of these tool is an essential aspect that needs to be discussed further. In general, the uncertainties of the development tools are individual to companies and can hardly be standardized in the PoRiBa process.
Supplemental Material
Download Zip (13.9 KB)Conflicts of interest
The authors have no conflicts of interest to disclose.
Additional information
Funding
References
- Benmimoun M, Fahrenkrog F, Zlocki A, Eckstein L. 2011. Incident detection based on vehicle CAN-data within the large scale field operational test “euroFOT”. 22nd Enhanced Safety of Vehicles Conference, Washington, DC. https://www-esv.nhtsa.dot.gov/Proceedings/22/files/22ESV-000042.pdf.
- Bjorvatn A, Page Y, Fahrenkrog F, Weber H, Aittoniemi E, Bärgman J, Borrack M, Hermitte T, Heum P, Hiller J, et al. 2021. Impact evaluation results. L3Pilot Deliverable D7.4.
- Bonnefon J-F, Cerny D, Danaher J, Deviller N, Johansson V, Kovacikova T, Martens M, Mladenovic MN, Palade P, Reed N, et al. 2020. Ethics of Connected and Automated Vehicles: recommendations on road safety, privacy, fairness, explainability and responsibility. Horizon 2020 Commission Expert Group to advise on specific ethical issues raised by driverless mobility (E03659). Publication Office of the European Union: Luxembourg; [accessed 2023 Feb 5]. https://op.europa.eu/en/publication-detail/-/publication/89624e2c-f98c-11ea-b44f-01aa75ed71a1/language-en.
- Bundesanstalt für Straßenwesen. 2014. Ergebnisse Fahrleistungserhebung 2014; [accessed 2022 Jul 29]. https://www.bast.de/BASt_2017/DE/Verkehrssicherheit/Fachthemen/U2-fahrleistung-2014/u2-Fahrleistung-2014-ergebnisse.html.
- Destatis (Statistisches Bundesamt). 2021. Verkehr – Verkehrsunfälle 2019 (Fachserie 8 Reihe 7). Statistisches Bundesamt; [accessed 2023 Feb 5]. https://www.destatis.de/DE/Themen/Gesellschaft-Umwelt/Verkehrsunfaelle/Publikationen/Downloads-Verkehrsunfaelle/verkehrsunfaelle-jahr-2080700197004.pdf.
- Di Fabio U, Broy M, Brüngger R, Eichhorn U, Grunwald A, Heckmann D, Hilgendorf E, Kagermann H, Losinger A, Lutz-Bachmann M, et al. 2017. Ethic commission: automated and connected driving. Report of ethics commission appointed by the federal minister of transport and digital infrastructure; [accessed 2023 Feb 5]. https://www.bmvi.de/SharedDocs/EN/publications/report-ethics-commission.pdf?__blob=publicationFile.
- Dingus TA, Klauer SG, Neale VL, Petersen A, Lee SE, Sudweeks J, Perez MA, Hankey J, Ramsey D, Gupta S, et al. 2006. The 100-Car Naturalistic Driving Study, Phase II – results of the 100-Car Field Experiment. Virginia Tech Transportation Institute, Report No. DOT HS 810 593, https://www.nhtsa.gov/sites/nhtsa.dot.gov/files/100carmain.pdf.
- European Medicines Agency. 2012. Benefit-risk methodology project work package 3 report: field tests. London (UK): European Medicines Agency. Report no: EMA/718294/2011. August 31. http://www.ema.europa.eu/docs/en_GB/document_library/Report/2011/09/WC500112088.pdf.
- European Medicines Agency. 2022. PROACT-URL; [accessed 2022 Jul 29]. https://www.protectbenefitrisk.eu/PrOACT-URL.html.
- European Standards. 2018. Railway applications – the specification and demonstration of Reliability, Availability, Maintainability and Safety (RAMS) – part 1: generic RAMS process. DIN EN 50126-1:2018-10.
- European Standards. 2019. Medical devices – application of risk management to medical devices (ISO 14971:2019). DIN EN ISO 14971:2020-07.
- Gold C, Damböck D, Lorenz L, Bengler K. 2013. “Take over!” How long does it take to get the driver back into the loop?. Proc Hum Factors Ergon Soc Annu Meeting. 57(1):1938–1942. doi: 10.1177/1541931213571433.
- Helmer T. 2014. Development of a methodology for the evaluation of active safety using the example of preventive pedestrian protection [doctoral dissertation]. TU Berlin. https://depositonce.tu-berlin.de.https://depositonce.tu-berlin.de/bitstream/11303/4270/2/helmer_thomas.pdf.
- International Civil Aviation Organization. 2018. ICAO Safety Management Manual Doc 9859. 4th ed. Montréal (Canada): International Civil Aviation Organization. https://skybrary.aero/sites/default/files/bookshelf/5863.pdf
- ISO 4804. 2020. Road vehicles — Safety and cybersecurity for automated driving systems — Design, verification and validation. ISO Technical report 4804. https://www.iso.org/standard/80363.html. 2020.
- ISO 21934. 2021. Road vehicles — Prospective safety performance assessment of pre-crash technology by virtual simulation — Part 1: State-of-the-art and general method overview. ISO Standard 21934-1. https://www.iso.org/standard/76497.html.
- Kauffmann N, Fahrenkrog F, Drees L, Raisch F. 2022. Positive risk balance: a comprehensive framework to ensure vehicle safety. Ethics Inf Technol. 24(1), Article 15. 10.1007/s10676-022-09625-2.
- Kyriakidis M, Happee R, De Winter JCF. 2015. Public opinion on automated driving: results of an international questionnaire among 5000 respondents. Transp Res Part F: Traffic Psychol Behav. 32:127–140. 10.1016/j.trf.2015.04.014.
- Najm WG, Stearns MD, Howarth H, Koopmann J, Hitz J. 2006. Evaluation of an automotive rear-end collision avoidance system. U.S. Department of Transportation, Report No. DOT HS 810 569. https://www.nhtsa.gov/DOT/NHTSA/NRD/Multimedia/PDFs/Crash%20Avoidance/2006/HS910569.pdf.
- openPASS. 2023. openPASS Working Group; [accessed 2023 Feb 5]. https://openpass.eclipse.org/.
- Payre W, Cestac J, Delhomme P. 2014. Intention to use a fully automated car: attitudes and a priori acceptability. Transp Res Part F: Traffic Psychol Behav. 27(Part B):252–263. 10.1016/j.trf.2014.04.009.
- P.E.A.R.S. Consortium. 2021, February 24. Prospective effectiveness assessment for road safety – overview. UNECE VMAD Sub Group 2 Virtual Testing Meeting; [accessed 2023 Feb 5]. https://wiki.unece.org/download/attachments/123666581/VMAD-SG2-12-03%20PEARS%20Presentation.pdf?api=v2.
- SAE. 2021. Taxonomy and definitions for terms related to driving automation systems for on-road motor vehicles. SAE Document J3016_202104, Version 4, SAE International. https://doi.org/10.4271/J3016_202104, 2021.
- TRStrab Brandschutz (Technische Regeln von Straßenbahnen – Brandschutz in unterirdischen Betriebsanlagen). 2014. Version of 24.06.
- United Nations Economic Commission for Europe. 2021. Uniform provisions concerning the approval of vehicles with regard to automated lane keeping systems. UN Regulation No. 157 - Automated Lane Keeping Systems (ALKS). Geneva, Switzerland.
- U.S. Food and Drug Administration. 2018. Benefit-risk assessment in drug regulatory decision-making: draft PDUFA VI implementation plan (FY 2018-2022); [accessed 2023 Feb 5]. https://www.fda.gov/files/about%20fda/published/Benefit-Risk-Assessment-in-Drug-Regulatory-Decision-Making.pdf.
- Werling M, Drees L, Faller R, Betz W, Straub D. 2021. Quantitative safety integrity analysis for L3+ systems. Safetronic Conference 2021, Muinch Germany.
- Wood M, Knobel C, Garbacik N, Robbel P, Boymanns D, Smerza D, Maass M, Löhning M, Dalong L, Radboud D, et al. 2019. Safety first for automated driving. White paper of different car manufacturers and suppliers; [accessed 2023 Feb 5]. https://www.press.bmwgroup.com/global/article/attachment/T0298103EN/434404.