
 ?Mathematical formulae have been encoded as MathML and are displayed in this HTML version using MathJax in order to improve their display. Uncheck the box to turn MathJax off. This feature requires Javascript. Click on a formula to zoom.
Abstract
Objectives
Single vehicle (SV) run-off-road crashes are a major cause of severe injury and fatality. Such crashes can result in different levels of severity depending on the direction (i.e., left or right) in which the vehicle runs off the road. This paper investigated the factors contributing to the crash severities of right run-off-road (R-ROR) and left run-off-road (L-ROR) SV crashes.
Methods
The study used SV crash data from the City of Charlotte, North Carolina, covering 2014 to 2017. Two separate random parameter ordered logit (RPOL) models were developed to estimate the contributing factors to R-ROR and L-ROR SV crash severities. The impact of the explanatory variables on the crash severity outcomes was quantified using the models’ direct pseudo-elasticities.
Results
The model results showed that male drivers, Driving Under Influence (DUI), motorcycles, and dry road surfaces were significant contributing factors to R-ROR and L-ROR SV crash severities. Specifically for the R-ROR model, speeding, reckless driving, 1–2 lanes, and older drivers increased crash severity. For the L-ROR model, phone distraction, crossed centerline/median, 3–4 lanes, rain, and dark unlighted roadway increased crash severity.
Conclusions
Based on the estimated parameters for the common significant variables in the two models, it was inferred that L-ROR SV crashes are more likely to result in severe crashes compared to R-ROR SV crashes. Hence, this study contributes to the literature on ROR SV crashes by providing additional insight into contextual factors influencing ROR crash severity for more effective countermeasures.
Introduction
A typical run-off-road (ROR) crash involves a single vehicle (SV). This type of crash occurs when a vehicle in motion leaves the road, collides with a tree, pole, or other natural or artificial objects, or overturns on non-traversable terrain. In the United States, ROR crashes are a major cause of severe injuries and fatalities, especially among vehicle occupants (Dissanayake and Roy Citation2014). The Fatality Analysis and Reporting System (FARS) data from 2014–2019 showed that 37.8% of all vehicles involved in fatal crashes were single vehicles (FARS Citation2022) and ROR crashes contribute to 50% of all SV crashes (National Highway Traffic Safety Administration Citation2017).
Past studies have explored the association between contextual contributing factors and SV crash severity. More specifically, ROR SV crashes have been examined (Se et al. Citation2020; Roque et al. Citation2021). Some studies are broad in their approach by considering all types of SV ROR crashes (Kim et al. Citation2013; Hertach et al. Citation2018). Other researchers used crash location, pavement type, or road curvature as a benchmark to conduct similar studies (Gong and Fan Citation2017; Akbari et al. Citation2020). In the literature, speeding, distraction, poor visibility, driver fatigue, impairment due to alcohol or drugs, roadway surface condition, lighting condition, driver’s age, and motorcycle are the common factors that contribute significantly to the severity outcomes of ROR SV crashes. (Gong and Fan Citation2017; Akbari et al. Citation2020; Se et al. Citation2020; Roque et al. Citation2021).
Despite the previous research efforts in the study of ROR crashes, no known research has specifically examined the association of contextual contributing factors, and ROR crashes with respect to the direction in which the vehicle runs off the road. In a ROR SV crash, the vehicle would typically run off the road to the right or left of the roadway, and the run-off direction would depend on several factors that contribute to the severity outcome of the crash.
Therefore, this study examined the different factors associated with increasing severity outcomes of right ROR (R-ROR) and left ROR (L-ROR) SV crashes. We developed two random parameter ordered logit (RPOL) models for R-ROR and L-ROR. In conjunction with the model estimation, the average pseudo-elasticities were used to provide more insight into the impact of the incremental contributions of the explanatory variables on the severity outcomes.
Data and methodology
The study used 2014–2017 road traffic crash data for the City of Charlotte in North Carolina obtained from the Highway Safety Information System (HSIS). The dataset contained four files (occupant, vehicle, crash, and roadway files). It was merged using unique case and road segment numbers. For a detailed description of the linking process, readers are encouraged to refer to the HSIS City of Charlotte Guidebook. After merging the files for the four years, it was sorted to select SV crashes. The SV crashes were sorted to select only R-ROR and L-ROR crashes. The missing and unknown observations were omitted from the final modeling dataset, resulting in 4278 R-ROR and 2088 L-ROR SV crash observations. describes the distribution of crash severity for the R-ROR and L-ROR SV crashes. The proportions of crash severity for both cases are similar. As shown, the proportions of crash severity in both cases are similar. Only about 1% and over 55% of the crashes resulted in fatal and no injury, respectively.
Table 1. Crash severity distribution.
Tables A1 and A2 present the distribution of variables per crash severity for the R-ROR and L-ROR SV crashes, respectively. From the table, speeding contributes 5.1% to incapacitating and fatal injury for R-ROR SV crashes, and 2% for L-ROR SV crashes. Male drivers were involved in 73.9% of R-ROR SV fatal crashes and 100% R-ROR SV fatal crashes. In both cases, younger drivers (<20 years) were involved in more severe crashes compared to older drivers (70 years or above). In total, about 14% of the crashes involve young drivers (<20 years), and 2% involve older drivers (70 years or above) for both ROR SV crash types. The following driving conditions (i.e., failure to reduce speed, exceeded authorized speed limit, and exceeded safe speed for conditions) from the data were reclassified as speeding, as shown in Tables A1 and A2. The crash reporting officer uses information collected from the crash scene with their experienced discretion to determine the speeding condition of the driver at the time of the crash.
As reported in the crash records, reckless driving connotes a situation where the driver operated the vehicle in an erratic, reckless, careless, negligent, or aggressive manner. Inattention, as a crash contributing factor, is defined as the “mismatches between the driver’s current resource allocation and that demanded by activities critical for safe driving” (Engström and Monk Citation2013). Inattentive actions can be associated with distractions from inside or outside the vehicle. Any action that diverts the driver’s concentration from safety-critical activities can be considered inattention. The description of the variables included in the models is presented in Tables A1 and A2.
The random parameters ordered logit (RPOL) model was used in this study. RPOL can accommodate the increasing multiple-ordinal nature of the dependent variable and heterogeneity in observations by incorporating random coefficients. RPOL builds a relationship between a latent continuous function, that determines severity outcome and
discrete crash severity categories; where 0 = no injury, 1= possible injury, 2 = evident injury, 3 = incapacitating injury and 4 = fatal) through certain threshold values denoted as
The dependent variable in the RPOL is intrinsically ordered while allowing the coefficients
to vary across observations according to a logit distribution. The relationship between the model parameter and variables is expressed in EquationEq. (1)
(1)
(1) below.
(1)
(1)
where
Latent function associated with crash severity outcome
for any observation
Vector of explanatory variables
Vector of random coefficients
Distributed random error term
Normal distribution was assumed for the random parameter to decompose the coefficient’s magnitude into a fixed term known as the mean and a random term imposed by the standard deviation. The probability outcome of an individual observation being in crash severity
conditioned on
can be expressed as shown in EquationEq. (2)
(2)
(2) according to Kim et al. (Citation2010).
(2)
(2)
Considering that the error term is identical and independently distributed, the probability of individual
being in crash severity
unconditioned on
will be defined according to Kim et al. (Citation2010), as shown in EquationEq. (3)
(3)
(3) .
(3)
(3)
where
is the vector of uncorrelated random variables belonging to a selected distribution,
is the set of possible crash severity outcomes and
is the joint probability density function of
In logit models, estimated parameters are insufficient to explain the impact of explanatory variables on the probability of a crash severity category (Kim et al. Citation2013). Therefore, direct pseudo-elasticity was used to estimate the effect of explanatory variables on the likelihood of severity outcomes. Based on Ulfarsson and Mannering (Citation2004), the direct pseudo-elasticity representing the percentage change in the probability of an outcome when the value of a dummy variable changes from zero to one is given by EquationEq. (4)(4)
(4) .
(4)
(4)
where
is the
th indicator variable from observation
and
is the probability of observation
having severity
The average pseudo-elasticity is commonly calculated by taking the average pseudo-elasticities estimated for all observations.
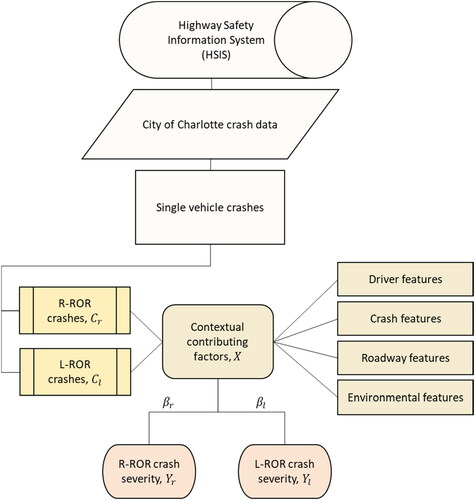
The model parameters were estimated by stimulating their maximum likelihood following the Halton sequences (or Halton draws). This approach has been shown to generate accurate probability approximations with fewer draws than purely random draws (Bhat Citation2003; Train Citation2003). The random parameter was estimated using 200 Halton draws based on Bhat (Citation2003) recommendation. shows the conceptual framework for the modeling. From the figure, and
represent the explanatory variable coefficients for the R-ROR and L-ROR SV crash models, respectively.
Figure 1. Conceptual framework for the R-ROR and L-ROR SV crash severity models.
Log-likelihood ratio test was performed using EquationEq. (5)(5)
(5) to justify the estimation of different models for R-ROR and L-ROR SV crashes (Washington et al. Citation2020). The test statistics likelihood ratio (LR) was calculated as follows:
(5)
(5)
where
and
are the log-likelihood at convergence estimated with all the data, R-ROR data, and L-ROR data, respectively.
Results
During model estimation, only variables with their t-statistics corresponding to a 90% confidence interval or above on a two-tailed t-test were included in the specification. For a variable to be recognized in the model as a random parameter, its standard deviation must be significant at a minimum of 90% confidence interval (Behnood and Mannering Citation2017). Therefore, by convention, once the standard deviation of a variable is significant in the model, it is regarded as a random parameter (Islam et al. Citation2014). The estimation results for the two models are presented in Tables A3 and A4. In total, 18 variables were found to influence the crash severity outcomes of R-ROR SV crashes, and 14 variables were found to influence the crash severity outcomes of L-ROR SV crashes. The average pseudo-elasticities results are presented in Table A4.
R-ROR single vehicle crashes
Seven parameter estimates were significant as random parameters, including driver age (70 years or above), driver gender (male), no traffic control, speeding, inattention, improper turn, and DUI. The standard deviations of the random parameters are significant at a minimum of 90% confidence interval. The normal distribution gave the best fit for the random parameters among other distributions like log-normal, Poisson, etc. The improper turn variable was random, with a mean of −3.58 and a standard deviation of 2.731. These values indicate that for 90.5% of improper turn-related crashes, the probability of increasing crash severity is low. The elasticity shows that crashes involving improper turn are 80.8% more likely to result in no injury severity. For 72.7% of older driver-related crashes, the probability of increasing crash severity is high, and such crashes are 57.7% more likely to be fatal. For 86.8% of inattention-related crashes, the likelihood of increasing crash severity is high. However, such crashes are 33.9% less likely to be fatal.
L-ROR single-vehicle crashes
Four parameter estimates were found to be significant as random parameters, which include driver age (< 20 years), driver gender (male), traffic control (stop and go), and DUI. The driver age (< 20 years) variable was random, with a mean of −0.609 and a standard deviation of 1.788. This means that the probability of increasing crash severity is low for 36.7% of crashes involving drivers of age 20 years or less. The elasticity shows that the resulting crash severity from younger drivers is 25.3% more likely to be fatal. The male driver parameter had a mean of −0.39 and a standard deviation of 1.403. This implies that for 60.9% of the crashes involving male drivers, the probability of increasing crash severity is high. However, such crashes are 38% less likely to be fatal. The elasticities showed that phone distraction and crossing the centerline/median increased the likelihood of a fatal crash severity outcome by 179.4% and 126.1%, respectively.
Discussion
The research presented in this paper focused on analyzing ROR single vehicle crashes where the vehicle runs off either to the right or the left of the roadway. The study used four-year (2014–2017) crash data collected for the City of Charlotte, North Carolina. Two random parameter ordered logit was developed: one for the R-ROR SV crashes and the other for L-ROR SV crashes. Four variables (male drivers, DUI, motorcycle, and dry road surface) were significant in the two model results. DUI, motorcycle, and dry road surface increased the likelihood of severe crashes and were consistent with previous studies (Liu and Ye Citation2011; Dissanayake and Roy Citation2014). Typically, drivers are more likely to travel at higher speeds on dry road surfaces, which is associated with severe crash outcomes (Liu and Ye Citation2011). Speeding can limit the driver’s ability to correct their action leading to a crash. The results also show that crashes on a dry road surface are twice more likely to be fatal if the vehicle runs off the road to the left compared to the right. Motorcycle-related crashes are overwhelmingly more likely to result in fatal crash outcomes. Motorcyclists are more susceptible to severe injury given their increased difference in bodily exposure (like lack of protection from vehicle frame, restraint, and in some instances, helmets) compared to motorists.
Specifically for R-ROR SV crashes, reckless driving, speeding, 1–2 lanes, and driver age (70 years or more) significantly increased the probability of severe crashes. R-ROR crashes that occur on 1–2 lanes are less likely to be fatal. For instance, in a two-lane roadway, a driver running off the road could be influenced by an attempt to overtake another vehicle. Suppose the driver cannot complete the action because of an oncoming vehicle; there is a possibility of running off the road to the right to avoid colliding with the opposing traffic. Also, since the driver’s view of opposing traffic is limited in a two-lane undivided roadway, overtaking could be risky regardless of the traffic condition.
Interestingly, it was found that R-ROR SV crashes associated with inattention are less likely to be severe, which contradicts previous findings where inattention has been identified as a primary contributor to severe crash outcomes (Sundfør et al. Citation2019). Inattention could include eating, smoking, listening to music, and responding to internal or external distractions. Some of them could have more impact on crash severity outcomes than others. However, this analysis data used the term ‘inattention’ generically, making it difficult to understand its inherent characteristics.
Uniquely for L-ROR SV crashes, phone distraction, crossing the centerline/median, 3–4 lanes, rain, and dark unlighted roadway significantly increased the likelihood of severe crashes. Seatbelts, stop and go sign, and driver’s age (<20 years) decreased the possibility of severe crashes. Compared with other studies, these findings are consistent (Se et al. Citation2020). In a similar study, seatbelt use was found to significantly decrease the probability of higher severity outcomes (Al-Bdairi and Hernandez Citation2020). Being distracted by the phone and crossing the centerline/median increased the likelihood of a fatal crash outcome. In context, a driver is likely to cross the centerline/median when distracted especially on a two-lane undivided roadway. This could explain the exceeding effect of the two variables on higher severity outcomes.
This study identifies the factors associated with R-ROR and L-ROR single-vehicle crashes. It shows that similar and different factors contribute to the severity of run-off-road crashes depending on whether the vehicle runs off to the right or the left of the travel lane. Aside from DUI, other common significant variables (motorcycle, male driver, and dry road surface) have higher positive coefficients in the L-ROR model compared to the R-ROR model. Based on these common significant variables in the two models, it could be inferred that L-ROR SV crashes are more likely to result in severe outcomes than R-ROR SV crashes. For countermeasures targeted at preventing ROR crashes for a particular side of the roadway, this study provided some insight into the factors that should be considered.
It should be noted that the study data, like most crash data, is usually underreported (Salifu and Ackaah Citation2012; Kayani et al. Citation2014; Watson et al. Citation2015), especially the no-injury crashes. The information collected at the crash scene is usually limited to the requirements on a standard crash reporting form. As such, the reporting officer would rely on personal experience, driver’s and eyewitness accounts to determine the causal factors in a crash. However, the accuracy of some of the information would depend on the sincerity of the corresponding parties. For instance, the driver might hesitate to inform the police officer of being distracted or over-speeding. In this case, the officer would have to rely mostly on personal judgment for completing the crash form. Also, traffic volume, a valuable factor in crash severity analysis, was unavailable for this study and should be explored in a future study.
These data limitations usually result in unobserved heterogeneity, which could affect the quality of model estimations. In the absence of any other source of crash information, safety analysts rely on police-reported crash records and apply statistical methods that account for unobserved heterogeneity. For this reason, this study adopted random parameters ordered logit model, which has been shown to provide a better fit for crash data. Despite the associated data and method limitations, the findings are consistent with most past studies and provide data-driven evidence for developing and implementing appropriate countermeasures.
Supplemental Material
Download Zip (69.6 KB)Disclosure statement
The authors report no conflict of interest.
Data availability statement
The study data and finding models are available from the corresponding author upon reasonable request.
Additional information
Funding
References
- Akbari M, Shafabakhsh G, Ahadi MR. 2020. Single-vehicle run-off-road crash prediction model associated with pavement characteristics. Int J Eng. 33(7):1375–1386. doi:10.5829/ije.2020.33.07a.25.
- Al-Bdairi NSS, Hernandez S. 2020. Comparison of contributing factors for injury severity of large truck drivers in run-off-road crashes on rural and urban roadways: accounting for unobserved heterogeneity. Int J Transp Sci Technol. 9(2):116–127. doi:10.1016/J.IJTST.2020.01.004.
- Behnood A, Mannering F. 2017. The effect of passengers on driver-injury severities in single-vehicle crashes: a random parameters heterogeneity-in-means approach. Anal Methods Accid Res. 14:41–53. doi:10.1016/J.AMAR.2017.04.001.
- Bhat CR. 2003. Simulation estimation of mixed discrete choice models using randomized and scrambled Halton sequences. Transport Res B: Methodol. 37(9):837–855. doi:10.1016/S0191-2615(02)00090-5.
- Dissanayake S, Roy U. 2014. Crash severity analysis of single vehicle run-off-road crashes. J Transp Technol. 04(01):1–10. doi:10.4236/jtts.2014.41001.
- Engström J, Monk CA. 2013. A conceptual framework and taxonomy for understanding and categorizing driver inattention.
- FARS. 2022. Fatality analysis reporting system. Accessed February 17, 2022. https://www.nhtsa.gov/research-data/fatality-analysis-reporting-system-fars.
- Gong L, Fan W. 2017. Modeling single-vehicle run-off-road crash severity in rural areas: accounting for unobserved heterogeneity and age difference. Accid Anal Prev. 101:124–134. doi:10.1016/j.aap.2017.02.014.
- Hertach P, Uhr A, Niemann S, Cavegn M. 2018. Characteristics of single-vehicle crashes with e-bikes in Switzerland. Accid Anal Prev. 117:232–238. doi:10.1016/j.aap.2018.04.021.
- Islam S, Jones SL, Dye D. 2014. Comprehensive analysis of single- and multi-vehicle large truck at-fault crashes on rural and urban roadways in Alabama. Accid Anal Prev. 67:148–158. doi:10.1016/j.aap.2014.02.014.
- Kayani A, Judy JJ, Mark MJ. 2014. Underreporting of road crashes in Pakistan and the role of fate. Traffic Inj Prev. 15(1):34–39. doi:10.1080/15389588.2013.793797.
- Kim JK, Ulfarsson GF, Kim S, Shankar VN. 2013. Driver-injury severity in single-vehicle crashes in California: a mixed logit analysis of heterogeneity due to age and gender. Accid Anal Prev. 50:1073–1081. doi:10.1016/j.aap.2012.08.011.
- Kim JK, Ulfarsson GF, Shankar VN, Mannering FL. 2010. A note on modeling pedestrian-injury severity in motor-vehicle crashes with the mixed logit model. Accid Anal Prev. 42(6):1751–1758. doi:10.1016/j.aap.2010.04.016.
- Liu C, Ye TJ. 2011. Run-off-road crashes: an on-scene perspective. https://crashstats.nhtsa.dot.gov/Api/Public/Publication/811500.
- National Highway Traffic Safety Administration. 2017. NCSA data resource website fatality analysis reporting system (FARS). Encyclopedia. National Center for Statistics and Analysis (NCSA) Motor Vehicle Traffic Crash Data. US Department of Transportation. Accessed November 20, 2017.
- Roque C, Jalayer M, Hasan AS. 2021. Investigation of injury severities in single-vehicle crashes in North Carolina using mixed logit models. J Safety Res. 77:161–169. doi:10.1016/j.jsr.2021.02.013.
- Salifu M, Ackaah W. 2012. Under-reporting of road traffic crash data in Ghana. Int J Inj Contr Saf Promot. 19(4):331–339. doi:10.1080/17457300.2011.628752.
- Se C, Champahom T, Jomnonkwao S, Ratanavaraha V. 2020. Risk factors affecting driver severity of single-vehicle run off road crash for Thailand highway. EJ. 24(5):207–216. doi:10.4186/ej.2020.24.5.207.
- Sundfør HB, Sagberg F, Høye A. 2019. Inattention and distraction in fatal road crashes – results from in-depth crash investigations in Norway. Accid Anal Prev. 125:152–157. doi:10.1016/J.AAP.2019.02.004.
- Train K. 2003. Discrete choice methods with simulation. Cambridge: Cambridge University Press. Accessed February 22, 2022. https://www.researchgate.net/profile/Kenneth_Train/publication/5206179_Discrete_Choice_Method_With_Simulation/links/560f62e408ae48337517b980/Discrete-Choice-Method-With-Simulation.pdf.
- Ulfarsson GF, Mannering FL. 2004. Differences in male and female injury severities in sport-utility vehicle, minivan, pickup and passenger car accidents. Accid Anal Prev. 36(2):135–147. doi:10.1016/S0001-4575(02)00135-5.
- Washington S, Karlaftis M, Mannering F, Anastasopoulos P. 2020. Statistical and econometric methods for transportation data analysis. New York: Chapman and Hall/CRC. doi:10.1201/9780429244018
- Watson A, Watson B, Vallmuur K. 2015. Estimating under-reporting of road crash injuries to police using multiple linked data collections. Accid Anal Prev. 83:18–25. doi:10.1016/j.aap.2015.06.011.