
 ?Mathematical formulae have been encoded as MathML and are displayed in this HTML version using MathJax in order to improve their display. Uncheck the box to turn MathJax off. This feature requires Javascript. Click on a formula to zoom.
Abstract
Objective
This paper estimates the latest trends regarding the effect of sex on driver-side or right-front passenger-side occupant fatalities in fatal crashes. The focus is on how recent model year (MY) light vehicles with advanced occupant protection technologies compare to older vehicles without these protections in terms of female fatality risk relative to males.
Methods
Data from the Fatality Analysis Reporting System (FARS) from 1975 to 2019 is used to calculate estimates of female fatality risk relative to males using logistic regression models and the double-pair comparison method. These estimates are calculated in various groups of MY vehicles and occupant protection systems. Occupant protection systems observed are the use of seat belts, and the availability of dual air bags, pretensioners and load limiters in the vehicles. All vehicles used include occupants age 16 to 96. Occupants studied include front-row occupants (drivers and right-front (RF) passengers). The average between drivers and RF passengers is also calculated.
Results
Incremental female fatality risk estimates versus males are reduced in newer MY vehicles. Incremental relative risks for female front-row occupants (average of drivers and right-front passengers) are found to be 19.9% (± 1.3) in fatal crashes in MY 1960–1999 vehicles, and 9.4% (± 2.2) percent in MY 2000–2020 vehicles. The difference in fatality risk between females and males is further reduced when looking at MY 2010–2020 vehicles (6.3 ± 5.4%) compared to MY 1960–2009 vehicles (18.3 ± 1.2%). Incremental fatality risk estimates also decrease in vehicles with newer generations of occupant protection systems regardless of MY. When occupants are belted in vehicles with the latest generation of modern occupant protection systems (dual air bags, seat belt pretensioners and load limiters), the estimated female fatality risk relative to males (average of drivers and right-front passengers) becomes 5.8% (± 3.8), which is lower than for belted occupants in vehicles without those occupant protections.
Conclusions
The disparity in fatality risk between males and females for the same physical impacts is reduced for later MY vehicles, as well as vehicles with more advanced occupant protection systems.
Introduction
The disparity in fatality risk between females and males given similar physical impacts in motor vehicle crashes is an ongoing area of investigation. With each new year’s motor vehicle fatality case data, it is possible to complete an expanded assessment of how newer vehicles with more advanced occupant protection technologies advanced affect this disparity. This study will add to the literature of sex disparities in crash fatality risk by analyzing the most recent data available on U.S. fatal crashes, which will allow the most recent MY vehicles to be assessed in terms of their disparity in fatality risk between males and females.
Parsing out how fatality risk in similar crashes differs between males and females requires careful consideration of confounding factors that could obscure the casual sex effect. The number of male fatalities is consistently higher than that of females on traffic roadways. Analysis of data from FARS indicates that since 1975, more than twice as many male occupants have died in vehicles as female occupants. However, males are more likely to perform risky driving behaviors, such as speeding, not using seat belts, and driving while impaired by alcohol or drugs (Lipari et al. Citation2016; AAA Foundation for Traffic Safety Citation2017, Citation2018, Citation2019, Citation2020; Perez et al. Citation2021). These factors increase both the likelihood of crashing while driving (Dingus et al. Citation2016) and the likelihood of serious injuries and fatalities in crashes (Liu and Subramanian Citation2020). Females are significantly more likely to suffer serious injuries in crashes after controlling for these factors (Liu and Subramanian Citation2020) or controlling for a crash severity marker such as delta V (Forman et al. Citation2019).
Researchers have developed analytic methods to control for crash severity in order to determine disparity in fatality risk between two groups in fatal crashes given similar severities. Evans (Citation1986) originally developed the double pair comparison method to investigate the impact of seat belt use on fatality risk. Double pair comparison can be used to compare event rates between two groups of vehicles. In each group, the event rate is the ratio of events in one group to another group (i.e., driver to passenger or passenger to driver). The second group is used as a control for the crash severity. Several studies have used this method (Evans Citation1988, Citation2001; Kahane Citation2013a, Citation2013b; Abrams and Bass Citation2021) to compare one group to another.
The current paper continues the investigation in trends of relative female fatality risk by MY and occupant protection type. Kahane used 1975 to 2010 FARS data to investigate, among other things, how relative female fatality risk changed with later model years, or when occupants wore seat belts, and drove in vehicles equipped with dual air bags and seat belts with pretensioners and load limiters. Although Kahane (Citation2013a) found a decreasing trend in female relative fatality risk by model year, the additional new vehicles found in the nine years’ worth of FARS data since the publication of that study warrants a new study to see if those trends continued, stopped, or reversed. Stopping at 2005–2011 MY vehicles, Kahane found that there was a 6.9% fatality risk disparity between males and females for drivers and 10.7% for right front (RF) passengers. Adding more crash years provides more data that will make these estimates of relative risk more robust than those from Kahane’s study. Additionally, given that the latest case years have a higher percentage of newer vehicles equipped with dual air bags, pretensioners, and load limiters, as well as higher seat belt use rates, an analysis of 2012–2020 MY vehicles may reveal a further narrowing of the gap between females and males in terms of fatality risk. This study investigates that possibility.
The methods section describes the data and statistical techniques used to estimate the fatality relative risk. The results section describes female fatality risk relative to males by both MY and occupant protection types. The discussion section describes the conclusions and limitations of the study. Greater details of the methodology can be found in the NHTSA technical report (Noh et al. Citation2022).
Methods
FARS data
This study uses FARS data from 1975 to 2019. FARS is a census of all fatal crashes that occur within the United States and Puerto Rico on public traffic ways each year. A motor vehicle traffic crash is included in FARS if it directly resulted in a fatality of a vehicle occupant or nonoccupant within 30 days of the crash. After receiving information on each fatal crash from State agencies, analysts code many elements at the crash, vehicle, and person (in FARS generally a person is any occupant or non-occupant involved in a fatal crash) level for each crash and store them in data files. See National Center for Statistics and Analysis (Citation2021) for more details.
Estimation of relative female fatality risk
The “relative female fatality risk to males” refers to the difference in fatality risk estimated for females relative to males seated in the driver and RF passenger positions of vehicles involved in fatal crashes. Further, the term “similar physical impacts” refers to comparable crashes where there was a high likelihood that the crash forces experienced by drivers and RF passengers were similar.
Similar to Kahane (Citation2013a, Citation2013b), two steps are used to estimate the female relative fatality risk. First, a model is developed to predict the probability of a fatality for a driver or RF passenger given the age and sex of the driver and RF passenger. Second, the double-pair comparison (Evans Citation1986, Citation2001) is used to apply the probability predictions of the model to a representative sample of fatal crashes to estimate the relative fatality risk for females compared to males from similar physical impacts.
Evans (Citation1986, Citation2001) developed the double pair comparison method in order to analyze fatality risk during fatal crashes for one group compared to another while controlling for the crash’s severity. For example, when calculating the risk of fatality for drivers, the death or survival of the RF passenger is used as a control for the crash severity (the higher number of deaths for the RF passenger, the more severe the crash tends to be).
While Evans (Citation1986, Citation2001) used total counts of fatalities within different age groups when constructing the risk estimate using the double pair comparison (followed by a weighted average of those risk estimates), Kahane (Citation2013a) built logistic regression models predicting the probabilities of fatalities on relevant groups of vehicles (such as 2005–2011 MY vehicles), then used estimated total counts of fatalities by aggregating probabilities from a representative data set of vehicles involved in fatal crashes in the double pair comparison. Splitting up the process in this way allows the double pair comparison to be performed on a set of fatal crashes that are representative of all fatal crashes in terms of their age distribution of occupants. This is important because, as Kahane (Citation2013a, Citation2013b) noted, age is a predictor of the probability of death in a fatal crash given a physical impact. The logistic regression and double pair comparison approach also allows for a smoothed relationship between age and fatality risk to be fit, in contrast with Evans’ approach of fitting separate relationships in different age groups.
The two steps used in the method, the logistic regression and the double pair comparison, are described below.
Logistic regression
Two logistic regression models were built using the data from FARS 1975 to 2019: one for the driver and one for the RF passenger. FARS contains 255,566 vehicles where the driver and RF passenger were 16 to 96, both driver and RF passenger had identical seat belt status (belted or unbelted), and the driver and/or the RF passenger died. The model is built on any subset of FARS vehicles on which one wants to estimate female relative fatality risk (2010–2020 MY vehicles, for example).
The following variables were used in the models.
• Response Variables:
^ FATAL1 = 1 if the driver was killed; = 2 if the driver survived.
^ FATAL3 = 1 if the RF passenger was killed; = 2 if the RF passenger survived.
• Independent Variables
^ AGE1 = Driver’s age.
^ AGE3 = RF passenger’s age.
^ FEM1 = 1 if the driver was female; = 0 if the driver was male.
^ FEM3 = 1 if the RF passenger was female; = 0 if the RF passenger was male.
^ AGE1_35 =
for drivers 35 or older; = 0 otherwise.
^ AGE3_35 =
^ FEM1_35 = (AGE1
^ FEM3_35 = (AGE3
This logistic regression model assumes that the effect of sex on occupant fatality remains constant until age 35 and then changes at a linear rate after age 35. The assumption with breakpoints at age 35 is based on Kahane’s (Citation2013a) empirical study for the full data set (i.e., for all cars and vehicles with occupant age range 21–96). Although the relationship between fatality, age and the sex coefficient might be much more complex, and the relationship can differ for different groups of vehicles, this study maintained the models used by Kahane because low cases for some of the vehicle groups makes fitting more complex models difficult.
and present the coefficients for the driver and the RF passenger models, respectively, when models were fitted with all of the data included (255,566 vehicles from MY 1960–2020). The coefficients of AGE1 and FEM1 are positive in the driver model, and the coefficients of AGE3 and FEM3 are positive for the RF passenger model, indicating that occupants are more likely to die in these crashes as their age increases and if they are female. Additionally, the coefficients of AGE1_35 for the driver model and AGE3_35 for the RF passenger model are positive, indicating that after age 35, the likelihood of death for an occupant increases more rapidly with increasing age. However, the coefficients of FEM1_35 for drivers and FEM3_35 for RF passengers are negative, indicating that after 35, the elevated fatality risk for females decreases with increasing age.
Table 1. Driver model coefficients.
Table 2. Right-front passenger model coefficients.
In each model, the coefficients of the opposite occupant (ex: coefficients of RF passenger in the driver model) are all negative. This is because the FARS data used in the models include vehicles where at least one of the driver or RF passenger has died. Both occupants died only in 18% of those vehicles (45,894 among 255,566 vehicles). In the remaining 82% of those vehicles, if one occupant died, the other occupant survived. For example, in the driver model, as the driver age increases, the driver’s risk of death increases (i.e., positive coefficient of AGE1). On the other hand, as the RF passenger age increases, the RF passenger’s risk of death increases, then driver’s risk of death decreases (i.e., negative coefficient of AGE3) due to the nature of the data.
The coefficients also indicate that being female in older age has stronger decreasing effect on fatality in the driver model than in the RF passenger model. The coefficient 0.2871 of FEM1 in the driver model and the coefficient 0.3181 of FEM3 in the RF passenger model means that the increase of driver fatality log odds from being female driver younger than 35 is about 10% less than the increase of RF passenger log odds from being female RF passenger younger than 35 when all other variables are fixed. In addition, the coefficient of FEM1_35 is −0.0096 in the driver model, and the coefficient of FEM3_35 is −0.00517 in the RF passenger model. This means when getting one year older after 35, the female effect on driver fatality decreases nearly twice as much as that on RF passenger fatality. Therefore, if a driver is 76, the effect of being female would be to decrease the log odds of a driver fatality by 0.1065 (=0.2871–0.0096×(76–35)). However, if a RF passenger is 76, then the effect of being female would be to increase the log odds of a RF passenger fatality by 0.1061 (=0.3181–0.00517×(76–35)).
Double pair comparison
This step applies the fitted logistic regression models to a representative sample (in terms of the distribution of age and sex of drivers and RF passenger) of vehicles involved in fatal crashes:131,067 vehicles from FARS 2001–2019.
The logistic regression model coefficients produce the predicted log odds of a driver fatality, and RF passenger fatality,
respectively. The probability of a driver fatality (
) is calculated as
(1)
(1)
and the probability of an RF passenger fatality (
is calculated as follows.
(2)
(2)
The probabilities of occupant fatalities in Eqs. (1) and (2) can be calculated for any pair of a driver and an RF passenger of a vehicle involved in a fatal crash by plugging in the values of a driver’s and an RF passenger’s ages and sexes. The following example describes how the percentage difference in fatality risk for female drivers relative to male drivers is estimated from the representative samples of vehicles from the FARS 2001–2019.
1. For each vehicle in the dataset, the driver is assumed as a female, but the driver’s age and RF passenger’s age and sex are not changed. Therefore, the values of independent variables become the following.
• FEM1 = 1
• FEM1_35 = AGE1
• Other variables: the values in the dataset
2. By plugging the values of variables into the regression models, the predicted log-odds of the driver fatality
3. Then, the probability of a driver fatality (
The numbers of driver fatalities and RF passenger fatalities are estimated by summing up the estimated probabilities across all cases in the dataset. Therefore, when the driver is assumed as a female, the average fatality risk ratio of the driver to RF passenger becomes the following.
Eq. represents the fatality risk of female drivers in crashes severe enough to cause at least one fatality in the front row, controlling for the fatality risk of RF passengers in the same crashes given that the driver is female. The predicted number of RF passenger fatalities effectively controls for the overall severity of the crashes in which the drivers are females.
2. Now, to compare with the male drivers, for each vehicle in the dataset, the driver is assumed as a male, but the driver’s age and RF passenger’s age and sex are not changed. Therefore, the values of independent variables become the following.
• FEM1 = 0
• FEM1_35 = 0
• Other variables: the values in the dataset
3. The predicted log-odds of the driver fatality
4. Then, the probability of a driver fatality (
5. The numbers of driver fatalities and RF passenger fatalities are estimated by summing up the estimated probabilities across all records in the dataset. Therefore, when the driver is assumed as a male, the average fatality risk ratio of the driver to RF passenger is calculated as the following.
Similar to for female drivers, Eq. (8) estimates the fatality risk for male drivers in crashes severe enough to cause at least one fatality in the front row, controlling for the fatality risk of RF passengers in the same crash given that the driver is male. The predicted number of RF passenger fatalities effectively controls for the overall severity of the crashes in which the drivers are males.
6. Finally, the relative fatality risk for female drivers to male drivers is the ratio of these two fatality risk ratios in Eqs. (5) and (8) (i.e., double-pair comparison)
Confidence interval
Ninety-five percent confidence intervals are constructed for the percentage difference estimates in female fatality risk relative to males using the “jackknife technique,” as described below. See Efron (Citation1982) for more information on the jackknife estimate of variance.
The dataset used for the regression analysis is randomly divided into 10 equal size subsamples. Ten jackknife samples are then created by deleting one subsample from the dataset (i.e., it consists of 9 subsamples). For each jackknife sample, the percentage difference in female fatality risk relative to males is estimated by building regression models and performing double-pair comparison as described above. Let the original estimate be and the estimate from the jackknife sample be
Then, a pseudo-estimate is calculated as
and it is considered as an estimate from the deleted subsample. In this way, 10 pseudo-estimates are calculated from the 10 jackknife samples. The standard error of these 10 pseudo-estimates serves as the standard deviation of the original estimate, and a t-distribution with 9 degrees of freedom is used for the 95% confidence intervals. To avoid an unstable variance estimate, this process is repeated 11 times and produces 11 standard errors. The median of these 11 standard errors is taken as the final standard error (SE) of the estimate
Finally, confidence intervals are calculated by multiplying the standard error and 2.262, which is the 97.5th percentile of t-distribution with 9 degrees of freedom (i.e.,
and presented as
Vehicle groups
The percentage difference in fatality risk for females relative to males was estimated for various groups of vehicles to find the effect of sex on different crash scenarios and vehicle circumstances. The vehicle groups were defined by the vehicle MY, vehicle type (cars or LTVs), and occupant protection type. For each vehicle group, point estimates and 95% confidence intervals were estimated for drivers, RF passengers, and the average of drivers and RF passengers 16–96 years old.
Comparison between two vehicle groups
In order to determine if there is statistically significant (p < 0.05) evidence of a change (i.e., reduction) in female fatality risk relative to males in later MY vehicles with more advanced occupant protections compared to the older MY vehicles, 95% confidence intervals were estimated for the difference estimates between selected pairs of vehicle groups from vehicle MYs and occupant protection types.
Results
Trends by model years
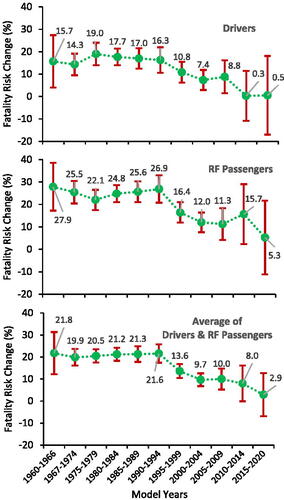
shows that the estimated difference in fatality risk for females compared to males has steadily decreased over vehicle MY. For drivers of cars and LTVs, the peak female fatality risk relative to males is 19% (± 5.0) for MY 1975 to 1979. For RF passengers, the peak female fatality risk relative to males is 27.9% (± 10.6) for MY 1960 to 1966. For MY 2015 to 2020, the female fatality risk relative to males is estimated as 0.5% (± 17.5) for drivers and 5.3% (± 16.4) for RF passengers, respectively. On average, female occupants in the front row have a 2.9% higher fatality risk than males for MY 2015 to 2020. Note that the relatively small number of vehicles for most recent MY groups results in the larger confidence intervals.
Figure 1. Fatality risk difference for females (16 to 96 years old) relative to males by MY (Cars + LTVs).
provides estimated female relative fatality risk by MYs and occupant belt use, while provides estimates of the differences in female relative fatality risk between different MYs (grouped by belt use). Similar to observations in , it can be seen in that the relative fatality risk between females and males has reduced with MY 2000 and newer vehicles as compared to older vehicles. The percent reduction for belted drivers and RFPs was more than twice that of unbelted cases. As seen in , the estimated difference in female fatality risk relative to males for MY 2010 to 2020 was statistically significantly reduced compared to MY 1960–2009 when occupants are belted (−9.8 ± 6.7%) and when combining belted and unbelted occupants (−12.0 ± 5.5%). Statistically significant reductions are seen in all of comparisons between recent MY vehicles (MY 2010 to 2020 or MY 2000–2020) and older MY vehicles when occupants are belted, or when belted and unbelted occupants are combined. Given the smaller case count for MY 2010–2020 unbelted cases, none of the differences found in comparisons versus other unbelted MY ranges was found to be statistically significant. When vehicles involving MY 2000–2020 are compared to vehicles involving MY 1960–1999 for unbelted occupants, the estimated difference in female fatality risk relative to males is reduced by −5.9 ± (4.9), which is statistically significant.
Table 3. Estimated fatality risk difference for females (16 to 96 years old) relative to males grouped by MY of vehicles (Cars + LTVs) and occupant belt use.
Table 4. Comparison of fatality risk difference for females (16 to 96 years old) relative to males between MYs of vehicles (Cars + LTVs) grouped by occupant belt use.
Trends by occupant protection type
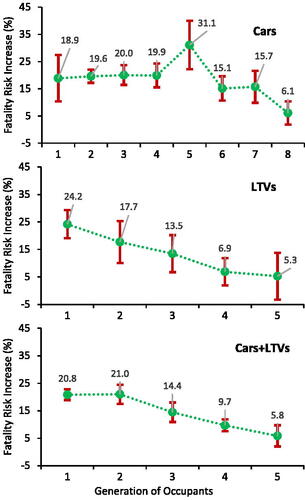
shows that the estimated average fatality risk of drivers and RF passengers differs between females and males for most generations (“generations” refers to the level of occupant protection, see Table A1 in the Supplementary Information for definitions of each generation) of cars and LTVs. The lowest relative risk was estimated at the highest levels of occupant protection for both cars and LTVs. When occupants use belts and are in vehicles with dual air bags, pretensioners and load limiters, the estimated female relative fatality risk is 6.1% (± 4.2) for cars, 5.3% (± 8.5) for LTVs, and 5.8% (± 3.8) for cars + LTVs.
Figure 2. Fatality risk difference for females (16 to 96 years old) relative to males by occupant protection (Cars, LTVs and Cars + LTVs). Note: The description of generation of occupants (Gen1-Gen8 for Cars and Gen1-Gen5 for LTVs and Cars + LTVs) are described in Table A1 in the Supplementary Information.
provides estimated female relative fatality risk by occupant protection types, while provides estimates of the differences in female relative fatality risk between different occupant protection types. Similar to observations presented in , it can be seen in that the relative fatality risk between females and males has significantly reduced when comparing unrestrained occupant scenarios (i.e., no seatbelts or air bags) as compared to the most recent generation of occupant protection. The findings are generally consistent for both drivers and RFPs. For RFPs, the exception is with the belted only scenario where the relative risk for females is at its highest (27.5 ± 5.1%). As shown in , these relative risk reductions with modern occupant protection technologies are statistically significant. For drivers and RFPs, dual air bags reduce the estimated difference in fatality risk compared to no air bags by −6.4 (± 4.0) percent for unbelted occupants and by −11.3 (± 4.1) percent for belted occupants. In again looking at the combined driver and RFP results, the latest occupant protection technologies (dual air bags, pretensioners, and load limiters) reduce the estimated difference in fatality risk for females relative to males by −15.2 (± 5.2) percent for belted occupants. When making the same comparison individually for drivers and RFPs it can be seen that the reduction for RFPs (-20.5 ± 7.5%) was more than twice that for drivers (−9.9 ± 6.9%). With the exception of the comparison of unbelted with and without air bags for drivers, all of the reductions presented in are statistically significant.
Table 5. Estimated fatality risk difference for females (16 to 96 years old) relative to males grouped by occupant protection types.
Table 6. Comparison of fatality risk difference for females (16 to 96 years old) relative to males between occupant protection types.
Discussion
Results demonstrate that the incremental female fatality risk relative to males reduces steadily for later MYs, dropping to 2.9% (± 9.8) for drivers and right-front passengers of MY 2015 to 2020 vehicles. For drivers, the relative fatality risk was 0.5% (± 17.5), while for RF passengers the relative fatality risk was 5.3% (± 16.4). This compares to a high of 19.0% for drivers in MY 1975 to 1979 and 27.9% for RF passengers in MY 1960 to 1966. Given that more advanced occupant safety technologies have been added to vehicles over the years, the MY-based findings are very likely the result of vehicles being equipped with progressively newer generations of occupant safety technologies, in part examined in this study. However, there are likely other contributing factors, such as improved vehicle structures driven by consumer metric testing programs, to this overall trend.
Although statistical comparisons were not conducted, the relative risk is consistently higher for RF passengers than drivers across all MY groups. For example, in MY 2015 to 2020, relative female fatality risk is 5.3% for RF passengers, but only 0.5% for drivers. This study did not further examine possible causes of this difference. As discussed in the methods section, the initial models of occupant fatality probability suggests that that although the female effect decreases with age, this phenomenon is stronger in drivers than RF passengers. This suggests that the discrepancy between drivers and RF passengers in terms of relative female fatality risk mainly occurs in older occupants. Kahane (Citation2013a) observed this trend and speculated that RF passengers may be less likely to be fully healthy (and hence less likely to be able to drive), but he noted that FARS does not provide enough occupant health history to make that assessment with any certainty. Further research is needed to understand how these occupant types compare in terms of their relative fatality risk by sex.
When statistically comparing later MY groups (2010 to 2020 and 2000 to 2020) to earlier MY groups (1960 to 2009, 1960 to 1999, 1980 to 1989, and 1990 to 1999), later MY groups have statistically significantly lower female relative fatality risk than earlier MY groups in all comparisons when occupants are belted. However, only two of the comparisons are significant (2000 to 2020 vs. 1960 to 1999 and 2000 to 2020 vs. 1980 to 1989) in unbelted occupants. One reason for this is the small sample size in unbelted occupants in later MY groups. Seat belt use has increased over the last few decades and is currently around 90% compared to below 20% in the early 1980s (Venkatraman et al. Citation2021). Therefore, occupants in more recent MY vehicles, which were only on the road in more recent years, are much less likely to not be wearing seat belts. In this study, there were only 1238 vehicles where occupants were not wearing seat belts in MY 2010 to 2020 vehicles, compared to 5869 vehicles where occupants were wearing seat belts. In the statistical comparison between two groups, a low sample size for one group raises the variance, and ultimately the length of confidence interval of the comparison. Additionally, point estimates of the differences between later and earlier MY groups are higher in belted groups than unbelted groups. This suggests that seat belt use in later MY group further decreases the disparity in fatality risk between females and males because the later MY vehicles have advanced seat belt equipped with pretensioners and load limiters.
The relative risk estimates constructed in this study feature double pair comparison, which accounts for the fatality levels of the other occupant when calculating the risk (i.e., accounting for RF passenger fatality when estimating the driver relative fatality risk). Using the other occupant as a control allows for the study sample to consist entirely of fatal crashes, which in turn means that FARS data can be used. This allows for larger sample sizes compared to other crash datasets given that FARS contains a complete census of all U.S. fatal crashes. Other crash samples, such as the Crash Investigation Sampling System (CISS) or the Crash Report Sampling System (CRSS), only collect a very small percentage of the total motor vehicle crash fatality cases. Hence, a larger sample of fatal crashes can be included in the analysis, which is especially important when analyzing smaller subgroups of vehicles (such as 2015–2020 MY vehicles).
Comparing estimates from this study to Kahane (Citation2013a) for comparable vehicle groups, the female relative fatality risk is consistently higher. For example, for all MY groups from 1960 to 1966 to 2000 to 2004, the estimates of female relative fatality risk (driver, RF passenger, and average of those) from this study are higher than the estimates from Kahane (Citation2013a) with an exception of MY 1985 to 1989 RF passengers. Additionally, the confidence intervals are smaller in the current study than Kahane (Citation2013a) for all comparable MY groups. This may be due to the inclusion of younger occupants (age 16 to 20) in the data. Female relative fatality risk decreases with age (Kahane Citation2013a: Noh et al. Citation2022). Therefore, adding younger occupants to the data is likely to add an age group with a higher female relative fatality risk. Additionally, adding younger occupants boosts the sample size of vehicles, thereby lowering the variance and subsequently the confidence intervals. Overall, adding younger occupants results in higher female relative risk estimates and lower confidence intervals in comparable vehicle groups. See in the Supplementary Information for MY group comparisons of relative female fatality risk between Kahane (Citation2013a) and the current study for drivers, RF passengers, and the average, respectively. See the appendix in Noh et al. (Citation2022) for tables that compare estimates of relative risk with age 16 to 96 occupants to estimates with age 21 to 96 occupants.
The recent NHTSA reports (Kahane Citation2013a; Noh et al. Citation2022) discussed the effect sex on fatality risk for vehicles grouped by occupant protection type and crash impact type (frontal, nearside, far-side, first-event rollovers, and rear/other crashes). In addition, it provides estimates of relative female fatality risk for further combination of vehicle groups by MY, vehicle type, crash impact type and occupant protection type. For example, first-event rollovers and rear/other crashes had particularly large differences. However, the sample sizes for later MY vehicles when dividing by crash type sometimes reached very small numbers relative to other vehicle groups. For example, first-event rollovers for MY 2010 to 2020 vehicles had only 276 vehicles in the sample. For this reason, impact type was not emphasized in this study.
Some of the vehicle groups in this analysis have a small number of vehicles, resulting in large confidence intervals. Thus, care should be taken to interpret point estimates of female fatality risk relative to males in conjunction with large confidence intervals. As discussed previously, among the MY groups used in the statistical comparison between later and earlier MY groups, MY 2010–2020 with unbelted occupants has only 1238 vehicles, compared with 170,553 vehicles of MY 1960 to 2009 with unbelted occupants. In terms of general trends of MY and occupant protection type, the vehicle group with the smallest sample size is 2182 vehicles for MY 2015 to 2020.
Advances in crash testing associated with regulations and consumer metric programs has led to the development and incorporation of occupant projection countermeasures that have lowered female fatality risk relative to males. Occupants in vehicles with the latest occupant protection technologies, such as dual air bags and seat belts with pretensioners and load limiters, exhibit the lowest estimated relative female fatality risk.
When looking at the influence of air bags, it can be seen that the relative risk reduction is most significant when all of the most modern occupant protection technologies considered in this study were present. For instance, air bags were shown to provide a statistically significantly reduction in the estimated difference in female fatality risk relative to males for both belted and unbelted occupants. However, the reduction was significantly larger for belted occupants, suggesting the effect of air bags on reducing sex disparity in fatality risk is enhanced by wearing seat belts. Even further, the relative risk reduction was at its greatest for belted occupants in air bag-equipped vehicles where the seat belts were also equipped with pretensioners and load limiters. Finally, when looking at the effects of occupant protection technologies on drivers and RFPs separately, it was observed that the greatest net reduction in relative fatality risk was with RFPs. While this may be in part due to the higher relative risk starting point for RFPs versus drivers, what can be clearly seen is that there are relative risk reduction benefits of the latest generations of occupant protection that are beneficial to both drivers and RFPs.
Supplemental Material
Download Zip (18.1 KB)Additional information
Funding
References
- AAA Foundation for Traffic Safety 2020. Traffic Safety Culture Index. Washington (DC): AAA Foundation for Traffic Safety. https://aaafoundation.org/wp-content/uploads/2021/09/2020-Traffic-Safety-Culture-Index-October-2021.pdf.
- AAA Foundation for Traffic Safety. 2017. Traffic safety culture index. Washington (DC): AAA Foundation for Traffic Safety. https://aaafoundation.org/wp-content/uploads/2018/03/TSCI-2017-Report.pdf.
- AAA Foundation for Traffic Safety. 2018. Traffic safety culture index. Washington (DC): AAA Foundation for Traffic Safety. https://aaafoundation.org/wp-content/uploads/2019/06/2018-TSCI-FINAL-061819_updated.pdf.
- AAA Foundation for Traffic Safety. 2019. Traffic safety culture index. Washington (DC): AAA Foundation for Traffic Safety. https://aaafoundation.org/wp-content/uploads/2020/06/2019-Traffic-Safety-Culture-Index.pdf.
- Abrams MZ, Bass CR. 2021. Female vs. male relative fatality risk in fatal crashes. IRCOBI Conference.
- Dingus TA, Guo F, Lee S, Antin JF, Perez M, Buchanan-King M, Hankey J. 2016. Driver crash risk factors and prevalence evaluation using naturalistic driving data. Proc Natl Acad Sci U S A. 113(10):2636–2641. doi: 10.1073/pnas.1513271113.
- Efron B. 1982. The jackknife, the bootstrap and other resampling plans. Society for Industrial and Applied Mathematics.
- Evans L. 2001. Female compared with male fatality risk from similar physical impacts. J Trauma. 50(2):281–288. doi: 10.1097/00005373-200102000-00014.
- Evans L. Double pair comparison–a new method to determine how occupant characteristics affect fatality risk in traffic crashes. Accid Anal Prev. 1986;18(3):217–227. doi: 10.1016/0001-4575(86)90006-0.
- Evans L. Risk of fatality from physical trauma versus sex and age. J Trauma. 1988;28(3):368–378. doi: 10.1097/00005373-198803000-00013.
- Forman J, Poplin GS, Shaw CG, McMurry TL, Schmidt K, Ash J, Sunnevang C. 2019. Automobile injury trends in the contemporary fleet: Belted occupants in frontal collisions. Traffic Inj Prev. 20(6):607–612. doi: 10.1080/15389588.2019.1630825.
- Kahane CJ. 2013a. Injury vulnerability and effectiveness of occupant protection technologies for older occupants and women. Washington (DC): National Highway Traffic Safety Administration. https://crashstats.nhtsa.dot.gov/Api/Public/ViewPublication/811766.
- Kahane CJ. 2013b. Effectiveness of pretensioners and load limiters for enhancing fatality reduction by seat belts. Washington (DC): National Highway Traffic Safety Administration. https://crashstats.nhtsa.dot.gov/Api/Public/ViewPublication/811835.
- Lipari RN, Hughes A, Bose J. 2016. Driving under the influence of alcohol and illicit drugs. The CBHSQ Report: December 27. Rockville (MD): Center for Behavioral Health Statistics and Quality, Substance Abuse and Mental Health Services Administration.
- Liu C, Subramanian R. 2020. The relationship between passenger vehicle occupant injury outcomes and vehicle age or model year in police-reported crashes. Washington (DC): National Highway Traffic Safety Administration.
- National Center for Statistics and Analysis. 2021. Fatality Analysis Reporting System (FARS) analytical user’s manual, 1975-2019. Washington (DC): National Highway Traffic Safety Administration. https://crashstats.nhtsa.dot.gov/Api/Public/ViewPublication/813023.
- Noh EY, Atwood JRE, Lee E, Craig MJ. 2022. Female crash fatality risk relative to males for similar physical impacts. Washington (DC): National Highway Traffic Safety Administration. https://crashstats.nhtsa.dot.gov/Api/Public/ViewPublication/813358.
- Perez MA, Sears E, Valente JT, Huang W, Sudweeks J. 2021. Factors modifying the likelihood of speeding behaviors based on naturalistic driving data. Accid Anal Prev. 159:106267. doi: 10.1016/j.aap.2021.106267.
- Venkatraman V, Richard CM, Magee K, Johnson K. 2021. Countermeasures that work: a highway safety countermeasures guide for state highway safety offices. Washington (DC): National Highway Traffic Safety Administration. https://www.nhtsa.gov/sites/nhtsa.gov/files/2021-09/Countermeasures-10th_080621_v5_tag.pdf.