
Abstract
Objective
Advanced driver assistance systems are increasingly available in consumer vehicles, making the study of drivers’ behavioral adaptation and the impact of automation beneficial for driving safety. Concerns over driver’s being out-of-the-loop, coupled with known limitations of automation, has led research to focus on time-critical, system-initiated disengagements. This study used real-world data to assess drivers’ response to, and recovery from, automation-initiated disengagements by quantifying changes in visual attention, vehicle control, and time to steady-state behaviors.
Methods
Fourteen drivers drove for one month each a Cadillac CT6 equipped with Super Cruise (SC), a partial automation system that, when engaged, enables hands-free driving. The vehicles were instrumented with data acquisition systems recording driving kinematics, automation use, GPS, and video. The dataset included 265 SC-initiated disengagements identified across 5,514 miles driven with SC.
Results
Linear quantile mixed-effects models of glance behavior indicated that following SC-initiated disengagement, the proportions of glances to the Road decreased (Q50Before=0.91, Q50After=0.69; Q85Before=1.0, Q85After=0.79), the proportions of glances to the Instrument Cluster increased (Q50Before=0.14, Q50After=0.25; Q85Before=0.34, Q85After=0.45), and mean glance duration to the Road decreased by 4.86 sec in Q85. Multinomial logistic regression mixed-models of glance distributions indicated that the number of transitions between glance locations following disengagement increased by 43% and that glances were distributed across fewer locations. When driving hands-free, take over time was significantly longer (2.4 sec) compared to when driving with at least one hand on the steering wheel (1.8 sec). Analysis of moment-to-moment distributional properties of visual attention and steering wheel control following disengagement indicated that on average it took drivers 6.1 sec to start the recovery of glance behavior to the Road and 1.5 sec for trend-stationary proportions of at least one hand on the steering wheel.
Conclusions
Automation-initiated disengagements triggered substantial changes in driver glance behavior including shorter on-road glances and frequent transitions between Road and Instrument Cluster glance locations. This information seeking behavior may capture drivers’ search for information related to the disengagement or the automation state and is likely shaped by the automation design. The study findings can inform the design of more effective driver-centric information displays for smoother transitions and faster recovery.
Introduction
Advanced driver assistance systems (ADAS) are increasingly available in consumer vehicles, making the study of drivers’ behavioral adaptation and the impacts of automation beneficial for driving safety research. Consumer vehicles equipped with partial automation (SAE Level 2) can simultaneously control the longitudinal (Adaptive cruise control, ACC) and lateral (lane-centering) vehicle kinematics on a sustained basis (SAE International Citation2018). When using partial automation, drivers delegate the operational control of the dynamic driving task over to the automation, while remaining responsible for monitoring, performing object and event detection, and responding when needed. One such commercially available partial automation system is Cadillac Super Cruise (hereafter SC). SC, a geofenced system that can be used only on mapped, limited-access highways, enables feet-free and hands-free driving while continuously monitoring the driver. Similar to other partial automation systems, SC is primarily marketed as a comfort system that may reduce the effort associated with continuous vehicle control. And, indeed, recent studies on partial automation use suggest that after a relatively short period of time many drivers become comfortable with hands-free and feet-free driving, allowing the vehicle to brake and accelerate without placing their hands on the steering wheel (Morando et al. Citation2021a; Banks et al. Citation2018).
Unique challenges emerge as driving demands are lowered by automation and the driver’s role pivots toward monitoring. These challenges include maintaining sufficient attention to the driving task, driver out-of-the-loop (OOTL) situations, mode confusion, and distracted driving, just to name a few. Several studies have found that extended use of automation may result in slower hazard detection and longer reaction time to obstacles compared to manual driving (Louw and Merat Citation2017; Eriksson and Stanton Citation2017). In a study of Tesla owners, Morando et al. (Citation2021a) found that the use of Tesla Autopilot was associated with an increase in visual inattention (longer and more frequent off-road glances), and a reduction in direct control (more frequent hands-free driving). These changes in driver behavior may be the consequence of misunderstanding or false expectations that are reinforced when automation performs relatively well (Abraham et al. Citation2017; Teoh Citation2020; Victor et al. Citation2018).
Concerns over driver inattention, coupled with known limitations of partial automation, has led research to focus on time-critical, system-initiated disengagements where drivers are required to take over either the lateral (steering) or both lateral and longitudinal (steering and speed) vehicle control (Louw et al. Citation2017; Gaspar and Carney Citation2019). Essentially, drivers may be unprepared to regain control when automation reaches its operational limits (Lin et al. Citation2018; Parasuraman and Riley Citation1997; Reagan et al. Citation2020). Furthermore, in these situations, it is also unknown how the use of systems like SC, that allows hands-free driving, will impact a driver’s ability to regain control in a timely manner. Driver attention monitoring systems are one mechanism designed to mitigate lapses in driver engagement by providing feedback to the driver or adapting the automation functionality in real-time (Donmez et al. Citation2009; Lee et al. Citation2013; Reimer Citation2020). Current driver monitoring systems use steering wheel torque-based sensors and/or driver facing cameras that track gaze and/or head position to infer driver state and intervene when a threshold for apparent inattention is exceeded. SC, for example, has a camera-based driver monitoring system that employs multimodal cues (visual, auditory, and haptics) to support driver attention on a moment-to-moment basis. While partial automation systems are increasingly available, the literature to date is limited by the lack of objective data on the extent to which drivers use partial automation, the context and frequencies in which the automation initiates disengagements, and how drivers respond to and recover from such events.
The current study used real-world data to characterize the occurrences of automation-initiated disengagement requests and assess driver response and recovery behaviors. By quantifying changes in visual attention prior and immediately after automation disengagements, and analyzing moment-to-moment distributional properties of driver glance and hand-on-wheel behaviors, this study provides insights on how drivers dynamically allocate their visual attention and the time it takes them to regain control following automation-initiated disengagement.
Methods
Participants
Fourteen drivers (36% female) with an average age of 42 years (SD = 13.3) were recruited from the greater Boston area of Massachusetts through advertisements. Potential participants were screened according to inclusion criteria that required passing background and driving record checks, and to have highway driving as part of their regular commute. Drivers were excluded if they had been involved in a police-reported crash or received two or more traffic violation citations in the past year, or had other risk markers. Participants received a 30-minute static in-vehicle instruction session followed by an hour of on-road training during which participants were familiarized with and asked to interact with the different automation systems.
Data source and data reduction
Data were drawn from the ongoing MIT Advanced Vehicle Technology (MIT-AVT) naturalistic data collection effort. Participants in this sample drove a 2018 Cadillac CT6 for one month each (between April 2018 and May 2019). The vehicles were instrumented with data acquisition systems (Fridman et al. Citation2019) that continuously recorded data from: (i) Controller Area Network (CAN) bus to determine vehicle kinematics, driver interaction with the vehicle controllers, and the state of in-vehicle automation systems, (ii) Global Positioning System (GPS) to record location; (iii) four 720p video cameras that captured (30fps) the driver’s face, vehicle cabin, instrument cluster, and the view of the forward roadway.
Automation-initiated disengagement, operationally defined as an event where the automation (SC) issued an immediate disengagement request triggered by conditions such as: (i) changes in the operational design domain, like entering a construction zone, (ii) driver behaviors like accelerating beyond the braking authority of ACC, or (iii) failure in one or more elements of the automation system (e.g. sensing, computation, or planning). To identify these events, a filter was run over the continuous CAN data and flagged events were evaluated by experienced coders who viewed video segments of 10 sec before and 10 sec after the automation-initiated the disengagement and employed a systematic protocol to validate the occurrence and annotate the context of the disengagements.
Measures
Driving conditions
The following factors were annotated for each disengagement event: Road features (Construction, Tunnel, Bridge, On/Off Ramp), Lighting conditions (Daylight/Dark) and Surface conditions (Dry/Wet).
Glance location
Driver’s glance location was annotated frame-by-frame at 30fps. Glances were classified to the following categories: (i) Road (glances directed to the windscreen); (ii) Instrument Cluster (instrument cluster/steering wheel location); (iii) Down & Center Stack (center stack, the in-car multimedia, and the down or lap location); (iv) Mirrors (left, right windows or mirrors, and rearview mirror). When a glance did not fall under the listed categories, it was annotated as Other. See Morando et al. Citation2021b for detailed description of glance coding.
Steering wheel control level
The driver’s steering wheel control level was annotated frame-by-frame at 30fps based on observed hand positioning on the steering wheel (Morando et al. Citation2021a) and included the following categories: (i) No hands (driving hands-free); (ii) One hand; (iii) Two hands; and (iv) Not visible.
Statistical analyses
The Kwiatkowski-Phillips-Schmidt-Shin (KPSS) stationarity test (Kwiatkowski et al. Citation1992) and Pruned Exact Linear Time (PELT) changepoint detection algorithm (Killick et al. Citation2012) were used to evaluate trends in driver response to, and recovery from, automation-initiated disengagement as expressed by changes in glance behavior and steering wheel control level. A linear mixed-effects regression model with driver-specific random intercept was used to assess the relationship between steering wheel control level and the time it took drivers to take over in response to automation-initiated disengagement. Linear quantile mixed-effects regression models with driver-specific random intercept were used to estimate glance proportions and durations in the 10 sec before and 10 sec after the disengagement request across glance locations and three quantiles (15th, 50th, and 85th) (Geraci and Bottai Citation2014). Multinomial logistic regression models with driver-specific random intercept were used to estimate the probabilities that drivers would transition their glances from one glance location to all other locations in the 10 sec before and 10 sec after automation-initiated disengagements. Finally, Markov Chains Monte Carlo (MCMC) analysis tested whether the transition probabilities matrices before and after the disengagements were significantly different.
Results
The context and prevalence of automation-initiated disengagements
A total of 265 automation-initiated disengagements events were identified (mean = 18.9; SD = 16.5; range= 0-52 events per driver) across 5,514 miles driven with SC engaged. The majority of the disengagements occurred under relatively favorable conditions, including daylight (75%), and on dry surface (91%). Disengagements also occurred when driving on/off ramps (3%) as well as construction zones and tunnels (3.4%). The analyses included only disengagement events for which drivers’ eyes and hands were visible and SC was engaged for at least 10 sec before the disengagement (n = 187). In most events (89%), SC disengaged to ACC-only and in 11% of the events SC disengaged entirely, transitioning directly to manual driving. During the evaluated 10 sec after disengagement, drivers might or might not reengage SC.
Distribution of steering wheel control levels over time
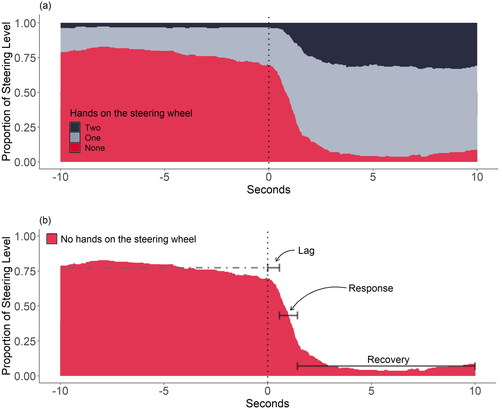
shows the proportions of steering wheel control levels across all events during the 10 sec before and 10 sec after automation-initiated disengagements. Prior to automation-initiated disengagement requests, on average, drivers drove hands-free 78% of the time and rarely had both hands on the steering wheel (3%). Shortly after the onset of disengagement, drivers increased their level of steering wheel control by 53%, grabbing the wheel with at least one hand. A KPSS test on the proportions of hands-free driving indicated that the distribution of hands-free driving was not trend-stationary, but had non-deterministic trends that changed over time (KPSS = 0.952, lag = 5, p< =.01). The PELT changepoint detection algorithm was used to estimate the points in which the statistical properties of the proportions of hands-free driving changed. The analysis yielded two points of change, separating the proportions of hands-free driving after automation disengagement into three segments of trend-stationary periods. , illustrates the segments identified in the proportion of hands-free driving that correspond to lag, response, and recovery time periods. Starting from the onset of an automation disengagement request, the lag period lasted on average 0.6 sec and had proportions of hands-free driving similar to those observed before the disengagement request. Next, a relatively short (0.9 sec) response period was characterized by a sharp decrease in the proportions of hands-free driving. The driver recovery period, represented by stable and low proportions of hands-free driving, started 1.5 sec following the onset of the disengagement request where most of the drivers had at least one hand on the steering wheel. The duration of the recovery period was bounded by the annotation window.
Figure 1. (a) Proportions of steering wheel control levels across time. Automation disengagement is at 0 sec and marked with a dashed line. (b) Proportion of hands-free driving across time, with the trend-stationary hands-on-wheel behavior periods (lag, response, and recovery) marked with horizontal lines.
A linear mixed-effects model with a driver-specific random intercept was used to estimate the disengagement duration comparing steering wheel control levels (hands-free vs. driving with at least one hand on the steering wheel) at the onset of the disengagement request. The disengagement duration from its onset is dictated by the time it takes the driver to resume steering control (i.e. active steering that is reflected by a change in the automation state). On average, the take-over duration when driving hands-free was significantly longer (2.4 sec) compared to driving with at least one hand on the steering wheel (1.8 sec) [χ2(1)=4.97, p=.026].
Distribution of glances across locations and over time
shows the proportions of glances to different locations across all events during the 10 sec before and 10 sec after disengagement. Overall, the distribution of glance proportions prior to automation-initiated disengagement were relatively stable, with an average of 80% (SD = 3%) of the glances directed to the Road, 8% (SD = 2%) to the Down & Center Stack locations, and 6% (SD = 2%) to the Instrument Cluster. Following automation disengagement, glance proportions shifted from the Road (69%, SD = 5%) and the Down & Center Stack (3%, SD = 1%) locations to the Instrument Cluster (24%, SD = 6%). This shift in glances toward the Instrument Cluster may capture drivers’ search for information related to the disengagement and/or SC state.
Figure 2. (a) Proportions of glances 10 sec before and 10 sec after automation-initiated disengagement across the different glance areas. Automation disengagement is at 0 sec and marked with a dashed line. (b) Proportion of glances to the road across time, with the trend-stationary glance behavior periods (lag, response, and recovery) marked with horizontal lines.
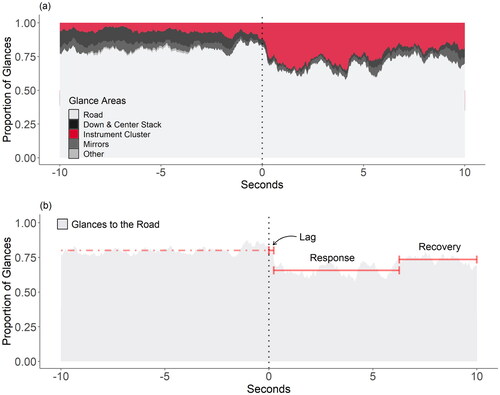
The KPSS test indicated that the proportion of glances to the Road (KPSS = 0.583, lag = 6, p< =.01) () and to the Instrument Cluster (KPSS = 0.991, lag = 6, p< =.01) locations were not trend-stationary, with trends in glance behavior that changed over time. As illustrated in , PELT changepoint detection analysis of the proportions of glances to the Road identified a lag period of 0.3 sec in which drivers maintained proportions of glances to the Road similar to those observed before the disengagement onset. The response period had the lowest proportions of glances to the Road and lasted on average 5.8 sec. Driver recovery started 6.1 sec following the disengagement request. While the proportion of glances to the Road during the evaluated recovery period was higher compared to the response period, it was still lower compared to the proportions observed prior to the automation-initiated disengagement request. Changepoint detection analysis of the proportion of glances to the Instrument Cluster location identified a lag period of 0.3 sec, a response period of 5.7 sec in which the proportions of glances to the Instrument Cluster were the highest. The recovery period started 6 sec after the onset of the disengagement request and was characterized by a decrease of 10% in the proportion of glances to the Instrument Cluster compared to the response period.
In-line with the behavior illustrated in , models indicated that drivers’ visual attention to the Road decreased significantly shortly after automation disengagement. Linear quantile mixed-effects models with subject specific random intercept were used to estimate the mean glance proportions to the Road and the Instrument Cluster locations across the 15th, 50th and 85th quantiles before and after automation-initiated disengagement. The proportions of glances to the Road decreased significantly following automation disengagement (Q50Before=0.91, CI = [0.77-1.0], Q50After=0.69, CI = [0.59-0.79]; Q85Before=1.0, CI = [0.81-1.21], Q85After=0.79, CI = [0.69-0.89]) and the proportions of glances to the Instrument Cluster significantly increased (Q50Before=0.14, CI = [0.03-0.25], Q50After=0.25, CI = [0.20-0.31]; Q85Before=0.34, CI = [0.07-0.60], Q85After=0.45, CI = [0.31-0.59]). The proportion of glances to the Road and to the Instrument Cluster in the 15th quantiles were not sensitive to automation-initiated disengagements (Q15Before=0.58, CI = [0.26, 0.91]; Q15After=0.54, CI = [0.38, 0.71], p=.623; Q15Before=0.04, CI = [0, 0.14]; Q15After=0.05, CI = [0, 0.10], p=.540 respectively) (see Appendix , Supplementary Material).
Transition probabilities between glance locations
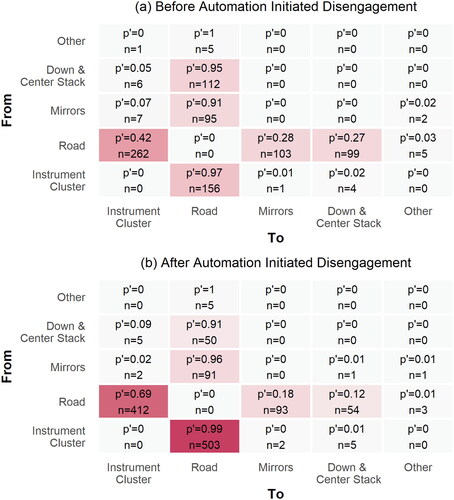
Multinomial logistic regression models accounting for within subject effects were used to examine how drivers distribute their visual attention following automation-initiated disengagement. The transition matrices in summarize visual attention patterns, capturing both the number of transitions and the estimated transition probabilities between glance locations in the 10 sec before and 10 sec after the disengagement. The number of transitions between glance locations following disengagement increased by 43% and, at the same time, glances were distributed across fewer locations. Analysis of the transition probabilities between glance locations using MCMC (10,000 samples) indicated that the glance patterns before and after disengagement were significantly different (χ2(24)=24465.28, p<.001). The most dominant visual attention patterns after disengagement were p(Instrument Cluster→Road) and p(Road→Instrument Cluster), which increased from 0.97 to 0.99 and from 0.42 to 0.69, respectively. In-parallel, there were substantial decreases in the probabilities for Road→Mirrors (from 0.28 to 0.18) and Road→Down & Center Stack (0.27 to 0.12) transitions (see ).
Figure 3. Transition matrices showing estimated transition probabilities (p’) and number of transitions (n) from (y-axis) and to (x-axis) glance areas, during the 10 sec before (a) and after (b) automation-initiated disengagement. Each cell in the transition matrix is color-coded and the color intensity correlates with the number of transitions.
Linear quantile mixed-effects models with subject specific random intercept were used to estimate the mean duration of glances to the Road and away from the road (hereafter Off-Road glances) before and after automation disengagement and across the 15th, 50th and 85th quantiles. The duration of long glances to the Road significantly decreased and was 4.86 sec shorter following disengagement (Q85Before=6.63, CI = [2.16, 11.1] to Q85After=1.77, CI = [0, 4.10], p<.001). Off-Road glance duration did not change significantly following automation-initiated disengagements in any of the evaluated quantiles (see Appendix , Supplementary Material).
Discussion
The current study used real-world driving data to assess the occurrence of automation-initiated disengagements and characterize moment-to-moment dynamic visual attention allocation and steering-wheel control behaviors until the driver demonstrated trend-stationary behavior. In general, the use of automation and the likelihood for automation-initiated disengagement may depend on a wide range of factors including driving location and road type, weather and surface conditions, and system implementation and maturity (Hu et al. Citation2022; Gershon et al. Citation2021; Lv et al. Citation2017). Findings indicate that in our sample, drivers used SC in almost half of their highway driving and the majority of automation-initiated disengagements occurred under relatively favorable conditions (e.g. during daytime and on dry roads).
Driving safety research has long been concerned with the driver’s ability to maintain adequate attention to the driving task when using automation and their ability to regain vehicle control in response to a potential hazard or following automation-initiated disengagements (Victor et al. Citation2018; Yang et al. Citation2021). We find that drivers adopted the SC hands-free driving feature to a substantial degree, taking both hands off the steering wheel more than 75% of the time. When both hands were off the steering wheel, in the response to automation-initiated disengagement requests, drivers took on average an additional 0.6 sec to regain control and actively steering which is an increase of 33% compared to drivers who had at least one hand on the wheel. The significance of this time interval should be evaluated in the context of readiness to respond and considering the design of SC which continues its lane-centering support until the driver actively steers.
Cadillac SC was one of the first systems to use a driver facing camera to infer driver attentional state and issue multimodal alerts when a threshold for apparent inattention is exceeded. Similar to previous studies, we find that the distributions of glances prior to automation-initiated disengagements were relatively stable, with glances primarily directed to the Road, to the Down & Center Stack, and only a limited proportion of glances were directed toward the Instrument Cluster (Morando et al. Citation2021b). Our results indicate that shortly after an automation-initiated disengagement request, there was a decrease in the proportion of glances directed to the Road along with an increase in the proportion of glances towered the Instrument Cluster, which lowered attention to all other glance locations. As part of a driver’s response to the disengagement request, the proportion of glances to the Down & Center Stack locations dropped almost to zero. This behavior suggests that drivers are suppressing secondary tasks as the glances to Down & Center Stack locations are often associated with non-driving related activities.
Changes in driver glance behavior following a disengagement request were also evident in more frequent transitions between a limited number of glance locations and shortening of long on-road glances by 73%. Taken together, these changes in glance behavior resulted in an overall lower and more fragmented visual attention to the Road during a sensitive and potentially time-critical driving situation. This shift in glance behavior persisted for a relatively extended period of time and is consistent with information seeking behavior that may capture drivers’ search for information related to the disengagement and/or to the automation state. When assessing changes in driver behavior following an automation disengagement request, it is important to consider both the magnitude of changes in the distribution of visual attention and the time course up to the start of recovery in glance behavior. System and HMI design should aim to minimize the duration in which drivers are adjusting their glance behavior in response to changes in the vehicle automation state. Designs that provide easy to ingest and adequate information associated with automation disengagement will likely support smoother transitions and faster recovery.
The analysis of moment-to-moment distributional properties of driver visual attention and steering wheel control level following automation-initiated disengagement identified three distinct stages. We find short lag periods in which the distributions of glances and hands-free driving were similar to those observed prior to the onset of the automation disengagement request, capturing the time it took drivers to initiate the response. The motoric response period was shorter than the visual response period. Thus, even after drivers regained manual control of the steering wheel, their glance patterns were characterized by increased attention to the Instrument Cluster.
Limitations to the current study include a relatively small, regional, volunteer sample of drivers that were enrolled for one-month. Future research should evaluate how the use of partial automation and the characteristics of its driver attention monitoring system may impact the way glance behavior and steering wheel control intertwin. This study provides a reference point for looking at response behaviors when interacting with other system designs and implementations (e.g. Tesla’s Autopilot or Ford’s Blue Cruise). Lastly, future research could benefit from longer periods of study to better estimate the longer-term use of automation and document more instances of automation-initiated disengagements.
In summary, as driver behavioral adaptation to automation is complex and hard to predict, developing human-centered automated systems will benefit from an evolutionary process that builds upon insights on how drivers use currently available ADAS in real-world settings. The use of partial automation is changing and reshaping drivers’ visual and vehicle control behaviors, including the response to, and recovery from, automation-initiated disengagements. Based on the observed trends, it is likely that the use of higher levels of automation will introduce more substantial changes in visual and vehicle control behaviors during automation disengagements. Understanding the behavioral impacts of automation use is key for mitigating possible unintended outcomes and achieving the promise automation holds for driving safety and comfort.
Supplemental Material
Download Zip (58.3 KB)Additional information
Funding
References
- Abraham H, McAnulty H, Mehler B, Reimer B. 2017. Case study of today’s automotive dealerships: introduction and delivery of advanced driver assistance systems. Transp Res Rec. 2660(1):7–14. doi:10.3141/2660-02.
- Banks VA, Eriksson A, O’Donoghue J, Stanton NA. 2018. Is partially automated driving a bad idea? Observations from an on-road study. Appl Ergon. 68:138–145. doi:10.1016/j.apergo.2017.11.010.
- Donmez B, Boyle LN, Lee JD. 2009. Designing feedback to mitigate distraction. In: Regan MA, Lee JD, Young KL, editors. Driver distraction: Theory, effects and mitigation. London: CRC Press; p. 519–531.
- Eriksson A, Stanton NA. 2017. Takeover time in highly automated vehicles: noncritical transitions to and from manual control. Hum Factors. 59(4):689–705. doi:10.1177/0018720816685832.
- Fridman L, Brown DE, Glazer M. 2019. MIT advanced vehicle technology study: large-scale naturalistic driving study of driver behavior and interaction with automation. IEEE Access. 7:102021–102038. doi:10.1109/access.2019.2926040.
- Gaspar J, Carney C. 2019. The effect of partial automation on driver attention: a naturalistic driving study. Hum Factors. 61(8):1261–1276. doi:10.1177/0018720819836310.
- Geraci M, Bottai M. 2014. Linear quantile mixed models. Stat Comput. 24(3):461–479. doi:10.1007/s11222-013-9381-9.
- Gershon P, Seaman S, Mehler B, Reimer B, Coughlin J. 2021. Driver behavior and the use of automation in real-world driving. Accid Anal Prev. 158:106217. doi:10.1016/j.aap.2021.106217.
- Hu W, Cicchino JB, Reagan IJ, Monfort SS, Gershon P, Mehler B, Reimer B. 2022. Use of level 1 and 2 driving automation on horizontal curves on interstates and freeways. Transp Res Part F: Traffic Psychol Behav. 89:64–71. doi:10.1016/j.trf.2022.06.008
- Killick R, Fearnhead P, Eckley IA. 2012. Optimal detection of changepoints with a linear computational cost. J Am Stat Assoc. 107(500):1590–1598. doi:10.1080/01621459.2012.737745.
- Kwiatkowski D, Phillips PC, Schmidt P, Shin Y. 1992. Testing the null hypothesis of stationarity against the alternative of a unit root: how sure are we that economic time series have a unit root? J Econom. 54(1–3):159–178. doi:10.1016/0304-4076(92)90104-Y
- Lee JD, Moeckli J, Brown TL, Roberts SC, Schwarz C, Yekhshatyan L, Nadler E, Liang Y, Victor T, Marshall D, et al. 2013. Distraction detection and mitigation through driver feedback (No. DOT HS 811 547A).
- Lin R, Ma L, Zhang W. 2018. An interview study exploring Tesla drivers’ behavioural adaptation. Appl Ergon. 72:37–47. doi:10.1016/j.apergo.2018.04.006.
- Louw T, Markkula G, Boer E, Madigan R, Carsten O, Merat N. 2017. Coming back into the loop: drivers’ perceptual-motor performance in critical events after automated driving. Accid Anal Prev. 108:9–18. doi:10.1016/j.aap.2017.08.011
- Louw T, Merat N. 2017. Are you in the loop? Using gaze dispersion to understand driver visual attention during vehicle automation. Transp Res Part C Emerg Technol. 76:35–50. doi:10.1016/j.trc.2017.01.001.
- Lv C, Cao D, Zhao Y, et al. 2017. Analysis of autopilot disengagements occurring during autonomous vehicle testing. IEEE/CAA J Autom Sin. 5(1):58–68. doi:10.1109/jas.2017.7510745.
- Morando A, Gershon P, Mehler B, Reimer B. 2021a. Visual attention and steering wheel control: from engagement to disengagement of Tesla Autopilot. Proc Hum Factors Ergon Soc Annu Meet. 65(1):1390–1394. doi:10.1177/1071181321651118.
- Morando A, Gershon P, Mehler B, Reimer B. 2021b. A model for naturalistic glance behavior around Tesla Autopilot disengagements. Accid Anal Prev. 161:106348. doi:10.1016/j.aap.2021.106348.
- Parasuraman R, Riley V. 1997. Humans and automation: use, misuse, disuse, abuse. Hum Factors. 39(2):230–253. doi:10.1518/001872097778543886.
- Reagan IJ, Cicchino JB, Kidd DG. 2020. Driver acceptance of partial automation after a brief exposure. Transp Res Part F Traffic Psychol Behav. 68:1–14. doi:10.1016/j.trf.2019.11.015.
- Reimer B. 2020. Should Tesla take the initiative to better monitor and manage driver behavior with Autopilot. Forbes.
- SAE International. 2018. Taxonomy and definitions for terms related to driving automation systems for on-road motor vehicles (SAE Standard J3016, Report No. J3016-201806). Warrendale (PA): SAE.
- Teoh ER. 2020. What’s in a name? Drivers’ perceptions of the use of five SAE Level 2 driving automation systems. J Safety Res. 72:145–151. doi:10.1016/j.jsr.2019.11.005.
- Victor TW, Tivesten E, Gustavsson P, Johansson J, Sangberg F, Ljung Aust M. 2018. Automation expectation mismatch: incorrect prediction despite eyes on threat and hands on wheel. Hum Factors. 60(8):1095–1116. doi:10.1177/0018720818788164.
- Yang S, Kuo J, Lenné MG. 2021. Effects of distraction in on-road Level 2 automated driving: impacts on glance behavior and takeover performance. Hum Factors. 63(8):1485–1497. doi:10.1177/0018720820936793.