
Abstract
Objective
The objective of this study was to summarize existing knowledge on the association between driving under the influence of alcohol and road safety outcomes and to assess factors that may explain why these estimates vary.
Methods
Based on studies of the association between blood alcohol concentration (BAC) levels and crashes, we used multilevel metaregression to calculate summary effects of BAC level and analyze potential moderators of the association.
Results
Based on 60 studies and 393 effect estimates, we found that BAC level, outcome severity, use of hospital data, and geographical region contributed to heterogeneity in results.
Conclusion
The effect of BAC on crash and injury risk and culpability is stronger at higher BAC levels and for more serious outcomes. The relationship between BAC level and outcome is approximately exponential. The relationship is stronger in studies from Nordic countries than in studies from other countries, possibly because of the relatively low level of drunk driving in these countries. Studies based on hospital data and studies using non-crash-involved control groups find smaller effects on average.
Introduction
It is well established that alcohol impairs skills and abilities required for safe driving (Global Road Safety Partnership Citation2007; Schnabel et al. Citation2010). An association between driving under the influence of alcohol (commonly assessed by blood alcohol concentration, BAC) and crash involvement has been found across numerous studies. However, the strength of the reported association varies. Detailed knowledge on the association between driving under the influence (DUI) of alcohol and adverse road safety outcomes is of great importance for policymakers in prioritizing and selecting countermeasures. Differences in study design, context, and biases that may explain variation in effects have been published by Gjerde et al. (Citation2015) and Houwing et al. (Citation2013). However, to our knowledge, the joint influence of potential moderators has not been investigated for the extensive literature relating drunk driving to road safety outcomes.
The current study aims, by means of meta-analysis, to synthesize estimates of the risk associated with DUI and assess how several potential moderators influence this association.
A typical study investigating the relationship between BAC level and road safety outcome involves a 2 × 2 comparison; for instance, numbers of BAC-positive vs. BAC-negative drivers may be compared between fatally and nonfatally injured drivers. In the following, we refer to drivers with the more unfavorable outcome (e.g., fatal) as cases and those with the less unfavorable outcome (e.g., nonfatally injured) as controls.
Potential moderators investigated and assumptions about how they may affect estimated effects of DUI are described in the following.
BAC level
Generally, because the inhibition of skills and abilities increases with higher BAC (Moskowitz and Fiorentino Citation2000; Ogden and Moskowitz Citation2004), we expect a positive association between BAC level and crash/injury risk.
Severity level and controls
A general assumption is that the effect of DUI is stronger for more serious outcomes (Desapriya et al. Citation2006). One may also expect to find stronger effects in study designs based on culpable vs. nonculpable drivers than in studies that do not take into account culpability (Gjerde et al. Citation2014).
The choice of controls may affect study results as well. Most empirical studies compare either crash-involved drivers at different severity levels or crash-involved vs. non-crash-involved drivers. The latter may yield overestimated effects of alcohol because the proportion of BAC-positive drivers may be overestimated among non-crash-involved drivers. For the latter, testing is not always compulsory and may be based on suspicion (McLean et al. Citation1980; Blomberg et al. Citation2005).
Control for confounding variables
Some studies have only reported crude effects of DUI, whereas others have controlled for potential confounding factors such as driver age/gender, speed limit, or time of day. The adjustment for such factors can potentially affect the estimated effects of BAC (Gjerde et al. Citation2015).
Other psychoactive substances
Most studies have not reported the presence of other psychoactive substances, presumably leading to the inclusion of some drivers influenced by other substances among both BAC-positive and BAC-negative drivers. However, some studies included only drivers not influenced by any other substances, and a third group of studies included drivers under the influence of alcohol and other substances.
Data source
Most studies are based on official crash statistics and some studies are based on hospital data. Such studies may suffer from selection bias due to, for example, the exclusion of crash scene fatalities and the types of injuries included in the comparison group (Koval et al. Citation2008; Chang et al. Citation2020).
Geography
The relationship between BAC and road safety outcomes may differ between geographic regions (e.g., Houwing et al. Citation2013; Gjerde et al. Citation2014). Geographic differences may reflect differences in the incidence of DUI and how DUI is related to other risk factors, among other things.
Methods
Literature search and data extraction
The aim of the literature search was to identify as many studies as possible within a limited time frame. We therefore used a simplified search strategy based on Google Scholar and screening reference lists of relevant studies. The search was conducted in June–July 2020 for studies from any year. Search terms combined “alcohol” or “drunk/drink driving” with “fatal*,” “injur*,” “crash,” or “accident.” Because records were sorted by relevance, each search was terminated when 10 consecutive pages of results did not yield a single relevant study. In total, we screened several thousand records.
To be included, a study had to report at least one estimate of the effect of a specified BAC level on a crash outcome. The main reasons for the exclusion of potentially relevant studies were as follows: Self-reported data, weights for meta-analysis could not be calculated, specific crash types (e.g., single-vehicle or motorcycle crashes only) or injury outcomes (e.g., specific type of complication at hospital), no BAC levels reported, or simulator study.
For each study, one or more effect estimates were calculated as the odds ratio (OR) of an unfavorable outcome (vs. a less unfavorable outcome) for BAC-positive drivers (vs. BAC-negative drivers). For each effect estimate, information was extracted about all predictor and moderator variables investigated in this study, and a weight was calculated based on the number of drivers in each study group, standard deviations, or t values.
Meta-analysis
Results from individual studies were summarized by means of meta-analysis; that is, weighted averages were calculated for effect estimates referring to the same BAC levels and the same type of outcome (Elvik Citation2013, Citation2016). Weights are proportional to the inverse of the variance (Elvik Citation2016). To identify moderator variables that may contribute to explaining parts of the heterogeneity in the results, analyses were conducted in 2 steps:
Exploratory moderator analysis: To identify relevant moderator variables, we first assessed one potential moderator variable at a time, controlling for BAC level and outcome severity. Statistically significant variables were then included as moderators in a joint metaregression model.
Final models: To calculate summary effects for different levels of BAC, metaregression analyses were conducted separately for different severity levels, controlling for moderators that were significant in the joint model in step 1.
All analyses were conducted with R v4.0.2 using the metafor package (Viechtbauer Citation2010). To account for expected covariance between estimates from the same study (typically several BAC levels), we used multilevel metaregression models with effects nested within studies. This approach assumes independent sampling errors of the estimates, which may be violated in this case (e.g., use of common control group for estimates from the same study), possibly biasing the standard errors and thus the confidence intervals (CIs). To correct for this, we constructed cluster robust estimates using a sandwich-type estimator in the metafor package. Hence, results are reported as odds ratios with robust 95% CIs.
Results
The literature search resulted in a total of k = 60 studies and n = 393 effect estimates (see references in Appendix 1, online supplement) for inclusion in meta-analysis.
Exploratory moderator analysis
In the following, results from the exploratory moderator analysis are described for each moderator. Details from the Moderator × Moderator analysis are given in Appendix 2 (Table A1, see online supplement). ORs and robust CIs for the joint metaregression are presented in . This metaregression model contains only those moderator variables that were found to be potentially relevant in the Moderator × Moderator analysis. All predictor variables in the model are defined as dummy variables. The ORs for the BAC dummy variables cannot be interpreted as summary effects of being BAC-positive vs. BAC-negative. For example, the OR for a BAC of 0.01–0.08 means that effect estimates referring to a BAC of 0.01–0.08 (vs. BAC-negative) are on average significantly greater than effect estimates referring to a BAC of 0.01–0.05 (intercept).
Figure 1. Odds ratios and robust 95% CIs from joint metaregression. X-axis cropped for readability. Dotted vertical line at OR = 1.
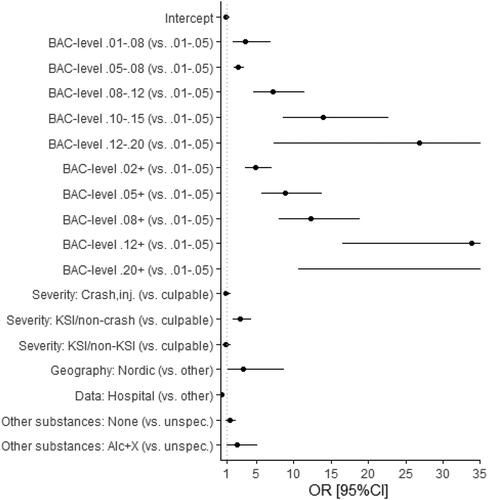
The OR before including moderators in the analysis (intercept-only model with clustering) was 7.16 (95% CI 5.46, 9.39), based on n = 280 effect estimates. Adding the moderators in the joint metaregression led to a proportional reduction in residual variance of 69% (pseudo-R2 = 0.69). More variation (2.5 times as much) was explained by differences between effect estimates (σ2 = 0.48) than between studies (σ2 = 0.21).
BAC level
Studies reported results for different BAC levels. We grouped BAC levels to minimize imprecise categorizations while limiting the number of categories, resulting in 5 closed intervals (e.g., 0.01–0.05) and 5 half-bounded intervals (e.g., 0.10+). For instance, a BAC range of 0.01–0.05 mainly includes results for this range but results for a BAC range of 0.02–0.05 or 0.04–0.05 are also included. All BAC levels are blood (not breath) alcohol levels.
The ORs for unfavorable outcomes increased with increasing BAC level (). The specific relationships are described below (final models).
Severity levels and controls
Severity levels for which effect estimates are available include killed or seriously injured (KSI), crash-involved/injured, and crash culpability. Controls were divided into 2 categories: Crash-involved at lower severity (e.g., involved in a nonfatal crash) and non-crash-involved.
The Moderator × Moderator analysis showed that studies using non-crash-involved controls for KSI drivers found larger effects on average than those using non-KSI drivers as controls (OR = 9.30; 95% CI 3.85, 22.46). However, only a few results are available for non-KSI crash-involved controls.
No systematic difference was found between non-crash-involved and crash-involved controls for culpability (OR = 0.90; 95% CI 0.43, 1.61) or for crash/injury (OR = 4.25; 95% CI 0.53, 39.51).
Some of the studies using non-crash-involved drivers as controls adjusted for potentially missing non-crash-involved drunk drivers (who refused testing). However, there was no statistically significant difference between adjusted and unadjusted effects (OR = 1.14; 95% CI 0.49, 2.64). Similarly, results from 2 studies that directly compared results with and without this type of adjustment (McLean et al. Citation1980; Connor et al. Citation2004) found no statistically significant difference.
Based on these results, in the joint metaregression, effect estimates were grouped as follows according to severity levels and controls: KSI vs. non-crash-involved, KSI vs. non-KSI, crash/injury (vs. uninjured or non-crash-involved), and culpability (vs. nonculpable or non-crash-involved; reference). The results indicate that only KSI (vs. non-crash-involved) differed significantly from culpability but not crash/injury. Therefore, in the final models, we distinguish only between KSI and crash/injury/culpability.
Control for confounding variables
In the Moderator × Moderator analysis, a comparison of adjusted and unadjusted ORs from studies that reported both showed that adjusted ORs were on average smaller (OR =0.87; 95% CI 0.72, 1.06). Because the difference was not statistically significant, this moderator was not included in the joint metaregression or the final models. All models are based on adjusted effect estimates whenever available and unadjusted effect estimates otherwise.
Substances other than alcohol
Effect estimates from individual studies were grouped according to the (possible) presence of other substances among BAC-positive and BAC-negative drivers: Unspecified, no other substances present, or other substances present among BAC-positive (but not among BAC-negative) drivers. Most studies were in the unspecified category, which means that information about the presence of other substances was lacking.
Relative to unspecified other substances, effect estimates were larger for both no other substances (OR = 1.71; 95% CI 1.20, 2.44) and alcohol plus other substance (OR = 2.90; 95% CI 1.42, 5.94) in the Moderator × Moderator analysis.
In the joint metaregression, “no other substances” was no longer statistically significant (OR = 1.36; 95% CI 0.86, 2.16), whereas “alcohol plus other substance” was still statistically significant (OR = 2.29; 95% CI 1.03, 5.07). In the final models, results that refer to alcohol plus other substances were excluded, and “no other substances” (vs. unspecified) was included as a moderator.
Data source
Studies based on hospital data yielded lower ORs than other studies on average. This was found in both the Moderator × Moderator analysis (OR = 0.10; 95% CI 0.05, 0.22) and the joint metaregression (; OR = 0.31; 95% CI 0.17, 0.56). Data source was therefore included in the final models.
Geography
We grouped the studies by geographical regions that maintained a high resolution while retaining at least 20 results per region: United States, Canada, Oceania, Asia, France, the Nordic countries, and other European countries.
In the Moderator × Moderator analysis, only the predictor for Nordic countries was statistically significant (OR = 4.72; 95% CI 1.07, 20.70; reference: United States). Results for other regions are available in Table A1 in Appendix 2.
The joint metaregression analysis also indicated that studies from Nordic countries found larger effects than studies from other regions (), although the difference was smaller in this analysis (OR = 3.19; 95% CI 1.17, 8.70).
Final models
Based on the results from the exploratory analysis, 2 final models were developed to predict the effects of BAC level on an unfavorable road safety outcome:
KSI (N = 129 effect estimates): For the most part based on results referring to KSI vs. non-crash-involved.
Injury/crash/culpabiliy (N = 136): For the most part based on injured (vs. uninjured crash-involved) or culpable (vs. nonculpable or non-crash-involved; n = 105) and some results for crash/injured vs. non-crash-involved (n = 35).
The type of control (non-crash-involved or less serious crash-involved) was statistically controlled for in the KSI model but not in the injury/crash/culpability model where no difference was found. Other moderator variables that were statistically controlled for included other substances (none vs. unspecified), data source (hospital vs. no hospital), and geography (Nordic vs. other).
and show the model-predicted ORs from both models for closed- and open-ended BAC intervals, respectively. Both figures include exponential trend lines for KSI and crash/injury/culpability. ORs with confidence intervals and full models are reported in Appendix 2 (Tables A3 and A4, see online supplement).
Figure 2. Model-predicted ORs from multilevel metaregression models for KSI and crash/injury/culpability; closed BAC intervals (statistically significant ORs in bold; OR = 242.9 for KSI in the BAC range 0.12–0.20).
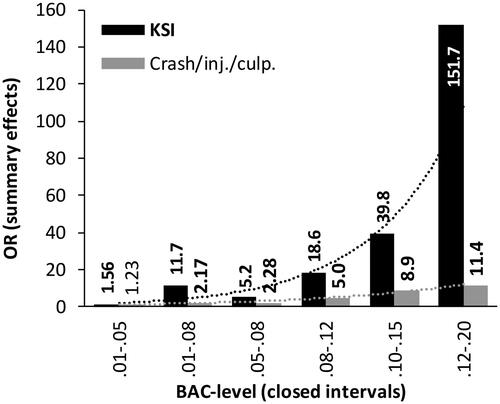
Figure 3. Model-predicted ORs from multilevel metaregression models for KSI and crash/injury/culpability; open-ended BAC intervals (statistically significant ORs in bold).
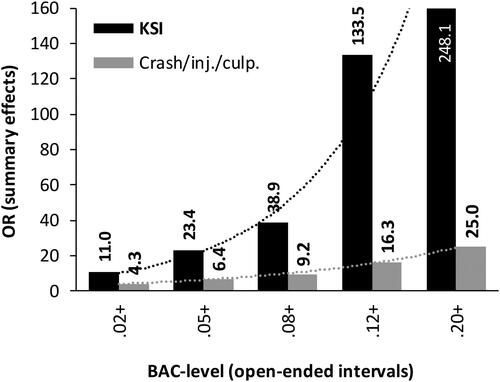
Most ORs had relatively large CIs, ranging from about half to twice the model-predicted OR. For the largest ORs, CIs were even larger.
In both models, ORs increased with increasing BAC, for both closed- and open-ended BAC intervals, with the exception of the BAC range 0.01–0.08 in the KSI model, the OR for which was greater than that for the BAC range 0.05–0.80. This was most likely due to general heterogeneity (overlapping CIs) and should not be interpreted as a lower BAC being less risky.
The ORs increased more at higher BAC levels, except for the highest level included (0.20+), and the ORs for KSI were generally higher than those for injury/crash.
Discussion
Meta-analysis indicated that the odds of unfavorable safety outcomes increased with increasing BAC levels and that the effects of increasing BAC were considerably larger for serious crashes than for other crashes. The relationship between BAC level and outcome was approximately exponential, similar to the one found by Blomberg et al. (Citation2009). Whereas the curve flattened from a BAC level of about 0.22 in the Blomberg et al. study, our study did not provide results at the same level of detail. However, even our curve cannot be extrapolated to BAC levels above about 0.20 because those driving with a BAC above about 0.20 are likely to be quite alcohol tolerant (Keall et al. Citation2004), but at some point even the most alcohol-tolerant drivers will be unable to drive.
The size of the effects of increasing BAC on crash/injury risk also resembled the results from Blomberg et al. (Citation2009) that are based on crashes of all severities. Our relative risk estimates for injury/crash were somewhat higher than the unadjusted risk estimates in the Blomberg et al. study. This was expected because Blomberg et al. argued that the unadjusted estimates were likely to be underestimated. Compared to the adjusted risk estimates in the Blomberg et al. study, our estimates were of about the same size or a bit lower. However, the estimates cannot be compared directly because of the grouping of BAC levels in our study. Our risk estimates for KSI were higher than the adjusted risk estimates in the Blomberg et al. study.
The odds of unfavorable safety outcomes increased most for more serious crashes, which was expected. Most effect estimates from the Nordic countries, where effect estimates generally were higher than in other countries, were for KSI. However, Nordic country was statistically controlled for in the metaregression model and thus was unlikely to have biased the results.
We identified several factors that contributed to explaining the heterogeneity in effect estimates and that were statistically controlled for in the final models.
First, studies using non-crash-involved controls for KSI drivers found greater effect estimates than other studies. Because most effect estimates for KSI were obtained in studies with non-crash-involved controls, the results for KSI can be interpreted as referring to the odds of being KSI vs. not being involved in any crash.
Second, effect estimates were on average smaller in studies based on hospital data than in other studies (OR = 0.35), which may be due to systematic bias (Koval et al. Citation2008; Chang et al. Citation2020). Rather than excluding hospital data–based studies, this potential bias was statistically controlled for to include the information these studies provided about the relationship between different BAC levels and outcome.
Third, effect estimates for the Nordic countries (Norway, Finland, Sweden) were on average greater than those for other countries. This may be due to a higher prevalence of aberrant behaviors and health problems among drunk drivers in Nordic countries, where drunk driving is less common than in other countries. We found no clear differences between remaining regions (Gjerde et al. Citation2014).
Effect estimates were not systematically different between studies that did and did not control for potential confounders (e.g., gender, age). Whether or not studies controlled for potential confounding variables was therefore not included in the final models. However, this finding should not be interpreted as support for reporting unadjusted effects only. Which variables were adjusted for and the effects of adjustment varied between studies. In some studies, such as Connor et al. (Citation2004), effects that were adjusted for factors related to alcohol impairment (like age, gender, and seat belt use) were smaller than unadjusted effects. Other studies found the opposite. For example, in the study by Blomberg et al. (Citation2009), adjusted effects of alcohol were far larger than unadjusted effects, mostly likely because of differences between case and control drivers in test refusal rates and availability of information about covariates, as well as higher BAC rates among hit-and-run drivers. When only demographic variables were controlled for but not these 3 factors, there were only slight differences between adjusted and unadjusted effects.
Meta-analysis showed that crash risk increased nearly exponentially with increasing BAC level and that the increase was far steeper for KSI crashes than for less serious crashes.
The extremely large effects on KSI crashes at high BAC levels indicated that even small decreases in the number of impaired drivers at these levels were likely to have large safety effects. Additionally, even at less extreme BAC levels, crash risk increased considerably more than for most illegal and prescription drugs, except possibly amphetamines and opiates (Elvik Citation2021).
Specific risk estimates for different BAC levels may, among other things, contribute to effective prioritization of road safety measures. For example, they can be used to compare expected effects on number of road injuries of measures against drunk driving for which effects on drunk driving are known from other studies, such as police enforcement (affects many drivers, mostly at relatively low BAC levels) and restrictive measures for DUI recidivists (affects fewer drivers but those who might otherwise drive at very high BAC levels). Or one might compare expected effects of police enforcement targeting drunk driving to expected effects of other measures for which expected effects are known.
Limitations
The study is based on a simplified literature search strategy, because a full systematic review is extremely time-consuming, and the benefit in terms of increased precision was not in proportion to the required resources. Inclusion of other relevant studies might have led to different results. However, because of the large number of included studies, the difference is unlikely to be substantial.
Disclosures
The authors have no conflicts of interest to report.
Supplemental Material
Download Zip (36.1 KB)Additional information
Funding
References
- Blomberg RD, Peck RC, Moskowitz H, Burns M, Fiorentino D. 2005. Crash risk of alcohol involved driving. Washington, DC: National Highway Traffic Safety Administration.
- Blomberg RD, Peck RC, Moskowitz H, Moskowitz H, Burns M, Fiorentino D. 2009. The Long Beach/Fort Lauderdale relative risk study. J Safety Res. 40(4):285–292. doi:10.1016/j.jsr.2009.07.002
- Chang YH, Lu TH, Hsu IL, Chen BL, Li CY. 2020. Risk of 30-day mortality and its association with alcohol concentration level among driver victims of motor vehicle crashes: comparison of population-and hospital-based designs. J Epidemiol Community Health. 74(10):815–823. doi:10.1136/jech-2020-213953.
- Connor J, Norton R, Ameratunga S, Jackson R. 2004. The contribution of alcohol to serious car crash injuries. Epidemiology. 15(3):337–344. doi:10.1097/01.ede.0000120045.58295.86
- Desapriya E, Pike I, Raina P. 2006. Severity of alcohol-related motor vehicle crashes in British Columbia: case – control study. Int J Inj Contr Saf Promot. 13(2):89–94. doi:10.1080/17457300500172685
- Elvik R. 2013. Risk of road accident associated with the use of drugs: a systematic review and meta-analysis of evidence from epidemiological studies. Accid Anal Prev. 60:254–267. doi:10.1016/j.aap.2012.06.017
- Elvik R. 2016. Association between increase in fixed penalties and road safety outcomes: a meta-analysis. Accid Anal Prev. 92:202–210. doi:10.1016/j.aap.2016.03.028
- Elvik R. 2021. Drugs, illicit and prescription. In: Vickerman R, editor. International encyclopedia of transportation. Elsevier; p. 221–227.
- Gjerde H, Bogstrand ST, Lillsunde P. 2014. Commentary: why is the odds ratio for involvement in serious road traffic accident among drunk drivers in Norway and Finland higher than in other countries? Traffic Inj Prev. 15(1):1–5. doi:10.1080/15389588.2013.780651.
- Gjerde H, Strand MC, Mørland J. 2015. Driving under the influence of non-alcohol drugs—An update. Part I: epidemiological Studies. Forensic Sci Rev. 27:89–114.
- Global Road Safety Partnership. 2007. Drinking and driving: a road safety manual for decision-makers and practitioners. Geneva. https://www.who.int/roadsafety/projects/manuals/alcohol/en/.
- Houwing S, Hagenzieker M, Mathijssen RPM, Legrand S-A, Verstraete AG, Hels T, Bernhoft IM, Simonsen KW, Lillsunde P, Favretto D, et al. 2013. Random and systematic errors in case–control studies calculating the injury risk of driving under the influence of psychoactive substances. Accid Anal Prev. 52:144–153. doi:10.1016/j.aap.2012.12.034.
- Keall MD, Frith WJ, Patterson TL. 2004. The influence of alcohol, age and number of passengers on the night-time risk of driver fatal injury in New Zealand. Accid Anal Prev. 36(1):49–61. doi:10.1016/S0001-4575(02)00114-8.
- Koval KJ, Cooley M, Cantu RV, Spratt KF. 2008. The effects of alcohol on in-hospital mortality in drivers admitted after motor vehicle accidents. Bull NYU Hosp Jt Dis. 66(1):27–34.
- McLean AJ, Holubowycz OT, Sandow BL. 1980. Alcohol and crashes: identification of relevant factors in this association. Adelaide, Australia: Road Accident Research Unit, University of Adelaide.
- Moskowitz H, Fiorentino D. 2000. A review of the literature on the effects of low doses of alcohol on driving-related skills. NHTSA Report No. DOT HS 809028. Springfield (VA): US Department of Transportation.
- Ogden EJ, Moskowitz H. 2004. Effects of alcohol and other drugs on driver performance. Traffic Inj Prev. 5(3):185–198. doi:10.1080/15389580490465201
- Schnabel E, Hargutt V, Krüger HP. 2010. Meta-analysis of empirical studies concerning the effects of alcohol on safe driving. Druid 6th European Framework Programme. Consulted at http://www.druid-project.eu/Druid/EN/deliverales-list/downloads/Deliverable_1_1_2.html.
- Viechtbauer W. 2010. Conducting meta-analyses in R with the metafor package. J Stat Soft. 36(3):1–48. doi:10.18637/jss.v036.i03.
