
 ?Mathematical formulae have been encoded as MathML and are displayed in this HTML version using MathJax in order to improve their display. Uncheck the box to turn MathJax off. This feature requires Javascript. Click on a formula to zoom.
Abstract
Objective
Before market introduction, the safety of highly automated driving systems needs to be assessed prospectively. BMW has developed a holistic approach for the assessment of the traffic safety impact by these systems in which stochastic traffic simulations play a significant role. A driver behavior model which represents realistic driver behavior ranging from performance in non-critical everyday driving toward performance in critical situations is key for this approach. To ensure trustworthy results, validation of the driver model is needed. The paper aims at demonstrating that the presented driver model acts realistically in different critical real-world traffic scenarios.
Methods
BMW has been developing the Stochastic Cognitive Model (SCM) which models cognitive processes in traffic situations. These processes range from information acquisition by gaze behavior, mental representation of the environment, recognition of situations from the visual information and reaction to the situation. The driver model combines these cognitive processes with stochastic driver parameters to obtain a variation in driver behavior in simulations. Especially visual attention modeling is key to realistic traffic interactions in simulations as this is the input for the sequential cognitive processes, i.e., the recognition of situations and the reaction to the situation. Modeling of driver’s gaze behavior with SCM is thus shown in this paper.
Results
SCM is applied in three critical real-world traffic scenarios in which gaze behavior, brake reaction times and time-to-collisions are evaluated and compared to the real-world data. Due to the stochastic approach not only a single SCM agent but a collective of virtual SCM test drivers is assessed. Results show that SCM is capable to simulate the influence of visual inattention on collision risk.
Conclusion
Realistic driver behavior in simulations can be achieved by using SCM. Especially in the presented critical scenarios SCM is able to represent real-world driving behavior which is determined particularly by its gaze behavior and subsequent reaction. Driving performance varies over different SCM agents which mean that different driving behavior can be simulated with SCM as well. However, the investigation in this paper included only three real-world cases. Therefore, further critical, and additionally non-critical scenarios need to be investigated in the future.
Introduction
Automated driving systems (ADS) are about to enter the automotive market. Highly related to their market introduction is the question about their safety. The European and German Ethics commission requests the demonstration of ADS’s positive effects on traffic safety respectively a “positive risk balance” (Di Fabio et al. Citation2017; Bonnefon et al. Citation2020). BMW has subsequently developed the “Positive Risk Balance” framework that serves as a holistic approach for developing safe ADS (Kauffmann et al. Citation2022).
The prospective safety assessment before market introduction is an essential part of the framework. Different approaches for the prospective safety assessment exist, ranging from driving simulator studies, real-world tests in a controlled environment (test-tracks) or field operational tests (Breuer et al. Citation2015). These approaches have different disadvantages—they are either time and resource consuming or they investigate only surrogate measures instead of the reduction of collisions. The simulation-based safety assessment approach (ISO Technical Report Citation2021) allows to overcome these issues by investigating a high number of scenarios with reasonable effort. It also measures the reduction of collisions. As the approach is based on simulations, validation and verification measures are crucial for proving the simulation’s correctness.
Approaches for simulation-based safety assessment
The ISO Technical Report, “Road vehicles—Prospective safety performance assessment of pre-crash technology by virtual simulation” describes four approaches for the simulation-based safety assessment (ISO Technical Report Citation2021). The first two approaches are accident-based approaches in which real-world crashes are either resimulated with or without modification. For these two approaches trajectories of the crash-involved traffic participants are available. But the trajectories are only available for a couple of seconds before the collision. Hence, these approaches are limited in their usefulness to evaluate the safety impact for ADS, which cover a larger scenario space and are in operation already before a scenario gets critical. The safety assessment of ADS needs to cover the effects during normal driving (e.g., comply with the speed limit) as well, i.e., the assessment needs to cover larger time frames.
According to ISO 21934 (ISO 202) the other two approaches are traffic-based approaches which derive scenarios by sampling the scenario parameters from real-world data distributions. While the third approach considers only a limited number of scenarios for the assessment (scenarios should represent the most relevant ones), the fourth approach covers a high number of scenarios to investigate the complete scenario space. Therefore, BMW sees a clear advantage in using the fourth approach for ADS. However, for this approach only the starting parameters are sampled, which means that no pre-defined trajectories exist. Therefore, a sophisticated driver behavior model is required to get realistic trajectories for the vehicles involved in the scenario. The model must represent the entire variety of realistic driver behavior ranging from non-critical driving to critical situations.
Driver models in traffic simulations
Car following models for traffic simulations have been used in traffic flow simulations for a long time. Widely known examples of these models are the Wiedemann model (Wiedemann Citation1974), the Gipps model (Gipps Citation1981) or the Intelligent Driver Model (Treiber et al. Citation2000). However, as these models have been designed for generating traffic flow, the human behavioral aspect in certain traffic scenarios is not sufficiently represented for assessing traffic safety. In particular, failures in the cognitive processes of road users, e.g., perception, are commonly reported as a major factor for criticalities and traffic collisions (van Elslande et al. Citation2008).
Other driver models focus on driver’s perception. An important approach in this context is the tau theory by Lee (Citation1976) or the steering control model by Salvucci and Gray (Citation2004) which basically link visual perception and vehicle control. The second model was further extended to a driver model using a cognitive architecture (Salvucci Citation2006). These cognitive models are especially useful for representing cognitive processes within humans. However, overall traffic flow, particularly traffic interactions between several road users, has so far not been part of these models.
Until now, there is no holistic driver model available that fulfills the requirements of being able to simulate realistic driving behavior for the fourth approach in the simulation-based safety assessment. A model for this approach shall
represent the overall traffic flow and traffic interactions realistically,
shall include behavioral aspect of perception, decision-making and reactions in all kinds of traffic scenarios, and
shall cover these aspects also in critical situations including behavior that might lead to collisions, e.g. incomplete perception of the situation or incorrect decisions.
Method
Overview of the Stochastic Cognitive Model
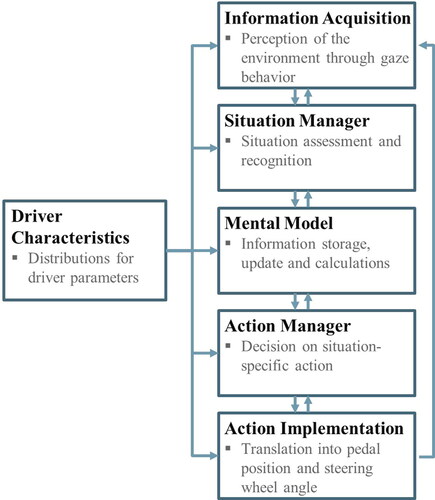
For these reasons BMW has been developing the Stochastic Cognitive driver Model (SCM) together with partners since 2014 within the open-source simulation environment openPASS (Witt, Ring et al. Citation2018, Appendix A1; Witt, Wang et al. Citation2018; Fries et al. Citation2022). Composed of six major modules SCM combines the implementation of cognitive processes from information acquisition via the mental representation of the environment to the assessment of the situation and the derivation of actions. These cognition processes take place in the modules Information Acquisition, Mental Model, Situation Manager, Action Manager, Action Implementation. The model is parameterized by stochastic means, which is achieved by the module Driver Characteristics, influencing all other modules. An overview is given in .
Figure 1. Overview of the modules in SCM.
Modeling of driver’s gaze behavior with SCM
As most of all relevant information during driving is perceived visually (Sivak Citation1996), the modeling of human visual perception constitutes an essential part of SCM. The realistic simulation of human gaze behavior is highly relevant, because all subsequent cognitive processes, including situation assessment as well as reaction to the given situation, are highly dependent on the information that comes from the gaze behavior. Thus, only visual data, which is perceived by the Information Acquisition module in SCM, is available for subsequent cognitive processes in SCM. The basic gaze allocation mechanism in SCM is a stochastic process i.e., allocation in a specific area of interest and gaze fixation time in a specific area of interest are sampled from distributions. These distributions were parametrized with real-world driving data. Gaze allocation of SCM is further influenced by top-down and bottom-up mechanisms.
A cognitive processing of visual information is possible by allocating the fovea centralis onto a visual stimulus. The fovea is the (circular) spot of sharpest sight in the center of the retina (line of sight) and is about 2° to 4° wide. Stimuli being presented eccentrically to the line of sight are perceivable in the peripheral field of view (elliptical shape; about 180° wide horizontally and 110° vertically). The quality of extracted information increasingly worsens with further distance between the stimulus and the fovea. However, the periphery is very sensitive toward changes in stimuli (e.g., movement, luminance, color). Therefore, perceived stimuli in the periphery cause an unconscious allocation of the fovea toward them (see e.g., Stapel et al. Citation2022). These mechanisms are part of the bottom-up (external) control of attention. The counterpart to this is the top-down (internal) control of attention. It is intentionally triggered, when vital information for a task execution is missing or uncertain (e.g., control mirror gazes before a lane change). As especially bottom-up mechanisms are highly relevant for the application in the first scenario presented in this paper (see following section) these mechanisms are further explained subsequently.
Changing fixation spots of the fovea upon gaze targets requires eye movements, which are commonly known as saccades. During a saccade, the visual cortex is not able to perceive any information (not consciously noticeable due to a grey stimulus interpolation), the saccadic suppression. The duration dsac of a saccade depends on the amplitude Δφ of angular movement of the eyes between gaze targets (Schweigert Citation2003):
(1)
(1)
The saccadic suppression starts already about 75 ms before the start of a saccade and lasts about 50 ms after the end of a saccade (Pannasch Citation2003). The start of a saccade after the appearance of a stimulus is delayed, which is called saccade latency lsac. The duration of the saccade latency depends on several factors, generally when the perception threshold of a specific stimulus on the spot of presentation φ on the retina is exceeded. There are several models available for different perception functions, e.g., perception of time-to-collisions (TTC) according to the tau theory (Lee Citation1976), luminance contrast perception (Adrian Citation1989), flicker fusion frequency (Ferry Citation1892; Porter Citation1898) and their change over φ (Lachenmayr Citation1995), change of other perception functions over φ according to cortical magnification (Rovamo and Virsu Citation1979). However, as a simplified approach, Lachenmayr (Citation1995) introduced a regression function for the saccade latency lsac, which depends only on the amplitude Δφ:
(2)
(2)
The gaze allocation time tgat defines the first part of the driver’s reaction time. It starts with the onset of a visual stimulus in the periphery and lasts until the start of cognitive processing of the visual information after gaze fixation. According to the explanations above, tgat can be calculated as:
(3)
(3)
Possible gaze angle amplitudes Δφ of a saccade are within ±90° to the left and right of the fovea because the maximum extend of the periphery is 180° horizontally. The resulting gaze allocation times of this model range from 313 ms up to 834 ms, which is within typical boundaries for human behavior in a traffic context. For instance, Ringhand (Citation2013) executed a human subject study on a proving ground, where subjects were surprised by pop-up obstacles while driving. The gaze allocation times observed for the baseline condition, which meant no assistance by forward collision warnings, ranged from 182 ms up to 819 ms (see Mai Citation2017).
Application of SCM in critical traffic scenarios
For demonstrating SCM’s capabilities, the model is applied in three critical real-world scenarios which have been identified from BMW’s field operation test data (see Appendix A2 for more information on the selection process of the scenarios). These scenarios are a passive cut-in maneuver, an emergency braking and a distraction scenario. Each scenario is investigated with SCM in 2,000 single simulation runs to account for the variation in the stochastic driver parameters of SCM. Each time SCM is being instantiated in a new simulation run, a new set of driver parameters are sampled from pre-defined distributions in the Driver Characteristics module (see Witt, Wang et al. Citation2018). These driver parameters (e.g., desired velocity and reaction time) are based on driving data (e.g., FOT data) and literature (regarding reaction times considering for instance from Gold et al. Citation2013). The objective of this study is to determine SCM’s reactions to the given situation and compare it to the real-world reaction of the human driver. For the application of SCM in simulations BMW uses the open-source simulation platform openPASS (see Appendix A1).
Scenario 1: passive cut-in scenario
Scenario 1 is a passive cut-in maneuver. The ego vehicle (EGO) drives in the left lane of a two-lane German motorway. Another vehicle (OV) passes illegally EGO on the right adjacent lane and starts a lane change to EGO’s lane. Due to a much slower vehicle (SV) on the left lane OV and EGO must perform an emergency braking maneuver during OV’s lane change. The scenario’s criticality is characterized by EGO’s braking acceleration of 8.8 m/s2. The initial setup of the vehicles is given in Appendix A3.
There are four relevant points in time within the scenario that are used for the comparison of the FOT data with the SCM simulation namely: the start of the lane change (tsolc), the activation of the indicator (tind), the end of lane change (teolc) and the start of deceleration by OV (tdecel). In this scenario the end of lane change is defined as the first point of time where OV is completely in the left lane.
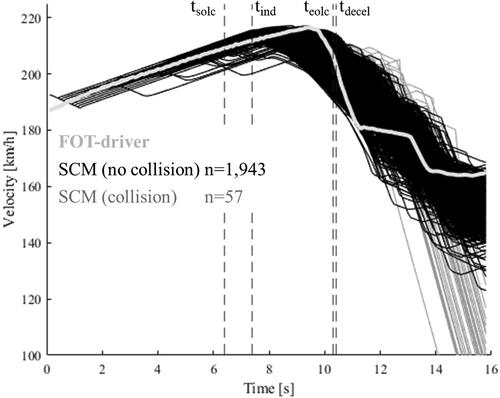
In 1,943 simulation runs of total 2,000 runs (97.2%) the SCM agent avoids a collision. In the remaining 57 runs (2.8%) a collision occurred. The velocity over time for both the FOT driver and SCM agents are given in . Like the FOT driver the SCM agents start to brake between the points in time tind (7.4 s) and teolc (10.3 s). Some SCM agents even start to brake before indicator activation. This shows the anticipation capabilities of SCM. These are triggered by the agents’ individual cooperative behavior, the overall situation, and the interpretation of the movement of other traffic participants.
Figure 2. Velocity of FOT driver and SCM agents over time in scenario 1. Start of lane change (tsolc), indicator activation (tind), end of lane change (teolc) and start of deceleration (tdecel) by OV are marked as reference points.
There is no difference in braking acceleration between collided and non-collided agents, see Figure A4. However, all the agents in simulation independently of the collision status had lower braking accelerations than the FOT driver. Reaction times after OV’s indicator activation are higher for agents with a collision (median of 1.6 s) compared to non-colliding agents (median of 0.6 s). A Kolmogorov-Smirnov test indicates a significant difference at the 5% level. Still, 75% of collided agents have a lower reaction time than the FOT driver, see Figure A5.
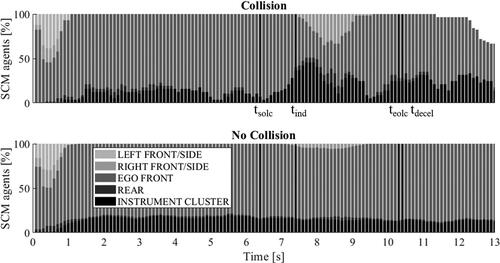
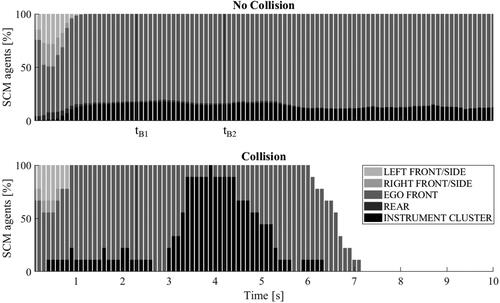
For the collision runs a larger overall amount of agents’ gaze fixation to the instrument cluster (IC) is found. Specifically, after the indicator activation (7.4 s) there is a peak of agents looking at the IC in the collision cases (45.6%) compared to the cases without any collision (14.5%), see . The described bottom-up mechanism within the gaze behavior of SCM leads to a subsequent peak of gaze allocations to the right due to the stimulus of the overtaking OV.
Figure 3. Distribution of gaze allocation of SCM agents over time for collision cases (n = 57) and no collision cases (n = 1,943) in scenario 1. Start of lane change (tsolc), indicator activation (tind), end of lane change (teolc) and start of deceleration (tdecel) by OV are marked as reference points.
For those agents looking in the IC at tind, a difference in brake reaction times is observable. The colliding agents have higher brake reaction times (median 1.25 s) compared to the non-colliding agents (median 0.8 s), see Figure A6. The Kolmogorov-Smirnov test indicates a significant difference at the 5% level.
For agents looking in the IC at tdecel there is no significant difference in the distribution of brake reaction times. The majority of agents is already braking at that point in time, see Figure A7. However, there is a difference in minimal TTCs for the entire time span in which the agents look at the IC. During this time the minimal TTCs are significantly lower for collided agents (median 1.3 s) compared to agents in the non-collision simulation runs (median 6.9 s), see Figure A8.
Scenario 2: emergency braking scenario
Scenario 2 is initiated by a hard braking maneuver of the vehicle in front (FV) with 5 m/s2 in a traffic jam scenario which leads to an emergency braking by the FOT driver (EGO) of 8.7 m/s2 and a minimal TTC of 1.5 s. Relevant points in time for this scenario are the first braking by FV at 2.3 s (tB1) and FV reaching braking accelerations higher than 4 m/s2 at 4.2 s (tB2). The initial setup of the vehicles is given in Appendix A4.
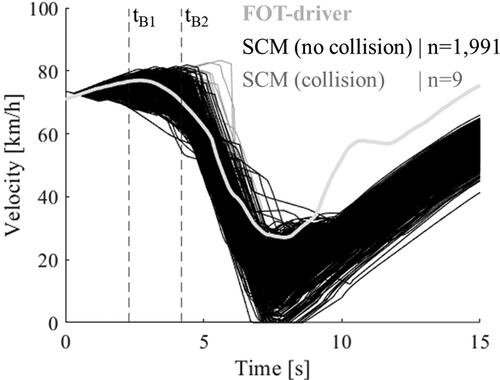
Out of the 2,000 simulation runs, 1,991 SCM agents prevent a collision and 9 SCM agents collide with FV. The velocity over time for both the FOT driver and SCM agents are given in . Like the FOT driver 96% SCM agents start to brake between tB1 and tB2. Some SCM agents start to brake earlier to already increase the following distance.
Figure 4. Velocity of FOT driver and SCM agents over time in scenario 2. First braking of FV (tB1) and FV reaching braking accelerations higher than 4 m/s2 (tB2) are marked as reference points.
Regarding braking accelerations, colliding SCM agents have significantly higher braking accelerations than SCM agents that prevent a collision, see Figure A11. The reason might be that colliding SCM agents have a longer reaction time. Their braking start later (median 3.1 s after start of braking by FV) than the non-colliding agents (median 1.7 s), see Figure A12. A Kolmogorov-Smirnov test indicates a significant difference between the distributions at the 5% level. The colliding SCM agents encounter a more critical situation and thus SCM reacts with stronger braking.
Regarding gaze behavior, all nine colliding agents are visually distracted after FV starts braking, see . The difference to those non-colliding agents is the duration of distraction while FV is braking. Durations for EGO’s distraction are lower for non-colliding agents (median 0.8 s) than for colliding agents (median 1.5 s), see Figure A13. A Kolmogorov-Smirnov test indicates a significant difference at the 5% level.
Figure 5. Distribution of gaze allocation of SCM agents over time for no collision cases (n = 1,991) and collision cases (n = 9) in scenario 2. First braking of FV (tB1) and FV reaching braking accelerations higher than 4 m/s2 (tB2) are marked as reference points.
Scenario 3: distraction scenario
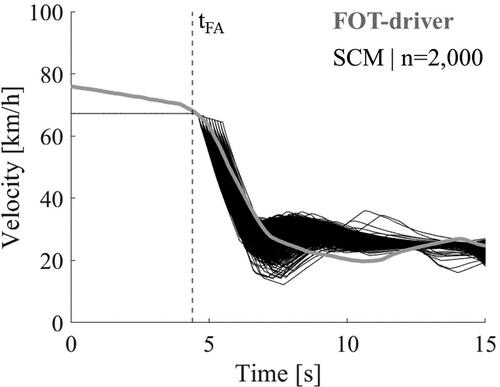
Scenario 3 is a scenario with a distracted FOT driver (EGO) while approaching a much slower front vehicle (FV). This leads to a hard braking maneuver of EGO when recognizing FV after looking back in the front area. EGO’s braking acceleration is 6.0 m/s2. Thus, in terms of EGO’s reaction it is the least critical scenario. The initial setup of the vehicles is given in Appendix A5. For the simulation of the FOT driver’s distraction, SCM’s gaze behavior and velocity is externally controlled until the point of time when the FOT driver looks back to the front area at 4,4 s (tFA) to ensure comparability.
In the 2,000 simulation runs, all SCM agents prevented a collision, which underlines the lower criticality of the scenario. The velocity over time for both the FOT driver and SCM agents are given in . Braking accelerations of all SCM agents are between 6.7 and 7.4 m/s2 compared to 6.0 m/s2 for the FOT driver. Brake reaction times of the SCM agents range between 0.4 and 1.2 s. The FOT driver’s brake reaction time is 0.7 s. Minimal TTCs for the scenario range from 2.1 s to 3.0 s for the SCM agents compared to 2.7 s for the FOT driver, see Figures A16–A18 in the Appendix.
Figure 6. Velocity of FOT driver and SCM agents over time in scenario 3. The FOT driver looking back to the front area (tFA) is marked as a reference point.
Discussion and conclusion
The vast majority of the SCM agents can cope with the selected critical FOT scenarios as the real drivers and avoid a collision (collision rate in simulation: 1st scenario 2.8%, 2nd scenario 0.5% and 3rd scenario 0%). This demonstrates that SCM can deal with critical scenarios. However, some agents collide in scenario 1 and 2. Results indicate that collisions are caused by visual distraction or having longer reaction times compared to non-collided agents or both. Not surprisingly, numerous authors found that visual inattention, caused by internal (e.g., in-vehicle devices) or external elements (e.g., billboards) is linked to a decrease in the perception of situational changes (Metz et al. Citation2011) and to a deterioration of driving performance (Kaber et al. Citation2012; Nabatilan et al. Citation2012). The results by Metz et al. (Citation2011) indicate that an inappropriate distribution of the visual attention, i.e., fewer and shorter road glances, might lead to a higher risk in collisions. Victor et al. (Citation2015) found that gaze behavior for crashes and near-crashes involved higher percentages of eyes-off-path glances a few seconds before the crash or critical event occurred compared to the examined baseline. These findings are highly consistent to the behavior that is shown by the colliding SCM agents. However, the percentage of colliding SCM agents cannot be validated. Firstly, different FOT drivers do not encounter the same scenario and secondly collisions are rare events which cannot be observed in the underlying FOT data. For further validation of this aspect separate studies, e.g., in a driving simulator, are necessary to account for these limitations.
Results indicate that some agents can anticipate critical situations ahead as they are reacting before the cut-in maneuver of the other vehicle and decelerating (scenario 1) or trying to increase the following distance before the braking of the front vehicle (scenario 2). However, as braking accelerations for all SCM agents in scenario 1 remain lower compared to the FOT driver and in scenario 3 are higher compared to the FOT driver, the question arises if the calculation for the intensity of braking is sufficient in the SCM model or whether further enhancements need to be made.
Overall, it can be concluded that the SCM driver behavior model is able to model and replicate real world driving behavior mechanisms in critical scenarios which is shown by three exemplary FOT scenarios. The focus of this paper is on gaze behavior. Effects of gaze behavior differences over a virtual driver population can be simulated, making virtual assessments and the impact of their cognitive processes, particularly perception, in traffic scenarios possible. Still, SCM visual distraction is momentarily simulated only by gaze fixations on the instrument cluster. Here, future developments regarding modeling other visual inattention causes might be beneficial to improve perception and reaction in critical situations.
It is important to note that a comprehensive validation of SCM requires further analyses—also in other driving scenarios measured during FOT or in drone data and in crash scenarios from German in-depth crash database GIDAS PCM. An analysis of SCM’s behavior in cut-in maneuvers compared to real world accidents is for instance given in Fries et al. (Citation2022). SCM is a quite complex driver behavior model, which cannot be described completely at detailed level in one paper. Thus, this paper focuses only on one aspect. Nevertheless, to make the model transparent for future research and development as well as to foster the scientific discussion about driver behavior models for simulation, the SCM model will be published as an open-source model in 2023.
Supplemental Material
Download Zip (2.8 MB)Disclosure statement
The authors declare we have no conflict of interest to disclose.
Additional information
Funding
References
- Adrian W. 1989. Visibility of targets: model for calculation. Light Res Technol. 21(4):181–188. doi:10.1177/096032718902100404.
- Bonnefon JF, Cerny D, Danaher J, Deviller N, Johansson V, et al. 2020. Ethics of Connected and Automated Vehicles: recommendations on road safety, privacy, fairness, explainability and responsibility. Horizon 2020 Commission Expert Group to advise on specific ethical issues raised by driverless mobility (E03659).
- Breuer J, von Hugo C, Mücke S, Tattersall S. 2015. Nutzerorientierte bewertungsverfahren von fahrerassistenzsystemen. In: Winner H, Hakuli S, Lotz F, Singer C, editors. Handbuch fahrerassistenzsysteme. Wiesbaden: Springer. p. 183–196. doi:10.1007/978-3-658-05734-3_12
- Di Fabio U, Broy M, Brüngger R, Eichhorn U, Grunwald A, et al. 2017. Ethic commission: automated and connected driving. Report of Ethics Commission Appointed by the German Federal Minister of Transport and Digital Infrastructure.
- Ferry ES. 1892. Persistence of vision. Am J Sci. s3–44(261):192–207. doi:10.2475/ajs.s3-44.261.192.
- Fries A, Fahrenkrog F, Donauer K, Mai M, Raisch F. 2022. Driver behavior model for the safety assessment of automated driving. IEEE Intelligent Vehicles Symposium (IV), Aachen, Germany. p. 1669–1674. doi:10.1109/IV51971.2022.9827404.
- Gipps PG. 1981. A behavioural car-following model for computer simulation. Transp Res Part B Methodol. 15(2):105–111. 10.1016/0191-2615(81)90037-0
- Gold C, Damböck D, Lorenz L, Bengler K. 2013. “Take over!” How long does it take to get the driver back into the loop? Proceedings of the Human Factors and Ergonomics Society Annual Meeting. Vol. 57(1). p. 1938–1942. doi:10.1177/1541931213571433.
- ISO Technical Report. 2021. Road vehicles—Prospective safety performance assessment of pre-crash technology by virtual simulation—Part 1: state-of-the-art and general method overview. ISO/TR 21934-1 2021.
- Kaber DB, Liang Y, Zhang Y, Rogers ML, Gangakhedkar S. 2012. Driver performance effects of simultaneous visual and cognitive distraction and adaptation behavior. Transp Res F Traffic Psychol Behav. 15(5):491–501. 10.1016/j.trf.2012.05.004
- Kauffmann N, Fahrenkrog F, Drees L, Raisch F. 2022. Positive risk balance: a comprehensive framework to ensure vehicle safety. Ethics Inf Technol. 24(1). 10.1007/s10676-022-09625-2.
- Lachenmayr BJ. 1995. Sehen und gesehen werden: Sicher unterwegs im Straßenverkehr. Aachen: Shaker.
- Lee DN. 1976. A theory of visual control of braking based on information about time to collision. Perception. 5(4):437–459. 10.1068/p050437
- Mai M. 2017. Fahrerverhaltensmodellierung für die prospektive, stochastische Wirksamkeitsbewertung von Fahrerassistenzsystemen der Aktiven Fahrzeugsicherheit [Ph.D. thesis]. Dresden: Technische Universität Dresden.
- Metz B, Schömig N, Krüger H-P. 2011. Attention during visual secondary tasks in driving: adaptation to the demands of the driving task. Transp Res F Traffic Psychol Behav. 14(5):369–380. doi:10.1016/j.trf.2011.04.004.
- Nabatilan LB, Aghazadeh F, Nimbarte A, Harvey CC, Chowdhury SK. 2012. Effect of driving experience on visual behavior and driving performance under different driving conditions. Cogn Tech Work. 14(4):355–363. doi:10.1007/s10111-011-0184-5.
- Pannasch S. 2003. Ereignisbezogene veränderungen der visuellen fixationsdauer [Ph.D. thesis]. Dresden: Technische Universität Dresden.
- Porter TC. 1898. Contributions to the study of flicker. Proc R Soc Lond. 63:347–356. doi:10.1098/rspl.1898.0041.
- Ringhand M. 2013. Der einfluss von kollisionswarnungen auf die reaktion in gefahrensituationen – überprüfung im fahrversuch [Diploma thesis]. Dresden: Technische Universität Dresden.
- Rovamo J, Virsu V. 1979. An estimation and application of the human cortical magnification factor. Exp Brain Res. 37(3):495–510. doi:10.1007/BF00236819.
- Salvucci DD. 2006. Modeling driver behavior in a cognitive architecture. Hum Factors. 48(2):362–380. 10.1518/001872006777724417
- Salvucci DD, Gray R. 2004. A two-point visual control model of steering. Perception. 33(10):1233–1248. 10.1068/p5343
- Schweigert M. 2003. Fahrerblickverhalten und nebenaufgaben [Ph.D. thesis]. Munich: Technical University of Munich.
- Sivak M. 1996. The information that drivers use: is it indeed 90% visual? Perception. 25(9):1081–1089. doi:10.1068/p251081.
- Stapel J, El Hassnaoui M, Happee R. 2022. Measuring driver perception: combining eye-tracking and automated road scene perception. Hum Factors. 64(4):714–731. doi:10.1177/0018720820959958.
- Treiber M, Hennecke A, Helbing D. 2000. Congested traffic states in empirical observations and microscopic simulations. Phys Rev E Stat Phys Plasmas Fluids Relat Interdiscip Topics. 62(2):1805–1824. 10.1103/PhysRevE.62.1805.
- van Elslande P, Naing C, Engel R. 2008. Analyzing human factors in road accidents. Summary Report. TRACE Report WP5. Deliverable 5.5.
- Victor T, Dozza M, Bärgman J, Boda C-N, Engström J, Flannagan C, Lee JD, Markkula G. 2015. Analysis of naturalistic driving study data: safer glances, driver inattention, and crash risk. Wahsington (DC): Transportation Research Board of the National Academy of Sciences.
- Wiedemann R. 1974. Simulation des straßenverkehrsflusses. Karlsruhe: Schriftenreihe des Instituts für Verkehrswesen, Heft 8, Habilitation.
- Witt M, Ring P, Wang L, Kompaß K, Prokop G. 2018. Modelling stochastic gaze distribution for multi-agent traffic simulation – impact of driver characteristics and situational traffic circumstances on the driver’s gaze behaviour. Kognitive Systeme. 2018. doi:10.17185/duepublico/48594.
- Witt M, Wang L, Fahrenkrog F, Kompaß K, Prokop G. 2018. Cognitive driver behavior modeling: influence of personality and driver characteristics on driver behavior. Adv Hum Aspects Transp. 786:751–763.