
Abstract
Objective
Parkinson’s disease (PD) impairs motor and non-motor functions. Driver strategies to compensate for impairments, like avoiding driving in risky environments, may reduce on-road risk at the cost of decreasing driver mobility, independence, and quality of life (QoL). It is unclear how PD symptoms link to driving risk exposure, strategies, and QoL. We assessed associations between PD symptoms and driving exposure (1) overall, (2) in risky driving environments, and (3) in relationship to QoL.
Methods
Twenty-eight drivers with idiopathic PD were assessed using the Movement Disorders Society–Unified Parkinson’s Disease Rating Scale (MDS-UPDRS) and RAND 36-Item Short Form Health Survey (SF-36). Real-world driving was monitored for 1 month. Overall driving exposure (miles driven) and risky driving exposure (miles driven in higher risk driving environments) were assessed across PD symptom severity. High traffic, night, and interstate roads were considered risky environments.
Results
18,642 miles (30,001 km) driven were collected. Drivers with PD with worse motor symptoms (MDS-UPDRS Part III) drove more overall (b = 0.17, P < .001) but less in risky environments (night: b = −0.35, P < .001; interstate roads: b = −0.23, P < .001; high traffic: b = −0.14, P < .001). Worse non-motor daily activities symptoms (MDS-UPDRS Part I) did not affect overall driving exposure (b = −0.05, P = .43) but did affect risky driving exposure. Worse non-motor daily activities increased risk exposure to interstate (b = 0.36, P < .001) and high traffic (b = 0.09, P = .03) roads while reducing nighttime risk exposure (b = −0.15, P = .01). Daily activity impacts from motor symptoms (MDS-UPDRS Part II) did not affect distance driven. Reduced driving exposure (number of drives per day) was associated with worse physical health–related QoL (b = 2.87, P = .04).
Conclusions
Results provide pilot data revealing specific PD symptom impacts on driving risk exposure and QoL. Drivers with worse non-motor impairments may have greater risk exposure. In contrast, drivers with worse motor impairments may have reduced driver risk exposure. Reduced driving exposure may worsen physical health–related QoL. Results show promise for using driving to inform clinical care.
Introduction
Our goal is to test the feasibility of using real-world sensor data from a drivers’ own vehicles as a digital biomarker of real-world risk, mobility, and disease severity in Parkinson’s disease (PD). PD is a common neurodegenerative disease that has increased in prevalence with population aging (Pringsheim et al. Citation2014; Elbaz et al. Citation2016), causing economic burden and reduced patient quality of life (QoL; Baernholdt et al. Citation2012). PD is characterized by loss of dopaminergic neurons in the brain, leading to motor dysfunctions like tremor and non-motor symptoms like cognitive impairments.
PD symptoms affect abilities needed to drive safely, increasing the possibility of a crash (Adler et al. Citation2000; Brock et al. Citation2022). To compensate for impairments, drivers with PD may reduce driving exposure and avoid riskier driving environments that carry higher risk of fatality or crash (e.g., night, complex commercial or highway roads; Plainis et al. Citation2006; U.S. Department of Transportation Citation2021). Though retrospective crash data show no significant difference in crash rates between drivers with PD and drivers without PD (Molnar et al. Citation2013; Thompson et al. Citation2018), drivers with PD had higher rates of failed on-road tests and simulator crashes (Classen et al. Citation2014; Uc et al. Citation2017). One possible explanation for the discrepancy between experimental data and real-world crash databases is that drivers with PD adopted self-restriction strategies. Drivers with PD who had worse QoL self-reported driving less (Stolwyk et al. Citation2015), especially in risky driving environments (Crizzle, Classen, et al. Citation2013; Crizzle, Myers, et al. Citation2013; Holmes et al. Citation2019).
Assessing how a patient with PD chooses to expose themselves to real-world risk is crucial for balancing on-road safety with the need to preserve mobility and QoL in advancing PD. New sensor technologies, which collect real-world driving data from a driver’s vehicle, can provide objective measures of on-road risk exposure (miles driven in risky driving environments) that overcome the limitations of current methods. Most current research on driving patterns of patients with PD has relied on self-report or clinical assessments, which may not accurately reflect real-world driver behavior (Uc et al. Citation2007; Blanchard et al. Citation2010). Patients may underreport risks due to fear of losing their driving license (Meindorfner et al. Citation2005), and clinicians may underestimate the impact of PD symptoms on real-world driver behaviors. Despite the importance of real-world evidence on PD driver risk exposure, studies of real-world PD driving are few. Crizzle and his colleagues found that drivers with PD made fewer trips in in risky environments (e.g., night, highway) compared to those without PD (Crizzle, Classen, et al. Citation2013; Crizzle, Myers, et al. Citation2013). However, these studies did not examine the number of miles driven in these situations and did not find a significant association between severity of PD motor symptoms and risky driving exposure. The study had some limitations, such as excluding patient self-reported daily life impacts and not adjusting for key covariates that confound driving exposure, like age or sex (Merickel et al. Citation2019). Furthermore, the impact of risky driving exposure on general QoL beyond PD-related disease impacts was not assessed.
Our study builds on these foundational studies to examine the feasibility of using real-world driver behaviors as a digital biomarker of real-world risk and disease severity in PD by linking driver exposure to environments with a range of risk to PD symptom severity and QoL. Clinicians need objective and continuous tools for evaluating how PD impacts a patient’s safety, mobility, and QoL. We propose that objective tracking of real-world driving in PD plays an important role in meeting this need. Combining clinical data with digital biomarkers of patient risk and mobility bolsters the ability to improve patient–clinician communication on how PD is impacting a patient’s daily life with the goal of creating effective care plans that balance the need to maintain safety and mobility of patients with PD (Meskó et al. Citation2017).
To achieve our goal, we recruited a sample of drivers with PD with a range of non-motor and motor symptoms, motivated by the need for greater clarity on how variable PD symptoms impact driver risk exposure strategies and patient QoL with real-world evidence. Driving was assessed across driver demographics, socioeconomics, PD motor and non-motor symptom severity, and QoL.
We hypothesized that (1) reduced driving exposure in overall and risky driving environments would be associated with worse PD symptoms and (2) reduced driving exposure would be associated with worse QoL.
Methods
Data collection
Study design
Drivers with PD visited the University Nebraska Medical Center (UNMC) to complete clinical and laboratory assessments, including demographic questionnaires at study start. At study start, a custom-built driving sensor instrumentation system was installed in their personal vehicles. Drivers were asked to drive as usual. After 4 weeks, the driving system was uninstalled.
The Institutional Review Board at UNMC approved the study (IRB No. 0322-17-FB). All participants consented to study participation.
Participants
All participants had diagnosis of idiopathic PD from a neurologist specializing in movement disorders, took dopaminergic medications to treat PD, and met UK Brain Bank Diagnostic Criteria. Each was legally licensed and met Nebraska licensure guidelines for vision (<20/40 with both eyes, corrected or uncorrected). Inclusion criteria were as follows: (1) 50–80 years old, (2) primary vehicle driver (>90% of driving time), (3) independently living, and (4) Mini-Mental Status Exam score >24. Exclusion criteria were (1) acute illness in the week before study start, (2) confounding medical conditions (e.g., neuropathy, pulmonary disease requiring chronic medication, congestive heart failure, major or active psychiatric disorder, history of diagnosed traumatic brain injury, neurodegenerative disease other than PD, active vestibular disease, or diagnosed sleep disorder), (3) confounding medications (e.g., stimulants, sedating antihistamines, narcotics), (4) substance use in the year before study entry, and (5) cardiovascular event in the 3 months before study entry. Participants were recruited through the UNMC PD clinic and community.
PD assessments
The Movement Disorders Society–Unified Parkinson’s Disease Rating Scale (MDS-UPDRS) was administrated by a neurologist specializing in movement disorders during on medication status. MDS-UPDRS measures PD severity across non-motor experiences of daily living (Part I), motor experiences of daily living (Part II), motor examination (Part III), and motor complications (Part IV). Higher scores indicate worse symptoms.
Naturalistic driving assessment
A custom-built driving sensor system was installed in each driver’s vehicle, including a camera box, Global Positioning System, accelerometer, and on-board diagnostic reader. The system turns on and off with vehicle ignition (one drive), collecting data every second.
Quality of life assessment
The RAND 36-Item Short Form Health Survey (SF-36) is a widely used health-related QoL questionnaire consisting of 36 items and includes 8 scales measuring physical health (physical functioning, physical role, bodily pain, and general health) and mental health (vitality, social functioning, emotional role, and mental health; Hays and Morales Citation2001). The Physical Component Summary (PCS) score and Mental Component Summary (MCS) scores were calculated using the weighted sums of the 8 scale scores and then transformed to 0 to 100 scales (Ware and Kosinski Citation2001), with higher scores indicating better QoL.
Modeling variables
Driving exposure outcomes
Driving exposure was assessed in 2 ways depending on the hypothesis: distance driven per drive and average number of drives per day.
Distance driven per drive (miles) was used to examine the association between PD symptom severity and driving exposure using mixed-effects linear regressions. Distance driven (skewed) was log-transformed for normality.
Average number of drives per day was computed by dividing total number of drives by the days of data collection and was used to examine the association between driving exposure and QoL using a multivariate linear regression model.
Disease severity covariates
Z-scores of 3 MDS-UPDRS subscale scores were used as a continuous covariate.
Driving environment covariates
Distance driven was analyzed across 3 driving environments: visibility, roadway type, and traffic density: Visibility: Roadway lighting conditions were categorized as “day” (sunrise–sunset) or “night” (sunset–sunrise) based on the start time of drives using the U.S. Naval Observatory database(reference level: “day”). Roadway type: Defined from Nebraska statutory speed limit data regulating roadway speed limits for roadways (Nebraska Department of Transportation Citation2018) and matched to driving data using Global Positioning System data and Nebraska Geospatial Information System (Molnar et al. Citation2013) databases. Only drives within Nebraska were analyzed. Roadway type consists of 3 categories: “residential” (20–25 mph [32–40 kph]), “commercial” (35–45 mph [56–72 kph]), and “interstate” (≥55 mph [≥88 kph]) roadways (reference level: “residential”). Traffic density: Determined by typical traffic patterns for time of day and categorized into 2 levels: “high” or “low.” Drives that started between 6:00 a.m. to 9:30 a.m. and 2:00 p.m. to 6:30 p.m. on weekdays or 11:00 a.m. to 6:00 p.m. on Saturday were assigned to “high” traffic density; other drives were assigned to “low” traffic density (Shah et al. Citation2019; reference level: “low”). Driving at night, interstate roads, and high traffic density were considered risky driving exposures.
Driver control covariates
Drivers typically drove further and more frequently if they were younger, male, or employed or during non-winter seasons (Myers et al. Citation2011). Driver covariates affecting driving exposure were adjusted in the mixed-effects linear regression models: age, education (years), sex (male vs. female), employment status (working [full-time or part-time] vs. not working [retired or volunteer]), and driving seasons (winter [November–March] vs. not winter [April–October]). Continuous variables were converted into z-scores.
Quality of life
PCS and MCS scores from the RAND SF-36 were modeled as continuous variables.
Data used in modeling
Two drivers drove primarily outside of Nebraska (>70% of their total drives) and were excluded due to unavailability of non-Nebraska Geographic Information System (GIS) data. With the remaining 28 drivers, drives were discarded if there was no vehicle movement during the drive (distance driven = 0 miles), vehicle speed data were missing >25%, or maximum drive speed was <5 mph (typically drives in parking lots or driveways). Analyses focused on drives occurring on the broadly defined categories of residential/commercial/interstate to improve interpretability of data. This resulted in discarding 163 drives (4.7% of data). Final models used 3,247 drives (18,641.7 miles driven).
Analytic plan
Our goals were to determine how PD symptom severity impacts driving in risky environments, real-world driving exposure, and QoL (physical and mental health).
H1: Reduced driving exposure overall and in risky driving environments are associated with worse PD symptoms.
Step 1—Base model
We first built base models using mixed-effects linear regressions with each of the MDS-UPDRS subscale scores as the primary predictor. The base models included adjustments for driver control covariates and the driving environment covariates. Nested random effects were included for each drive per participant.
Step 2—Interaction model
Base models were compared to models including the interaction of the driving environment covariates and the MDS-UPDRS scores. Model comparisons were tested using analysis of variance and Akaike’s information criterion.
Step 3—Select optimal model
The optimal model was selected based on the lowest Akaike’s information criterion value and a significant analysis of variance P value (.05). If there was no significant difference between the models, the simplest model (without the interaction) was selected.
H2: Reduced driving exposure is associated with worse QoL.
Linear regressions with either PCS or MCS as an outcome and average number of drives per day as a predictor, adjusting for age and sex that affect QoL, were used.
Results
Participants characteristics
shows demographic characteristics of 28 drivers with PD (mean age = 67.2 ± 6.1). There were more males (N = 20) than females (N = 8), reflecting typical sex distributions in the PD population (Wooten et al. Citation2004). shows PD characteristics of our study participants. Mean PD duration was 6.3 years and mean PD onset was 61.0 years of age. Median Hoehn & Yahr (H&Y) stage was 2, indicating predominately early to moderate PD severity. The 4 MDS-UPDRS subscales were well distributed, except for Part IV (mean = 3.4 ± 3.5, range = 0–13). We found that 10 drivers did not show any signs of motor complications (35.7%), which is typical for H&Y stage 2 because motor complications typically arise in later disease stages. Due to limited motor complications in this sample, MDS-UPDRS Part IV was not analyzed. With cutoff points to classify disease severity levels (Martínez-Martín et al. Citation2015), 24 drivers had mild symptoms, 3 had moderate symptoms, and 1 had severe symptoms in MDS-UPDRS Part I. Twenty-five drivers had mild symptoms and 3 had moderate symptoms in MDS-UPDRS Part II. MDS-UPDRS Part III showed a more broadly distributed range. Ten drivers had mild symptoms, 17 had moderate symptoms, and 1 had severe symptoms in MDS-UPDRS Part III. presents naturalistic and self-report driving characteristics. Supplementary Table 1 (see online supplement) provides a summary of the naturalistic driving characteristics of the drivers with PD across the risky driving environments analyzed. Supplementary Table 2 (see online supplement) provides descriptive statistics of risky driving exposure in the 3 risky environments we assessed (night, interstate, and high traffics) and across PD symptom severity.
Table 1. Participant demographic characteristics.
Table 2. Characteristics of Parkinson’s disease.
Table 3. Summary of naturalistic and self-report driving data.
H1: Reduced driving exposure in overall and risky driving environments are associated with worse PD symptoms
Across the 3 models for 3 MDS-UPDRS subscales, we found consistent results on how risky driving environments affected driving exposure. There were no differences between night and day and between low or high traffic density, but drivers with PD drove longer distances on interstate roads than on residential roads and shorter distances on commercial roads than on residential roads. Supplementary Table 3 (see online supplement) provides the entire results of the optimal models.
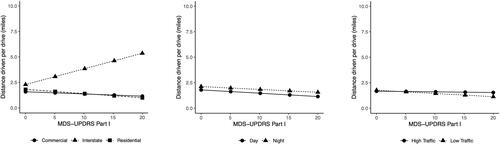
MDS-UPDRS Part I
PD symptom severity in non-motor experiences of daily living itself did not affect distance driven (b = −0.05, 95% confidence interval [CI] − 0.17 to 0.07, P = .43), but symptom severity affected distance driven in different environmental contexts (). Drivers with worse symptoms drove shorter distances per drive at night than during the day (b = −0.15, 95% CI −0.27 to −0.03, P = .01). This pattern reversed on road with high traffic density and interstate roadways. For the same amount of MDS-UPDRS Part I score increase, distances per drive increased more on interstates than on residential roads (b = 0.36, 95% CI 0.22–0.49, P < .001) and during high traffic density compared to low traffic density (b = 0.09, 95% CI 0.01–0.17, P = .03). Symptom severity did not affect distances driven on commercial compared to the residential roads (b = 0.05, 95% CI −0.03 to 0.13, P = .25).
Figure 1. Distance driven per drive related to MDS-UPDRS Part I (non-motor experiences of daily living) in 3 different environmental contexts (left: roadway type; middle: visibility; right: traffic density).
MDS-UPDRS Part II
The interactions between MDS-UPDRS Part II and environmental contexts did not improve model fit; therefore, the model without the interaction was selected. Symptom severity in MDS-UPDRS Part II did not independently affect how far a driver drove per drive (b = −0.09, 95% CI −0.19 to 0.02, P = .11).
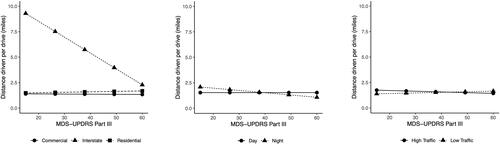
MDS-UPDRS Part III
Both motor symptom severity and environmental contexts affected distance driven per drive (). Drivers with worse motor symptoms drove longer distances overall (b = 0.18, 95% CI 0.06–0.29, P < .01). Importantly, drivers with worse motor symptoms drove shorter distances in all risky environmental contexts. Worse motor symptoms were associated with shorter distance driven at night than during the day (b = −0.35, 95% CI −0.51 to −0.20, P < .001), on an interstate roads compared to on residential roads (b = −0.23, 95% CI −0.35 to −0.10, P < .001), and during high traffic density compared to low traffic density (b = −0.14, 95% CI −0.22 to −0.06, P < .001).
Figure 2. Distance driven per drive related to MDS-UPDRS Part III (motor examination) in 3 different environmental contexts (left: roadway type; middle: visibility; right: traffic density).
H2: Reduced driving exposure is associated with worse QoL
PCS
Drivers with better physical QoL drove more (b = 2.87, 95% CI 0.18–5.57, P = .04). On average, drives increased by 0.7 drives per day for each 1-point increase in physical health–related QoL.
MCS
The average number of drives per day was not associated with mental health–related QoL (b = 1.36, 95% CI −1.03–3.75, P = .25).
Discussion
The goal of our study was to evaluate the utility of real-world driving data as a digital biomarker of risk, mobility, and disease severity in PD. We achieved this goal by assessing how long drivers with PD with a range of symptom severity travel in driving environments of varying risk and how exposure patterns associate with QoL. We found that increased driving exposure was associated with better physical health–related QoL for all drivers with PD and that how a the symptoms of a driver with PD impacted their driver exposure patterns associated with specific domains of PD impairment. Drivers with PD with worse motor symptoms had reduced overall driving exposure and exposure to risky driving environments. Drivers with PD with worse non-motor symptoms did not have reduced overall driving exposure but did have reduced exposure to riskier driving environments.
Our real-world driving data revealed that drivers with worse motor symptoms had decreased driving exposure, particularly in higher risk driving environments. Surprisingly, though we did not find a significant association between the degree of difficulty in non-motor daily activities and overall driving exposure, we found decreased driving exposure in a particular higher risk driving environment (i.e., interstate). This finding contrasts with previous literature, which has shown that non-motor symptoms, like cognitive or sleep dysfunction, play a key role in driver behavior (Crizzle et al. Citation2012) and can predict driving cessation in populations like those with PD (Cubo et al. Citation2010).
The results may indicate that our relatively young drivers with PD, who did not present with significant cognitive impairment, were more aware of their motor symptoms. When making decisions concerning on-road risk exposure, they may prioritize motor symptom presence over non-motor symptoms. Further research is needed to determine how motor and non-motor symptoms impact real-world safety in PD. However, prior driving literature demonstrates that non-motor symptoms in other aging populations result in measurable safety decline across a wide variety of environments (Merickel et al. Citation2019). This may mean that drivers with PD are adopting a maladaptive strategy by not appropriately considering risk from non-motor impairments. Another possible explanation is that patients with PD who are still driving are typically in earlier disease stages where motor symptoms may be the most predominant symptom (Cubo et al. Citation2010). Future studies should explore the effects of non-motor dysfunction on risky driving exposure in drivers with PD with worse non-motor symptom severity, to the extent possible in active drivers with PD.
In contrast to a prior study (Crizzle, Classen, et al. Citation2013) that did not find that motor symptom severity was associated with risky driving exposure using naturalistic driving data, we observed that more severe motor symptoms were associated with reduced exposure to risky driving environments in our PD sample. One possible explanation for the discrepancy between our findings and those of the previous study is the relatively small sample size in both studies, which may have biased results. A larger population of drivers with PD may be needed to determine reliability of these patterns. Another possible explanation of these different findings may be differences in analytic approaches. Specifically, in our models, we accounted for individual-level variance, along with adjusting for demographic covariates that might impact driving exposure. These analytic approaches provide a more stable estimate of population-level variance, even with a small sample size (Kahan et al. Citation2014). Crizzle and colleagues (Crizzle, Myers, et al. Citation2013) used the Pearson correlation, leading to the possibility that sample variability may have influenced the results to a greater extent.
In the current study, we observed a significant correlation between reduced physical health–related QoL and reduced driving exposure, highlighting the importance of preserving driver mobility for supporting QoL in persons with PD (Marottoli et al. Citation2000; Taylor and Tripodes Citation2001; Muslimović et al. Citation2008). Moreover, our real-world evidence suggests that drivers with PD have the greatest difficulty in night environments. We found a consistent and larger reduction in night driving than in the other risky driving environments we assessed (i.e., interstate road or high traffic density). Importantly, reduced night driving was associated with worse motor and non-motor dysfunction. Given the early disease stage of this PD sample, this may signal that difficulty driving at night is an early warning sign of advancing disease. Therefore, clinicians may wish to monitor night driving difficulties in patients to provide early interventions like nighttime transportation assistance.
Limitations of the present study include a small sample size comprising primarily patients with mild to moderate symptoms. Though this sample represents the typical, actively driving PD population (Cubo et al. Citation2010), it may influence results. Future studies can attempt to recruit, to the extent possible acknowledging driving cessation in PD progression, a larger sample of patients with PD with a broader symptom severity range. Though we excluded drivers who did not drive a primary vehicle, we cannot exclude the possibility that a few drives may have been by another driver and admit that these situations may be included in our data set also, because most drivers were males (71%), which is the typical sex difference in the prevalence of PD (Wooten et al. Citation2004), and the results may primarily reflect PD driving in males. Future studies could assess samples with a better balance between male and female drivers to confirm our findings and investigate sex differences.
Our pilot study demonstrated the initial feasibility of utilizing real-world driving exposure data as a digital biomarker of PD symptom severity across specific domains of PD impairment, risk, and QoL. These results show promise to motivate the clinical utility of using objective, real-world driving data in PD clinical care and trials. With further validation and replication of these results in a larger sample of drivers with PD, real-world driving data show promise to provide real-world evidence that can aid personalized PD clinical care, identify at-risk patients with PD for intervention, improve patient-clinician communication, and serve as an endpoint in clinical trials to evaluate the efficacy of new therapies to improve mobility of patients with PD while preserving safety.
Supplemental Material
Download Zip (26.9 KB)Acknowledgements
We thank our research and clinical team for coordinating this project. We thank Robin Taylor for editorial assistance.
Disclosure statement
The authors have no conflicts of interest to report.
Data availability
Data are not available to protect the privacy of the research participants.
Additional information
Funding
References
- Adler G, Rottunda S, Bauer M, Kuskowski M. 2000. The older driver with Parkinson’s disease. J Gerontol Social Work. 34(2):39–49. doi:10.1300/J083v34n02_05.
- Baernholdt M, Hinton I, Yan G, Rose K, Mattos M. 2012. Factors associated with quality of life in older adults in the United States. Qual Life Res. 21(3):527–534. doi:10.1007/s11136-011-9954-z.
- Blanchard RA, Myers AM, Porter MM. 2010. Correspondence between self-reported and objective measures of driving exposure and patterns in older drivers. Accid Anal Prev. 42(2):523–529. doi:10.1016/j.aap.2009.09.018.
- Brock P, Oates LL, Gray WK, Henderson EJ, Mann H, Haunton VJ, Skelly R, Hand A, Davies ML, Walker RW. 2022. Driving and Parkinson’s disease: a survey of the patient’s perspective. J Parkinsons Dis. 12(1):465–471.
- Classen S, Brumback B, Monahan M, Malaty II, Rodriguez RL, Okun MS, McFarland NR. 2014. Driving errors in Parkinson’s disease: moving closer to predicting on-road outcomes. Am J Occup Ther. 68(1):77–85. doi:10.5014/ajot.2014.008698.
- Crizzle AM, Classen S, Lanford D, Malaty IA, Okun MS, Wagle Shukla A, McFarland NR. 2013. Driving performance and behaviors: a comparison of gender differences in Parkinson’s disease. Traffic Inj Prev. 14(4):340–345. doi:10.1080/15389588.2012.717730.
- Crizzle AM, Classen S, Uc EY. 2012. Parkinson disease and driving: an evidence-based review. Neurology. 79(20):2067–2074. doi:10.1212/WNL.0b013e3182749e95.
- Crizzle AM, Myers AM. 2013. Examination of naturalistic driving practices in drivers with Parkinson’s disease compared to age and gender-matched controls. Accid Anal Prev. 50:724–731. doi:10.1016/j.aap.2012.06.025.
- Crizzle AM, Myers AM, Roy EA, Almeida QJ. 2013. Drivers with Parkinson’s disease: are the symptoms of PD associated with restricted driving practices? J Neurol. 260(10):2562–2568. doi:10.1007/s00415-013-7017-9.
- Cubo E, Martinez Martin P, Gonzalez M, Bergareche A, Campos V, Fernández JM, Alvárez M, Bayes A; Elep Group. 2010. What contributes to driving ability in Parkinson’s disease. Disabil Rehabil. 32(5):374–378. doi:10.3109/09638280903168507.
- Elbaz A, Carcaillon L, Kab S, Moisan F. 2016. Epidemiology of Parkinson’s disease. Rev Neurol (Paris). 172(1):14–26. doi:10.1016/j.neurol.2015.09.012.
- Hays RD, Morales LS. 2001. The RAND-36 measure of health-related quality of life. Ann Med. 33(5):350–357. doi:10.3109/07853890109002089.
- Holmes JD, Alvarez L, Johnson AM, Robinson AE, Gilhuly K, Horst E, Kowalchuk A, Rathwell K, Reklitis Y, Wheildon N. 2019. Driving with Parkinson’s disease: exploring lived experience. Parkinson’s Dis. 2019:1–7. doi:10.1155/2019/3169679.
- Kahan BC, Jairath V, Doré CJ, Morris TP. 2014. The risks and rewards of covariate adjustment in randomized trials: an assessment of 12 outcomes from 8 studies. Trials. 15(1):139. doi:10.1186/1745-6215-15-139.
- Marottoli RA, de Leon CFM, Glass TA, Williams CS, CooneyJrLM, Berkman LF. 2000. Consequences of driving cessation: decreased out-of-home activity levels. J Gerontol B Psychol Sci Soc Sci. 55(6):S334–S340. doi:10.1093/geronb/55.6.s334.
- Martínez-Martín, P, Rodríguez-Blázquez, C, Arakaki, T, Arillo, VC, Chaná, P, Fernández, W, Garretto, N, Martínez-Castrillo, JC, Rodríguez-Violante, M, Serrano-Dueñas, M, et al. 2015. Parkinson’s disease severity levels and MDS-Unified Parkinson’s Disease Rating Scale. Parkinsonism Relat Disord. ;21(1):50–54. doi:10.1016/j.parkreldis.2014.10.026.
- Meindorfner C, Körner Y, Möller JC, Stiasny-Kolster K, Oertel WH, Krüger HP. 2005. Driving in Parkinson’s disease: mobility, accidents, and sudden onset of sleep at the wheel. Mov Disord. 20(7):832–842. doi:10.1002/mds.20412.
- Merickel J, High R, Dawson J, Rizzo M. 2019. Real-world risk exposure in older drivers with cognitive and visual dysfunction. Traffic Inj Prev. 20(sup2):S110–S115. doi:10.1080/15389588.2019.1688794.
- Meskó B, Drobni Z, Bényei É, Gergely B, Győrffy Z. 2017. Digital health is a cultural transformation of traditional healthcare. Mhealth. 3:38. doi:10.21037/mhealth.2017.08.07.
- Molnar LJ, Charlton JL, Eby DW, Bogard SE, Langford J, Koppel S, Kolenic G, Marshall S, Man-Son-Hing M. 2013. Self-regulation of driving by older adults: comparison of self-report and objective driving data. Transp Res Part F Traffic Psychol Behav. 20:29–38. doi:10.1016/j.trf.2013.05.001.
- Muslimović D, Post B, Speelman JD, Schmand B, de Haan RJ; CARPA Study Group. 2008. Determinants of disability and quality of life in mild to moderate Parkinson disease. Neurology. 70(23):2241–2247. doi:10.1212/01.wnl.0000313835.33830.80.
- Myers AM, Trang A, Crizzle AM. 2011. Naturalistic study of winter driving practices by older men and women: examination of weather, road conditions, trip purposes, and comfort. Can J Aging. 30(4):577–589. doi:10.1017/S0714980811000481.
- Nebraska Department of Transportation. Speed Limit Brochure. 2018. [accessed 2022 Oct 1]. https://dot.nebraska.gov/media/gaqhtei0/speed-limit-brochure.pdf.
- Plainis S, Murray I, Pallikaris I. 2006. Road traffic casualties: understanding the night-time death toll. Inj Prev. 12(2):125–128. doi:10.1136/ip.2005.011056.
- Pringsheim T, Jette N, Frolkis A, Steeves TD. 2014. The prevalence of Parkinson’s disease: a systematic review and meta-analysis. Mov Disord. 29(13):1583–1590. doi:10.1002/mds.25945.
- Shah V, Merickel J, Chakraborty P. 2019. Quantifying driver speed behavior from real-time physiology in type 1 diabetes. Paper presented at: Proceedings of the 5th International Symposium on Future Active Safety Technology toward Zero Accidents (FAST-zero ’19), September 9–11, Blacksburg, VA.
- Stolwyk RJ, Scally KA, Charlton JL, Bradshaw JL, Iansek R, Georgiou-Karistianis N. 2015. Self-regulation of driving behavior in people with Parkinson disease. Cogn Behav Neurol. 28(2):80–91. doi:10.1097/WNN.0000000000000058.
- Taylor BD, Tripodes S. 2001. The effects of driving cessation on the elderly with dementia and their caregivers. Accid Anal Prev. 33(4):519–528. doi:10.1016/s0001-4575(00)00065-8.
- Thompson T, Poulter D, Miles C, Solmi M, Veronese N, Carvalho AF, Stubbs B, Uc EY. 2018. Driving impairment and crash risk in Parkinson disease: a systematic review and meta-analysis. Neurology. 91(10):e906–e916. doi:10.1212/WNL.0000000000006132.
- Uc EY, Rizzo M, Anderson SW, Sparks JD, Rodnitzky RL, Dawson JD. 2007. Impaired navigation in drivers with Parkinson’s disease. Brain. 130(Pt 9):2433–2440. doi:10.1093/brain/awm178.
- Uc EY, Rizzo M, O'Shea AMJ, Anderson SW, Dawson JD. 2017. Longitudinal decline of driving safety in Parkinson disease. Neurology. 89(19):1951–1958. doi:10.1212/WNL.0000000000004629.
- U.S. Department of Transportation. Highway Statistics. 2021. [accessed 2022 Oct 1]. https://www.fhwa.dot.gov/policyinformation/statistics/2021/.
- Ware JE, Kosinski M. 2001. Interpreting SF&-36 summary health measures: a response. Qual Life Res. 10(5):405–413. doi:10.1023/a:1012588218728.
- Wooten G, Currie L, Bovbjerg V, Lee J, Patrie J. 2004. Are men at greater risk for Parkinson’s disease than women? J Neurol Neurosurg Psychiatry. 75(4):637–639. doi:10.1136/jnnp.2003.020982.
