
Abstract
Objective
Rear-end crashes cost the most out of any crash type to the Compulsory Third Party insurance scheme of Queensland. Rear-end crashes are also one of the most common types of crashes, peaking as the most common type of crash in Queensland in 2019. This study investigated the environmental, driver, and vehicle characteristics associated with rear-end collisions in Queensland, Australia.
Methods
A totle of 367,230 crashes in the Queensland crash database between 2001 and 2021 were used to identify crash trends in Queensland, particularly related to rear-end crashes. For crashes between 2015 and 2021, additional information was gathered and allowed further analysis of factors contributing to rear-end crashes using the quasi-induced exposure method. Two binary classification tree models were used. Model 1 investigated the environmental characteristics that predicted a crash being a rear-end or not. Model 2 investigated the controller and vehicle characteristics that predict a rear-end crash-involved vehicle to be either the striking (at-fault) or struck (not-at-fault) vehicle.
Results
Model 1 indicated that rear-end crashes were overrepresented in urban areas and major cities and where speed limits exceeded 50 km/h. Model 2 indicated that occupants of struck vehicles (not at-fault) were more likely to be severely injured than the striking (at-fault) vehicles in rear-end crashes. License type and vehicle type also influenced the frequency and severity of rear-end crashes.
Conclusion
Rear-end crashes can be unjust in that the not-at-fault party is typically more severely injured. Results from the current study suggest that keeping speed limits no higher than 50 km/h could help reduce the severity of rear-end crashes. Increased enforcement of safe following distances could also assist in preventing road trauma as a result of rear-end crashes.
Introduction
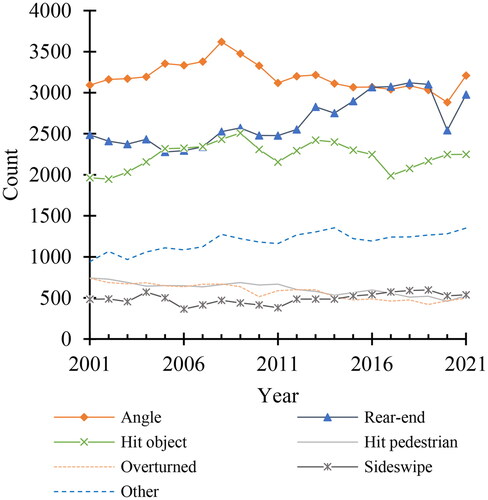
Rear-end crashes, wherein one vehicle crashes into the one in front of it, are among the most common types of crashes in Australia Beck (Citation2015). Approximately one-quarter of rear-end crashes lead to serious injuries or fatalities (Beck Citation2015). Rear-end crashes represent two-fifths of all Compulsory Third Party (CTP)Footnote1 insurance claims but represent a quarter of all CTP costs in Australia (Beck Citation2015). In Queensland, rear-end crashes account for 21% of police-reported collisions but 36% of claims in Queensland’s CTP scheme in the years 2000 to 2010, representing a social cost of AU$1.7 billion (Rakotonirainy et al. Citation2017). The data from the current study suggest that the incidence of rear-end crashes has increased since 2003 and reached a peak in 2019, when it became the single most frequent type of crash for that year (see ). Thus, the social burden of rear-end crashes is significant, and this burden has been growing in recent years.
Figure 1. Count of crashes by year and crash nature in Queensland from 2001 to 2021.
Factors associated with rear-end crashes
Given the serious burden that rear-end crashes present, many studies have investigated risk factors associated with rear-end crashes. One Australian study found that drivers who are distracted, younger, and male are associated with being the at-fault driver in rear-end crashes, whereas older and female drivers are at greater risk of sustaining injuries (Beck Citation2015). Larger vehicles have an increased risk of being in a rear-end crash, either as the struck or striking vehicle, and collisions involving larger vehicles and passenger cars tend to be more severe (Beck Citation2015). Road environments that have higher levels of traffic, higher speeds, and intersections—particularly signalized intersections and/or intersections with poor vertical and horizontal alignment—are also associated with a greater risk of rear-end crashes (Beck Citation2015).
Yan et al. (Citation2005) conducted analyses of 2001 Florida crash data to investigate crash propensity for striking or struck vehicles in multivehicle rear-end collisions at signalized intersections. They found that the risk of rear-end crashes is greater for 6-lane highways than for 2-lane and 4-lane highways. Higher traffic volumes were also associated with greater rear-end crash risk. Furthermore, when horizontal and vertical grades are simultaneously present, the risk of rear-end collisions can double, and the risk of rear-end crashes is positively associated with the speed limit, especially when the limit is higher than 40 mph (64 km/h). Mohamed et al. (Citation2017) found in their crash data analysis in the Emirate of Abu Dhabi that rear-end crashes represented 25% of total crash fatalities, and the driving characteristics found to significantly affect rear-end crash severity were tailgating, driving too fast, years of experience, and the issue location of the driving license. Vehicle type, road characteristics, road type, and the number of lanes were also related to the severity of rear-end crashes (Mohamed et al. Citation2017). Seacrist et al. (Citation2016) studied rear-end collision data from a naturalistic driving study in the United States involving 3,240 volunteer drivers of all ages. Seacrist et al. (Citation2016) found that novice teens had a 5.7 times higher rate of being a striking driver in a rear-end crash, per million miles driven, than adults.
Despite the great impact of rear-end crashes in road safety statistics, rear-end crashes have been relatively underresearched, partly because of their tendency to be of lower severity, compared to other crashes such as angle and head-on collisions. As the literature shows, the factors most associated with rear-end crashes vary from study to study and from jurisdiction to jurisdiction (Yan et al. Citation2005; Mohamed et al. Citation2017), highlighting the relevance of research into rear-end crashes in each region to understand the local associated factors.
The analysis of crash data to identify risk factors has been largely done using binary logistic regressions in the literature, including for rear-end crashes (e.g., Yan et al. Citation2005; Mohamed et al. Citation2017; Champahom et al. Citation2020). Though this approach is scientifically sound, such models require assumptions to be met. Slikboer et al. (Citation2020) showed in a systematic review that, when applied to crash data, statistical assumptions related to multicollinearity are rarely met and result in models of poor statistical rigor. Therefore, they recommended using machine learning techniques to overcome correlations in the data. Classification trees are one example of a machine learning technique. They do not require specific relationships and independence between variables to be assumed. These models are effective in dividing crash data into homogeneous groups, identifying complex crash patterns and driver, vehicle, and environmental factors, and have been successfully applied to rear-end crashes (Yan and Radwan Citation2006).
Investigating the frequency of incidents in crash data without accounting for exposure can be misleading. Some environmental, personal, and vehicle circumstances are generally more frequently occurring than others, and thus might results in crashes more frequently merely because of the greater risk exposure. Some studies have accounted for exposure by using the quasi-induced exposure method in a variety of contexts (Weng et al. Citation2019; Yue et al. Citation2020), including in the context of rear-end crashes, wherein at-fault drivers are compared with not-at-fault drivers (Yan et al. Citation2005; Yan and Radwan Citation2006; Champahom et al. Citation2019), although never, to the best of the authors’ knowledge, in Queensland or Australia. This is despite the increasing prevalence of rear-end crashes in Australia and the fact that rear-end crashes are the largest source of compensation claims compared to any other crash type (Beck Citation2015). In some jurisdictions, the recording of at-fault and not-at-fault drivers is not conducted (Sharafeldin et al. Citation2022), but in Queensland it is and so the need for an analysis of the factors associated with rear-end crashes is greatly needed. One reason that could partly explain why rear-end crashes have been overlooked is that they are associated with being a relatively lower severity type of crash, and the Vision Zero approach to road safety aims to eliminate predominantly fatal and severe injury crashes (Johansson Citation2009).
Current study
The current study aims to return focus to rear-end crashes, because they are identified as the leading crash type associated with compensation claims in Queensland (Beck Citation2015). This study investigated rear-end risk factors using a nonparametric approach (binary classification trees), to overcome issues with logistic regression assumptions that are often not met, and the quasi-induced exposure method. Champahom et al. (Citation2019) successfully applied a quasi-induced exposure analysis of rear-end crashes on Thailand highways, whereas Yan et al. (Citation2005) only applied that method to signalized intersections. Therefore, this study is more comprehensive, because all road scenarios were included in the analyses. The not-at-fault assumption in the quasi-induced exposure method was evaluated by Zhao et al. (Citation2019). They found that this method is robust, even across different geographical levels, justifying the use of the quasi-induced exposure method across a wide data set of crashes. Thus, this study aimed to answer two research questions:
What are the environmental characteristics most associated with rear-end crashes in Queensland?
What are the driver and vehicle characteristics most associated with being at fault in a 2-vehicle rear-end crash in Queensland?
Methods
Crash database
The crash database used was provided by Transport and Main Roads, Government of Queensland. Data included vehicle, driver, and environment characteristics as well as injury levels that were associated with road traffic crashes during the years 2015 to 2021. Crash type history was also obtained from the online Transport and Main Roads (Citation2023) database for the years 2001 to 2021 to investigate crash trends, particularly for rear-end crashes.
Classification trees
To answer the 2 research questions, 2 binary classification tree models were run using R (R Core Team Citation2022) v4.2.2 and the rpart library (Therneau and Atkinson Citation2022) v4.1.19 on the 2015–2021 crash data, following the approach presented in Yan and Radwan (Citation2006). A quasi-exposure method was used because it is a valid approach for multivehicle crashes (Stamatiadis and Deacon Citation1997) when exposure cannot be obtained through other means. The trees were trained with 80% of the data, and the remainder were used as a test set. The training set was used to first fit a fully grown tree on the entire data and then pruned to the smallest trees with the lowest misclassification loss using a 10-fold cross-validation approach. The performance (specificity, sensitivity, and accuracy) of the final tree was evaluated on the test set.
Tree Model 1: Environmental characteristics
The first model focused on the environmental factors associated with rear-end crashes compared with all other crashes. The environmental factors investigated in the model were crash severity; weekday/weekend; day/night; roadway features; whether it was an intersection; month; Accessibility/Remoteness Index of Australia; urban or rural; whether traffic controls were present; the speed limit of the road; road surface conditions; atmospheric conditions; lighting conditions; horizontal alignment; vertical alignment; whether alcohol or drugs were a contributing crash factor; whether the driver was under the influence of alcohol or drugs; whether speeding, fatigue, or distraction were contributing crash factors; whether a road rule was disobeyed by the driver; whether a give way road rule was disobeyed by the driver; and whether any other road rule disobeyed by the driver was a contributing crash factor.
Tree Model 2: Driver characteristics
The second model explored the driver and vehicle characteristics associated with at-fault (striking) drivers in rear-end collisions, compared with not-at-fault (struck) drivers in rear-end collisions. Because some rear-end crashes included more than 1 driver at fault, only the crashes that involved 2 vehicles and identified 1 driver at fault were included in the analyses for tree model 2. The included factors were detailed age group, age group, gender, whether they had a license, license type, controller intention, unit type, most severe injury of the unit, whether the controller was under the influence of drugs or alcohol, and whether the controller was speeding, fatigued, distracted, or unlicensed.
Results
Types of crashes and trends
A total of 367,230 crashes were recorded in the crash data set between 2001 and 2021. presents the data in terms of crash nature and severity of crashes.
Table 1. Crashes by crash nature and severity of crash.
shows that rear-end crashes represent 14.4% of all hospitalization crashes, which is the third most common type of crash for hospitalization crashes. Rear-end crashes are the most common type of crash when the crash severity is “medical treatment” or “minor injury.” Rear-end crashes are relatively less common among fatal crashes, representing just 4.0% of fatal crashes.
Analyses showed that in Queensland, rear-end crashes rose from being the third most common crash type in 2005 to the most common in 2018–2019 (see ).
Tree Model 1: Environmental characteristics contributing to rear-end crashes
A total of 90,718 crashes were recorded in the crash data set between 2015 and 2021; 26,282 of them were rear-end crashes. Descriptive statistics of the rear-end crashes vs. other crashes are reported in Table A1 (see online supplement). The results from tree model 1 are presented in . The model accuracy was 79.8%, with 60.3% sensitivity and 87.7% specificity.
Figure 2. Results from tree model 1: Environmental characteristics associated with rear-end crashes vs. other crashes. Each node box shows (i) the most likely class (i.e., rear-end crash or other crash), (ii) the conditioned probability to be a crash other than a rear-end, (iii) the conditioned probability to be a rear-end crash, and (iv) the percentage of observations in that node.
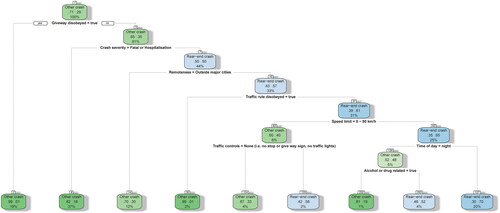
The first node on the left in shows that if a crash involved a give way road rule being disobeyed, 99% of the time the crash was not a rear-end crash. However, most crashes that did not involve a give way road rule being disobeyed but led to at least 1 fatality or hospitalization were not rear-end crashes (82%).
If a crash was less severe than hospitalization or fatality and did not involve a give way road rule being disobeyed, it was more often than not a rear-end crash if it occurred in a major city (57%) but usually a different type of crash if it occurred outside of a major city (70%). In major cities, if a crash was less severe than hospitalization and a traffic light or give way sign was disobeyed, usually the crash was not a rear-end crash (99%).
Among crashes in major cities not involving fatalities or hospitalizations, rear-end crashes were less likely to occur on roads with speed limits of 50 km/h or less (40%) compared with when the limit was 60 km/h or higher (65%), assuming no give way rule or sign was disobeyed.
In major cities where no traffic rule was disobeyed, the severity was less than hospitalization, and the speed limit was 50 km/h or less, a crash was more likely to be a rear-end crash if at the intersection there was some traffic control (58%) but likely to be a different type of crash if there was no traffic control (67%).
In major cities where no traffic rule was disobeyed, the severity was less than hospitalization, the speed limit was 60 km/h or more, and it was nighttime, a crash was more likely to be a rear-end crash if no alcohol or drug involvement was reported (52%) but more likely to be a different type of crash if alcohol or drugs were involved (81%). Among vehicles involved in a crash in major cities but with occupant injury severity less than hospitalization, where the posted speed limit was 60 km/h or higher, a higher proportion of crashes were rear-end when it was daylight, dawn, or dusk (70%) compared to when it was dark (45%). Factors such as weather, road surface conditions, presence of traffic controls, lighting conditions, vertical alignment and whether alcohol, drugs, speeding, fatigue, and distraction were contributing crash factors were not significant influential factors in predicting whether a crash was a rear-end collision or not.
Tree Model 2: Driver and vehicle characteristics contributing to rear-end crashes
It was possible to identify the at-fault and not-at-fault drivers for a total of 14,038 rear-end crashes (53.4%) recorded in the crash data set between 2015 and 2021, presents the results from tree model 2. The model accuracy was 83.6%, with 81.7% sensitivity and 85.5% specificity.
Figure 3. Results from tree model 2: Personal and vehicle characteristics associated with being at fault vs. not at fault in a rear-end crash. Each node box shows (i) the most likely class (i.e., at fault or not), (ii) the conditioned probability to be not at fault, (iii) the conditioned probability to be at fault, and (iv) the percentage of observations in that node.
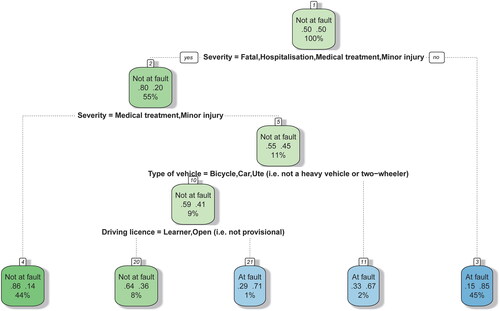
Among rear-end crashes involving 1 at-fault driver and 1 not-at-fault driver, the driver was more likely to be not at fault (80% chance) if anybody in their vehicle suffered any injury ranging from minor injury to fatal injury. Conversely, the vehicles with no injured occupants were the at-fault party 85% of the time. When the most severe injury among occupants of a vehicle was medical treatment or minor injury, usually this vehicle’s driver was not at fault (86%). If a vehicle occupant involved in a rear-end crash suffered at least 1 fatality or hospitalization, more often than not the driver of this vehicle was not at fault (55%). Thus, the struck (not-at-fault) vehicle’s occupants are typically more injured in a rear-end crash than the striking (at-fault) vehicle’s occupants.
If a heavy vehicle (e.g., bus, truck) or powered 2-wheeler (PTW; e.g., moped, motorcycle) in a rear-end crash had at least 1 occupant who ws hospitalized or killed, 67% of the time this vehicle was at fault. If other vehicle types, namely, bicycles, cars, utes,Footnote2 and others, were involved in a rear-end crash and at least 1 occupant was hospitalized or killed, more often than not, this vehicle was the not-at-fault party (59%).
However, if a bicycle, car, ute, or other vehicle was involved in a rear-end crash where at least 1 occupant was killed or hospitalized and the driver held a provisional or an invalid driving license, most of the time this driver was at fault (71%). On the other hand, if the driver held a learner, open, not applicable, or unknown driving license, they were more likely to have been the not-at-fault party (64%).
Discussion
The current study conducted 2 tree model analyses on Transport and Main Roads crash records to investigate the environmental, vehicle, and personal characteristics associated with being in a rear-end crash. The current study also explored the trends and demographic characteristics of the crash data in relation to rear-end crashes.
Environmental characteristics of rear-end crashes
In response to the first research question, the environmental characteristics most associated with rear-end crashes were urban areas and major cities, when the severity was less than hospitalization (medical treatment, minor injury or no injury), when speed limits were 60 km/h or greater in major cities, when it was not dark (daylight hours), and when a give way road rule was not disobeyed.
Unlike in the Abu Dhabi Emirate and Thailand where rear-end crashes occurred more frequently on rural roads (Mohamed et al. Citation2017; Champahom et al. Citation2020), these Queensland-based data showed that rear-end crashes were much more frequent in urban areas and major cities, despite Queensland having a large rural road network of some 61,100 km (Queensland Government Citation2022b). However, similar to both the Abu Dhabi Emirate and Thailand, Queensland has also experienced a relative increase in the proportion of rear-end crashes, suggesting the international need to focus on mitigating rear-end collisions (Mohamed et al. Citation2017; Champahom et al. Citation2020). This could be due to the highly urbanized population of Queensland (World Bank Citation2022), where traffic exposure is higher.
Injury severity and rear-end crashes
Although fatalities and hospitalization frequently occurred in rear-end crashes, rear-end crashes usually were less severe, resulting in either no injury, minor injuries, or medical treatment without hospitalization. However, it can be seen in that although rear-end crashes are typically less severe than other types of crashes, rear-end crashes are the third most common type of crash associated with hospitalization. This can be related to the fact that rear-end crashes are the second most frequent type of crash in this crash data set after angle crashes, so even the minority of rear-end crashes that require hospitalizations still represented a great proportion of the overall number of crashes that require hospitalizations. These data illustrate that rear-end crashes are not to be underemphasized when designing road safety interventions because of a perception that they are typically less severe, because they still represent the type of crash that contributes to the highest number of claims through the CTP scheme of Queensland (Beck Citation2015).
Speed limits and rear-end crashes
These data also suggest that rear-end crashes are significantly less frequent when the posted speed limit is 50 km/h or less in major cities. This finding is interesting to compare with the analysis of police-reported crash data in 2 Australian jurisdictions by Doecke et al. (Citation2018), who found a general, positive, exponential relationship between speed limits and fatal crash rates and that a safe systems speed limit to prevent fatalities for rear-end crashes is 110 km/h or less and 40 km/h or less for hit pedestrian–type crashes. In Queensland, the default speed limit in urban areas is 50 km/h unless otherwise signposted; however, speed limits of 60 km/h and higher are commonplace in built-up areas in Queensland, for trunk collector roads, and in school zones (Queensland Government Citation2022a). A solution would be to reduce speed limits, particularly in all built-up areas, to a maximum speed limit of 50 km/h or lower and 30 km/h in residential areas to reduce the severity of rear-end crashes, as well as other crashes (Pilkington Citation2000; Kloeden et al. Citation2004; Cairns et al. Citation2015; Lawrence et al. Citation2020).
Simulations by Li et al. (Citation2014) showed that variable speed limit interventions have the potential to reduce rear-end crashes near freeway recurrent bottlenecks by as much as 70% in high-traffic demand scenarios and by as much as 82% in moderate traffic demand scenarios.
Consequently, it can be suggested that posted speed limits of 60 km/h and higher be avoided in urban areas and major cities to help minimize both rear-end crashes and other types of crashes. Furthermore, the implementation of variable speed limits on higher-speed roads such as highways and motorways that are frequently congested could be considered to help reduce rear-end crashes.
Rear-end crashes do not typically involve give way violations
In this data set, crashes that involved disobeying a give way road rule or road sign were rarely rear-end crashes (<1%). This is not entirely surprising, because red light enforcement cameras are often associated with an increase in the number of rear-end crashes because drivers often speed or brake harshly in the dilemma zone to either make the green light or avoid being caught for red light running (Polders et al. Citation2015). When the red light is violated, typically other types of crashes come into play, such as angle and side-on collisions, whereas rear-end crashes are more typical of tailgating and harsh braking (Y.-g. Wang et al. Citation2012; Polders et al. Citation2015). Polders et al. (Citation2015) found that warning signs near red light traffic enforcement cameras can reduce the chance of rear-end crashes. Reducing approach speeds to intersections, as well as encouraging safer following distances, can help reduce the risk of rear-end crashes (Feng et al. Citation2010; Islam Citation2016).
The presence of traffic controls at intersections associated with more rear-end crashes
The influence of various characteristics of signalized intersections on rear-end crashes has been researched previously (X. Wang and Abdel-Aty Citation2006); however, there is scarce research on how the presence of traffic control affects the proportional distribution of crash types. Though this analysis suggests that the presence of traffic control can increase the proportion of rear-end crashes, introducing traffic controls at intersections appears to reduce the total number of crashes, especially the installation of roundabouts (Frith and Harte Citation1986). Given that rear-end crashes are typically less severe than other types of crashes, such as angle and head-on crashes (Polus Citation1985; Johansson Citation2009), the introduction of traffic control and uncontrolled intersections can still be considered as a safety benefit.
Alcohol and drugs negatively associated with rear-end crashes during nighttime major city crashes
Prior research has also found rear-end crashes to be underrepresented among alcohol-related crashes (Hossain et al. Citation2021). The current study found that alcohol and drug involvement was negatively associated with rear-end crashes but was positively associated with other types of crashes. However, because rear-end crashes are typically lower severity (Johansson Citation2009), it is likely that involved drivers are less likely to be tested for drugs or alcohol after a rear-end crash, so firm conclusions cannot be assumed from the current study between alcohol and drug involvement and rear-end crashes.
Darkness and rear-end crashes
The analysis found that the proportion of major city crashes, where the severity was less than hospitalization, the speed limit was higher than 50 km/h, and no give way rules or signs were violated, that were rear-end crashes was higher in the hours of daylight (including dusk and dawn) compared with when it was dark. As Sullivan and Flannagan (Citation2003) pointed out, the lower frequency of rear-end collisions at nighttime could be linked to reduced exposure to drivers encountering stopped vehicles during the hours of darkness. The research by Sullivan and Flannagan (Citation2003) suggested that though the volumes of fatal rear-end crashes are much lower in the hours of darkness, the relative risk of darkness can be estimated by focusing on the hours around dawn and dusk, during the different seasons, such that traffic exposure levels are similar. This analysis suggests that fatal rear-end crashes in darkness are more than twice the number in daylight, likely due to the lower visibility of stopped vehicles (Sullivan and Flannagan Citation2003). The influence of darkness in the current study, however, included rear-end crashes of lower severity levels (not fatal). Furthermore, exposure was accounted for by comparing it with the frequency of other types of crashes, suggesting that the distribution across crash types is affected by whether it was dark or not. In this analysis, the presence of artificial lighting did not make a difference, suggesting that visibility may not be the influential factor. Previous research has suggested that the influence of sleepiness induced by the circadian rhythm is the causal mechanism for increased risk levels of crashes in the early hours of the morning (Åkerstedt et al. Citation2001). Thus, the influence of darkness on the frequency and severity of rear-end crashes is unclear, and further research is warranted.
Driver and vehicle characteristics of rear-end crashes
In response to the second research question, the driver and vehicle characteristics most associated with being at fault in a 2-vehicle rear-end crash in Queensland were whether any of the occupants in the vehicle were injured, the severity of the injury, vehicle type, and license type.
Not-at-fault drivers are much more likely to be injured
A key conclusion from the analyses was that the striking driver is much less likely to be injured than the struck (not-at-fault) driver in a rear-end crash. This corroborates the finding by Khattak (Citation2001), who analyzed real-life data from the Highway Safety Information System in North Carolina in access-controlled roadways and found that in 2-vehicle rear-end crashes, the lead driver is more severely injured. This is often because the striking driver is usually protected by airbags, whereas the occupant of the struck vehicle is crushed by the greater velocity and/or mass of the striking vehicle (Wiacek et al. Citation2015).
Khattak (Citation2001) also found that newer vehicles were less likely to be struck by a following vehicle because of the presence of center high-mounted stoplights. Given that this research is now over 20 years old and vehicle technology has advanced considerably since then—for example, the introduction of autonomous emergency braking (AEB; Fildes et al. Citation2015)—it is interesting to note that the relative and absolute frequencies of rear-end crashes have increased, and the higher susceptibility of the not-at-fault driver to be injured in a rear-end crash remains unchanged. The ineffectiveness of AEB in further reducing the prevalence of rear-end crashes could be because AEB penetration is still low; the total light vehicle fleet penetration of AEB technology in Australia and New Zealand was less than 1% in 2014, increasing to more than 5% in 2017 (Budd et al. Citation2020). However, many of the AEB systems only operate at low speeds (<30 km/h), and a U.S. study by Cicchino and Zuby (Citation2019) found that cars with AEB are more represented in rear-end crashes that are atypical versus rear-end crashes that are “typical.” According to these authors, a typical rear-end crash is 2 passenger vehicles driving in a straight line on a dry road at lower speeds. This could highlight the fact that AEB systems are not perfect in their function. However, as AEB becomes increasingly mandatory, and as their functional capabilities improve, it would be interesting to compare these crash data with crash data in future years to see whether AEB has had a significant impact on reducing rear-end crashes.
Vehicle type and being at fault
Among vehicles involved in rear-end crashes where at least 1 occupant was hospitalized or killed, the chance that the vehicle was the at-fault party was much greater if it was a heavy vehicle or PTW, compared with if the vehicle was another type of vehicle, namely, bicycle, car, ute, or other. An analysis of occupational fatalities among truck drivers in the United States found that crashes leading to killed truck drivers were typically single-vehicle crashes, often due to driver fatigue (Chen et al. Citation2014). An analysis by Duncan et al. (Citation1998) on rear-end crashes involving trucks and passenger cars found that occupants were most likely to be killed when they were in a passenger car and stuck by a truck. However, being in a station wagon reduced the severity of the injury in the event of being hit by a truck (Duncan et al. Citation1998). This suggests that the increased vehicle volume that exists behind occupants of both trucks and station wagons, compared to sedans, provides some protection from injury when struck from behind. Thus, it is not entirely surprising that when occupants of heavy vehicles are hospitalized or killed in a rear-end collision, they are more likely to be the striking (at-fault) vehicle because less protection exists for occupants from the front of the vehicle.
The results from the current study found that PTW riders were more likely to be at fault when at least 1 of the occupants of the PTW was killed or hospitalized. This finding is in line with the New South Wales crash data (2004–2008) analysis by De Rome and Senserrick (Citation2011) that found PTW riders to be at fault 62% of the time when they were involved in a rear-end crash of any severity.
Given that when occupants of a bicycle, car, ute, or other vehicle are killed or hospitalized in a rear-end collision they were more frequently not at fault and that occupants of the not-at-fault vehicle were more likely to experience any injury in rear-end collisions, there are some unique characteristics of heavy vehicles and PTWs that lead to these vehicles being more frequently at fault when their occupants are injured in a rear-end crash.
License type and being at fault
Among vehicles that are not PTWs or heavy vehicles but in which at least 1 occupant was killed or hospitalized in a rear-end crash, the controllers were typically not at fault except when they held a provisional or invalid driving license. That provisional license holders are overrepresented as the at-fault driver in rear-end crashes is in line with previous research. For example, Seacrist et al. (Citation2016) found in their analysis of crash events occurring in the naturalistic driving study in the United States that the rear-end striking crash rate for novice teen drivers was 13.5 per million miles driven, compared to 1.8 per million miles driven by experienced adults.
Drivers with an invalid license in the current study were also found to be more at fault when involved in a severe rear-end crash. In an analysis of crash data in residential areas of Alabama, aggressive driving behaviors have been found to be positively related to having an invalid license (Adanu et al. Citation2022). This suggests that persons who drive a motor vehicle without a valid license are more likely to drive aggressively, which could be a contributing factor to why they are more likely to be at fault in severe rear-end collisions. On the other hand, it is quite possible that the police are less likely to check the validity of the driving license of the not-at-fault party and thus these license types would be classed as “unknown” in the crash data set used in the current study.
To conclude, the environmental characteristics most associated with rear-end crashes were urban areas and major cities, when the severity was less than hospitalization (medical treatment, minor injury or no injury), when speed limits were 60 km/h or greater in major cities, when it was not dark (daylight hours), and when a give way road rule was not disobeyed. Furthermore, the driver and vehicle characteristics most associated with being at fault in a 2-vehicle rear-end crash in Queensland were whether any of the occupants in the vehicle were injured, the severity of the injury, vehicle type, and license type. Consequently, it can be suggested that future interventions aimed at reducing the prevalence of rear-end crashes could focus on roads in major cities where the posted speed limit is 60 km/h or higher.
Limitations
Research that analyzes government crash data has limitations. Firstly, the quality of the data is dependent on the accuracy, consistency, and comprehensiveness of the data. Data are not always recorded accurately, incidents can be incorrectly categorized or do not fit into established categories or labels, and many incidents are often not reported or recorded entirely. Given that not all crashes are reported, there can be a selection bias (Giles Citation2003). Nonetheless, given that the data are matched across state departments including police and hospital data, these data offer the best available understanding of the totality of road crashes in Queensland.
Furthermore, observational data are used for correlational analyses, so causal links cannot be established through this research methodology. However, this type of research can inform the design of controlled experimental research studies that would be more suited to understanding causal links.
Recommendations and future research
Given the rising frequency of rear-end crashes and their increasing burden on society, it is recommended that AEB be more widely introduced (Fildes et al. Citation2015). Increased monitoring and enforcement of tailgating using sensors and cameras could also encourage safer following distances and thus reduce the frequency of rear-end crashes (Zellmer et al. Citation2014; Fraser Citation2021). A reduction of speed limits, especially in urban areas, to limits of 50 km/h and lower would result in fewer injuries and deaths overall, including in rear-end crashes (Cairns et al. Citation2015). Given that Ochenasek et al. (Citation2022) found that people often engage in tailgating behavior because of a low perceived risk of apprehension, among other reasons, such as lack of knowledge about safe following distances and road rage (Stephens et al. Citation2023), further research on the deterrence and behavioral change effects of more frequent following distance detection cameras would be welcome in helping prevent rear-end crashes.
Supplemental Material
Download Zip (32.7 KB)Disclosure statement
No potential conflict of interest was reported by the author(s).
Additional information
Funding
Notes
1 Queensland has a common law “fault-based” CTP scheme, first introduced in 1936. The scheme requires motor vehicle owners to pay the CTP premium, which provides motor vehicle owners, drivers, passengers, and other insured persons with an insurance policy that covers their unlimited liability for personal injury caused by, through, or in connection with the use of the insured motor vehicle in incidents to which the Motor Accident Insurance Act 1994 applies (Motor Accident Insurance Commission Citation2021).
2 Ute is an abbreviation for “utility vehicle” and is the Australian English term for a pickup truck. That is, a passenger vehicle with an open cargo tray/tonneau behind the passenger compartment.
References
- Adanu EK, Jones S, Abhay L, Rahman M. 2022. Examining the who, what, and how of risky driving related crashes in residential areas. J Urban Mobility. 2:100024. doi:10.1016/j.urbmob.2022.100024.
- Åkerstedt T, Kecklund G, Hörte L-G. 2001. Night driving, season, and the risk of highway accidents. Sleep. 24(4):401–406. doi:10.1093/sleep/24.4.401.
- Beck D. 2015. Investigation of key crash types: rear-end crashes in urban and rural environments. Sydney, Australia: Austroads.
- Budd L, Newstead S, Stephens A. 2020. A real-world evaluation of autonomous emergency braking and forward collision warning in Australasian light vehicles. Accident Research Centre, Monash University.
- Cairns J, Warren J, Garthwaite K, Greig G, Bambra C. 2015. Go slow: an umbrella review of the effects of 20 mph zones and limits on health and health inequalities. J Public Health. 37(3):515–520. doi:10.1093/pubmed/fdu067.
- Champahom T, Jomnonkwao S, Chatpattananan V, Karoonsoontawong A, Ratanavaraha V. 2019. Analysis of rear-end crash on Thai highway: decision tree approach. J Adv Transp. 2019:1–13. doi:10.1155/2019/2568978.
- Champahom T, Jomnonkwao S, Watthanaklang D, Karoonsoontawong A, Chatpattananan V, Ratanavaraha V. 2020. Applying hierarchical logistic models to compare urban and rural roadway modeling of severity of rear-end vehicular crashes. Accid Anal Prev. 141:105537. doi:10.1016/j.aap.2020.105537.
- Chen GX, Amandus HE, Wu N. 2014. Occupational fatalities among driver/sales workers and truck drivers in the United States, 2003–2008. Am J Ind Med. 57(7):800–809. doi:10.1002/ajim.22320.
- Cicchino JB, Zuby DS. 2019. Characteristics of rear-end crashes involving passenger vehicles with automatic emergency braking. Traffic Inj Prev. 20(sup1):S112–S118. doi:10.1080/15389588.2019.1576172.
- De Rome L, Senserrick T. 2011. Factors associated with motorcycle crashes in New South Wales, Australia, 2004 to 2008. Transp Res Rec. 2265(1):54–61. doi:10.3141/2265-06.
- Doecke SD, Kloeden CN, Dutschke JK, Baldock MR. 2018. Safe speed limits for a safe system: the relationship between speed limit and fatal crash rate for different crash types. Traffic Inj Prev. 19(4):404–408. doi:10.1080/15389588.2017.1422601.
- Duncan CS, Khattak AJ, Council FM. 1998. Applying the ordered probit model to injury severity in truck-passenger car rear-end collisions. Transp Res Rec. 1635(1):63–71. doi:10.3141/1635-09.
- Feng G, Wang W, Feng J, Tan H, Li F. 2010. Modelling and simulation for safe following distance based on vehicle braking process. Paper presented at 2010 IEEE 7th International Conference on E-Business Engineering; Sydney, Australia.
- Fildes B, Keall M, Bos N, Lie A, Page Y, Pastor C, Pennisi L, Rizzi M, Thomas P, Tingvall C. 2015. Effectiveness of low speed autonomous emergency braking in real-world rear-end crashes. Accid Anal Prev. 81:24–29. doi:10.1016/j.aap.2015.03.029.
- Fraser T. 2021. New highway cameras to target ‘dangerous’ tailgaters. Which Car.
- Frith W, Harte D. 1986. The safety implications of some control changes at urban intersections. Accid Anal Prev. 18(3):183–192. doi:10.1016/0001-4575(86)90001-1.
- Giles MJ. 2003. Correcting for selectivity bias in the estimation of road crash costs. Appl Econ. 35(11):1291–1301. doi:10.1080/0003684032000090717.
- Hossain MM, Rahman MA, Sun X, Mitran E. 2021. Investigating underage alcohol-intoxicated driver crash patterns in Louisiana. Transp Res Rec. 2675(11):769–782. doi:10.1177/03611981211019742.
- Islam MT. 2016. Investigating the speed and rear-end collision relationship at urban signalized intersections. Transp Res Rec. 2601(1):10–16. doi:10.3141/2601-02.
- Johansson R. 2009. Vision zero–implementing a policy for traffic safety. Saf Sci. 47(6):826–831. doi:10.1016/j.ssci.2008.10.023.
- Khattak AJ. 2001. Injury severity in multivehicle rear-end crashes. Transp Res Rec. 1746(1):59–68. doi:10.3141/1746-08.
- Kloeden C, Woolley J, McLean A. 2004. Evaluation of the 50km/h default urban speed limit in South Australia. Paper presented at: 2004 Road Safety Research, Policing and Education Conference, Road Safety Council; Perth, Australia.
- Lawrence B, Fildes B, Thompson L, Cook J, Newstead S. 2020. Evaluation of the 30km/h speed limit trial in the City of Yarra, Melbourne, Australia. Traffic Inj Prev.21(sup1):S96–S101. doi:10.80/15389588.2021.1895990.
- Li Z, Liu P, Wang W, Xu C. 2014. Development of a control strategy of variable speed limits to reduce rear-end collision risks near freeway recurrent bottlenecks. IEEE Trans Intell Transp Syst. 15(2):866–877.
- Mohamed SA, Mohamed K, Al-Harthi HA. 2017. Investigating factors affecting the occurrence and severity of rear-end crashes. Transp Res Procedia. 25:2098–2107. doi:10.1016/j.trpro.2017.05.403.
- Motor Accident Insurance Commission. 2021. CTP scheme overview. [accessed]. https://maic.qld.gov.au/scheme-knowledge-centre/ctp-scheme/.
- Ochenasek M, Truelove V, Stefanidis KB, Watson-Brown N. 2022. Examining the impact of both legal and nonlegal factors on following a vehicle too closely utilizing three deterrence-based theories. J Criminol. 55(1):65–80. doi:10.1177/26338076211065208.
- Pilkington P. 2000. Reducing the speed limit to 20 mph in urban areas: child deaths and injuries would be decreased. BMJ. 320(7243):1160–1160. doi:10.1136/bmj.320.7243.1160.
- Polders E, Cornu J, De Ceunynck T, Daniels S, Brijs K, Brijs T, Hermans E, Wets G. 2015. Drivers’ behavioral responses to combined speed and red light cameras. Accid Anal Prev. 81:153–166. doi:10.1016/j.aap.2015.05.006.
- Polus A. 1985. Driver behaviour and accident records at unsignalized urban intersections. Accid Anal Prev. 17(1):25–32. doi:10.1016/0001-4575(85)90005-3.
- Queensland Government. 2022a. Guide to speed management. In: Roads TaM, editor.
- Queensland Government. 2022b. State controlled road length—total rural lane kilometres. Open Data Portal; [accessed 2023 May 10]. https://www.data.qld.gov.au/dataset/state-controlled-road-length-total-rural-lane-kilometres/resource/9ffc1b7f-fca9-48c5-8669-68c5452065b1.
- R Core Team. 2022. R: A Language and Environment for Statistical Computing. R Foundation for Statistical Computing. https://www.R-project.org.
- Rakotonirainy A, Demmel S, Watson A, Haque MM, Fleiter JJ, Watson BC, Washington S. 2017. Prevalence and perception of following too close in Queensland. Paper presented at: Australasian Road Safety Conference 2017 (ACRS2017); Perth, Australia.
- Seacrist T, Belwadi A, Prabahar A, Chamberlain S, Megariotis J, Loeb H. 2016. Comparison of crash rates and rear-end striking crashes among novice teens and experienced adults using the shrp2 naturalistic driving study. Traffic Inj Prev. 17(sup1):48–52. doi:10.1080/15389588.2016.1188384.
- Sharafeldin M, Farid A, Ksaibati K. 2022. Injury severity analysis of rear-end crashes at signalized intersections. Sustainability. 14(21):13858. doi:10.3390/su142113858.
- Slikboer R, Muir SD, Silva SSM, Meyer D. 2020. A systematic review of statistical models and outcomes of predicting fatal and serious injury crashes from driver crash and offense history data. Syst Rev. 9(1):220–220. doi:10.1186/s13643-020-01475-7.
- Stamatiadis N, Deacon JA. 1997. Quasi-induced exposure: methodology and insight. Accid Anal Prev. 29(1):37–52. doi:10.1016/s0001-4575(96)00060-7.
- Stephens AN, Stephan KL, Crotty R, O'Hern S, Björklund G. 2023. Too close for comfort: a mixed methods study to understand self-reported tailgating using the theory of planned behaviour. Transp Res Part F Traffic Psychol Behav. 93:11–22. doi:10.1016/j.trf.2022.12.005.
- Sullivan JM, Flannagan NJ. 2003. Risk of fatal rear-end collisions: is there more to it than attention?. Paper presented at: Driving Assessment Conference, University of Iowa; Park City, UT. doi:10.17077/drivingassessment.1130.
- Therneau T, Atkinson B. 2022. rpart: Recursive partitioning and regression trees. https://CRAN.R-project.org/package=rpart.
- Transport and Main Roads. 2023. Crash data from Queensland roads [accessed 2023 Feb 14]. https://www.data.qld.gov.au/dataset/crash-data-from-queensland-roads.
- Wang X, Abdel-Aty M. 2006. Temporal and spatial analyses of rear-end crashes at signalized intersections. Accid Anal Prev. 38(6):1137–1150. doi:10.1016/j.aap.2006.04.022.
- Wang Y-g, Chen K-m, Hu L-w. 2012. Killer tailgating: recommendation of traveling intervals between consecutive motor vehicles for rear-end collision avoidance. Arab J Sci Eng. 37(3):619–630. doi:10.1007/s13369-012-0200-y.
- Weng J, Yang D, Chai T, Fu S. 2019. Investigation of occurrence likelihood of human errors in shipping operations. Ocean Eng. 182:28–37. doi:10.1016/j.oceaneng.2019.04.083.
- Wiacek C, Bean J, Sharma D. 2015. Real-world analysis of fatal rear-end crashes. Paper presented at: 24th International Technical Conference on the Enhanced Safety of Vehicles (ESV) National Highway Traffic Safety Administration; Gothenburg, Sweden.
- World Bank. 2022. Urban population (% of total population)—Australia; [accessed 2023]. https://data.worldbank.org/indicator/SP.URB.TOTL.IN.ZS?end=2021&locations=AU&start=1960&view=map.
- Yan X, Radwan E. 2006. Analyses of rear-end crashes based on classification tree models. Traffic Inj Prev. 7(3):276–282. doi:10.1080/15389580600660062.
- Yan X, Radwan E, Abdel-Aty M. 2005. Characteristics of rear-end accidents at signalized intersections using multiple logistic regression model. Accid Anal Prev. 37(6):983–995. doi:10.1016/j.aap.2005.05.001.
- Yue L, Abdel-Aty MA, Wu Y, Farid A. 2020. The practical effectiveness of advanced driver assistance systems at different roadway facilities: system limitation, adoption, and usage. IEEE Trans Intell Transport Syst. 21(9):3859–3870. doi:10.1109/TITS.2019.2935195.
- Zellmer TJ, Freeman PT, Wagner JR, Alexander KE, Pidgeon P. 2014. A mobile tailgating detection system for law enforcement surveillance. Paper presented at: Dynamic Systems and Control Conference; San Antonio, TX. doi:10.1115/DSCC2014-5884.
- Zhao S, Wang K, Jackson E. 2019. Evaluation of not-at-fault assumption in quasi-induced exposure method using traffic crash data at varied geographical levels. Transp Res Rec. 2673(4):593–604. doi:10.1177/0361198119841036.
