
Abstract
The impact of educational programs on student learning is contingent upon the quality and fidelity of their implementations. Yet, the most reliable method of implementation monitoring, direct observation, may be infeasible for large-scale efficacy studies. Here, we use log-file data from an efficacy study assessing the impact of gamified learning technologies on algebraic knowledge to measure the fidelity of implementations remotely within and across multiple programs. We employ exploratory-data-analysis to identify measures of fidelity, multilevel models to evaluate which levels of implementation contexts (i.e. classrooms, teachers, students) were associated with variance in fidelity metrics, and latent profile analysis to identify high and low-fidelity contexts. These analyses illustrate how log-file data may be used to remotely monitor and evaluate the implementations of online learning platforms.
Introduction
Implementation quality is a significant factor in determining whether a program has its intended impact (Durlak & DuPre, Citation2008; List et al., Citation2021). Researchers have found impact differentials due to implementation variability in mental health interventions (Dane & Schneider, Citation1998), drug use programs (Tobler, Citation1986), anti-bullying programs (Smith et al., Citation2004), behavioral interventions (Bos et al., Citation2023; Cross et al., Citation2015; Dart et al., Citation2012) and academic programs (Bos et al., Citation2023; Crawford et al., Citation2012; Wolgemuth et al., Citation2014). In K-12 education, classroom teachers often determine the quality and dosage of a program’s content delivery. Therefore, when studying a program’s efficacy, researchers must ensure that the program is implemented as intended to estimate its impact.
To evaluate whether a program is being implemented properly in the classroom during a study, researchers generally conduct classroom observations or rely on teacher self-reports (Dart et al., Citation2012; Schoenwald et al., Citation2011). Observations, which are often conducted by graduate students, are meant to evaluate the implementation contexts - classes, teachers, schools—by assessing the features of the environment in which a program is administered that contribute to the quality of the implementation (Durlak & DuPre, Citation2008). However, live observations are time-consuming and costly because they require multiple observations for each teacher to reliably estimate fidelity metrics (Cross et al., Citation2015; Gresham et al., Citation2017). Furthermore, observations likely affect the observed teacher’s behavior (Adair et al., Citation1989; Cook, Citation1962; Fox et al., Citation2008; McCambridge et al., Citation2014; Wu et al., Citation2018), thus impacting the generalizability of study findings (Gupta et al., Citation2021). Although self-reports are more easily scalable, they are also less reliable (Gresham et al., Citation2017; Lee et al., Citation2008). Because of this lack of reliability, classroom observations remain the gold standard for assessing implementation fidelity.
However, teacher observations pose challenges for scaled implementations beyond the costs and potential effect of observations on teacher behavior. Whereas, large-scale programs may be deployed in multiple schools and over great distances, it may be impractical or even impossible to conduct in-person observations with the necessary frequency for reliable estimates of implementation-related metrics. In recent years, the COVID-19 pandemic has exacerbated this problem, which caused both restricted access to schools and an increased prevalence of remote learning environments.
In contrast, online educational programs often provide researchers with abundant granular data on how and when individual students interact with the programs, which can help evaluate student behavior. These data—often referred to as log-file data—may be leveraged to build an understanding of a program’s implementation fidelity remotely. Log-file data have been used to detect student behaviors such as “gaming-the-system” behaviors—when students rapidly click through content and tasks without learning (Paquette & Baker, Citation2019)—unproductive persistence (Botelho et al., Citation2019), and effort (Gurung et al., Citation2021).
More recently, Helsabeck et al. (Citation2022) extended the use of log-file data to detect the implementation fidelity of online learning platforms. Helsabeck et al. (Citation2022) had access to teacher log-file data to understand implementation fidelity, whereas many online learning platforms are only administered at the student level and, therefore, only collect student-level data, making it difficult to evaluate the implementation context. In the following study, we build on the work of Helsabeck et al. (Citation2022) and others by using students’ log-file data to examine how students’ educational contexts influence the dosage and engagement of online educational programs. This work aims to consider an alternative to traditional methods of implementation monitoring by using students’ behavioral data collected by online learning platforms to understand and evaluate teachers’ implementation fidelity during an efficacy study.
Background
Defining implementation fidelity for online learning platforms
To evaluate program implementation during efficacy studies, it is necessary to define the implementation components. Attempts to define these components have produced lists of theoretically distinct features that overlap in practice. For example, (Dane & Schneider, Citation1998) identified five elements of implementation: (a) Fidelity is the extent to which the practitioners use the program as intended. (b) Dosage is how much the participants used the program. (c) Quality is how well the programs’ components were implemented. (d) Responsiveness refers to the engagement of the participants. (e) Program differentiation is how unique the program is relative to other conditions. However, these components are not entirely independent of one another. For example, if a program designer instructs a practitioner to implement a certain dosage level, then the dosage is actually a fidelity component. To avoid this overlap, other authors include adherence, dosage, quality, and engagement under the overarching construct of implementation fidelity (Breitenstein et al., Citation2010; Carroll et al., Citation2007; Kulo & Cates, Citation2013). These definitions suggest that fidelity is best defined as a broader category that includes implementation components.
Defining what constitutes implementation fidelity can be difficult for online learning platforms. Although there is always some variability in how students are assigned and interact with analog classroom interventions, online learning platforms often include personalized elements which produce additional variability in student experiences. Within a personalized program, implementations can vary among students, as each student can interact and engage with the programs in unique ways, even if given the same assignment (Spector, Citation2013). Furthermore, fidelity differences may be based on students’ familiarity with or interest in technology or their individual needs and backgrounds.
Given these challenges of defining implementation fidelity for analog and digital interventions, universal definitions of the implementation components and acceptance of which components constitute fidelity do not exist. Unfortunately, this makes studying implementations difficult because, as Durlak and DuPre (Citation2008) explain, “Science cannot study what it cannot measure accurately and cannot measure what it does not define” Our purpose here is not to provide a new schema for understanding implementations but to note the complexity of evaluating implementations. For our study, we focused on evaluating the essential components as defined by the program’s designers. This is consistent with literature that indicates focusing on “core components” as defined by what the program designers consider to be non-negotiable in program implementation (List et al., Citation2021). This definition may include quality of content delivery, dosage, and student engagement. We chose this definition because of its versatility and adaptability to different technology-based programs.
Implementation fidelity monitoring for online learning platforms
Use of both fully online and blended learning platforms is expanding in K-12 education. The data captured by these programs provide to classroom observations and self-reports for monitoring implementation fidelity through the automated collection of log-file data as implementation indicators. For example, some studies measured fidelity using dosage as the number of sessions or lessons completed in the program, which can be determined based on students’ log-file data (Rutherford et al., Citation2014) or teachers’ log-file data (Helsabeck et al., Citation2022). Others measured the amount of time students logged into or actively engaged with the program (Crawford et al., Citation2012; Wang & Woodworth, Citation2011; Wolgemuth et al., Citation2014). Still, others measured dosage as the number of weeks students’ usage of the program aligned with set playtime recommendations (Schechter et al., Citation2017; Vanacore et al., Citation2021).
The focus on dosage as a key metric for fidelity is understandable as educators are responsive to dynamic changes in dosage recommendations (Dieter et al., Citation2020) and educators’ monitoring of students’ usage is associated with greater progress within programs (Schechter et al., Citation2017; Vanacore et al., Citation2021); however, the dosage is not consistently associated with students’ outcomes. Some studies have documented positive associations between dosage, learning outcomes, and program effects (Crawford et al., Citation2012; Hurwitz, Citation2019; Shamir et al., Citation2019; Wolgemuth et al., Citation2014). Yet, others have found non-significant (McMurray, Citation2013) and even negative (Hurwitz & Macaruso, Citation2021) relations between dosage and outcomes, even when the program effects were positive. This suggests that dosage alone may be insufficient to measure fidelity.
Beyond dosage, student engagement is another component of fidelity that may be estimated from log-file data. As noted earlier, many online learning platforms have personalized elements that allow for students to progress through content at their own pace, for which dosage measures of fidelity cannot fully account. Including additional measures of how students use the program can help to address this limitation. Although engagement is a complex and highly-studied aspect of learning, it is infrequently used in assessing implementation fidelity, and therefore, few metrics for measuring engagement in a fidelity context have been proposed. One potential measure of responsiveness may be the amount of content a student completes during the study. Notably, when evaluating an online learning platform, (McMurray, Citation2013) found that students’ progression through content was positively associated with the learning outcome, even though the outcome was not correlated with time spent in the program. Some programs make implementation fidelity contingent on both dosage and completing prescribed content as a way of ensuring that students are engaged during their time on the program (Rutherford et al., Citation2014). This suggests that progression through content as an indication of engagement may be a good complement to dosage for measuring fidelity.
Both dosage and progress measures are generally captured by online learning systems in the form of log-file data. A major advantage of using log-file data is that it can be collected for long periods at a lower cost compared to in-person observations, as data collection is not limited to specific observation times and can instead be collected continuously as learners engage with the program. These data can also be collected remotely without the reliability errors of remotely collected self-reported data (Lee et al., Citation2008). Because log-file data are collected automatically, it can also circumvent the potential for the observer to affect the behavior of the observed, as may be the case for in-person observations (Cook, Citation1962). Indeed, a recent study by Helsabeck et al. (Citation2022) successfully utilized log-file data from a tablet-based curricular supplement to measure treatment exposure, adherence, and quality; further, the log-file data provided unique fidelity information that differed from that collected through classroom observations, helping to inform their intervention findings.
Furthermore, using log-file data for the remote collection of implementation data can provide a template for monitoring implementations outside of the efficacy study context. Although it would be infeasible to have researchers continue to monitor implementations as programs are scaled beyond study contexts, remote monitoring through log file data can be automated and provided through user dashboards. Dashboards like this allow teachers, administrators, and program designers to evaluate implementations (Dieter et al., Citation2020; Vanacore et al., Citation2021). Research has shown that administrators often access dashboards to evaluate the needs of their schools and districts (Wistrom, Citation2017), although there is heterogeneity in educator beliefs about the usefulness and meaningfulness of the data presented (Crooks, Citation2017). Providing implementation data directly to educators may help ensure that program fidelity is maintained as the effective programs continue beyond the study and are scaled to new schools.
However, there are still unexplored aspects of using log-file data to monitor implementation fidelity. For example, little has been done to explore how to select and aggregate variables (such as time on the program, number of problems attempted, etc.) to be used as fidelity metrics. This can be especially difficult when comparing fidelity-related log-file data generated by different online learning platforms that serve as separate conditions in an experiment. Furthermore, the log-file data for dosage and engagement are typically collected at the student level. Helsabeck et al. (Citation2022) studied a program administered by teachers to groups of students, and therefore, their fidelity metrics were directly related to teacher behavior. This is not the case for many online learning platforms in which students work independently, which presents a challenge as fidelity is often a context-level construct (i.e. one that is defined by classes, teachers, and schools). Thus, it can be difficult to tease apart which specific aspects of student behavior are associated with the implementation context such as the teacher or classroom to which they are assigned. In this article, we aim to address these difficulties and explore whether log-file data collected from students as they engage with online learning platforms can be used as a method of monitoring student, teacher, and classroom-level implementation.
A case study: Utilizing log-file data from from here to there! efficacy study
The current study uses data from a randomized control efficacy trial of three fully online technology interventions across a single school year. The original study (see Decker-Woodrow et al., Citation2023) was a student-level randomized control trial, conducted within a single large public school district during the 2020–2021 school year to evaluate the impact of three online learning platforms on students’ algebraic knowledge. Each program focused on improving students’ algebraic understanding of mathematical equivalence through different modes of instruction. Each condition consisted of different assignments related to equivalence. These assignments were not provided in conjunction with any specific lectures, but they were meant to coincide with learning objectives taught in the students’ classes.
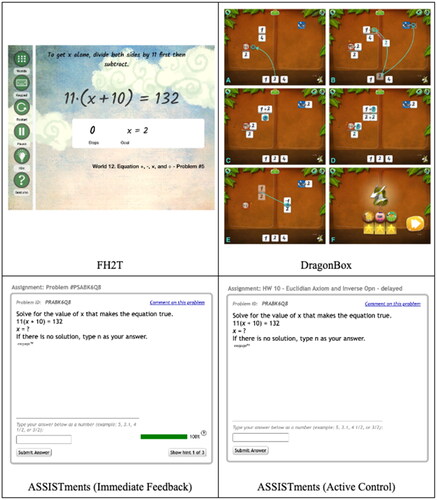
Two of the conditions, From Here to There! (FH2T) and DragonBox, provided differing forms of gamified instruction in mathematics using perceptual-motor routines to manipulate equations. A third condition provided immediate feedback through on-demand hints and immediate feedback to students as they worked through traditional algebra problems in ASSITments. The three conditions were compared to an active control condition in ASSISTments, in which students worked through the same problem sets as the immediate feedback condition without the immediate access to hints or feedback. Example problems for each condition can be found in . Impact analyses of the effects of each program found that FH2T and DragonBox increased students’ end-of-year posttest scores relative to the active control condition, whereas the effect of the immediate feedback condition could not be resolved (Decker-Woodrow et al., Citation2023).
Figure 1. Example problems from each condition.
The original research plan included fidelity of implementation monitoring for teachers through direct observation, but the COVID-19 pandemic foiled this plan. The study was conducted between September 2020 and April 2021, which coincided with a peak in the COVID-19 pandemic in the United States. Given the health risks of COVID-19, the school district offered students and their families two options (in-person schooling with physical distancing or asynchronous remote coursework) for the 2020–2021 school year. Furthermore, researchers did not have access to any classrooms or schools during the study. Instead, students’ recorded log data provided crucial information about their dosages and engagement although using their assigned programs. Therefore, the overarching aim of this study is to utilize the student log-file data to identify implementation contexts with different levels of fidelity.
We focus on two important factors, students’ dosage and engagement, in the implementation of the programs. This focus is supported by prior research on educational technology (Dieter et al., Citation2020; Helsabeck et al., Citation2022; Rutherford et al., Citation2014). Moreover, these aspects of implementation align with the expectations that teachers ensure students’ active participation in the programs for specific time periods, as discussed in more detail in the Method section. Other aspects of implementation, such as content delivery quality, are automated by the online platforms and thus remain consistent across students as long as they receive the required dosage and remain engaged. It is worth noting that throughout this study, we utilize student-level data to draw conclusions about implementation at various levels within the students’ context, including classes, teachers, and schools.
Research questions
We will use student log data from this efficacy study to answer three research questions:
RQ1: Which variables should be used as metrics of students’ dosage and engagement across conditions?
Online programs provide abundant data on student-level behavior, but not all of these points may help evaluate class-level implementation fidelity. In this section, we explore different potential student-level variables (i.e., number of assignments started, time in program, number of problems attempted, etc.) that can be used to create fidelity metrics. We assess the use of these variables based on their theoretical relevance to the constructs of fidelity and their availability and equivalence across programs. When the variables are not equivalent across programs, we explore how to standardize these variables. Finally, we determine which variables are best suited to measure fidelity across all conditions.
RQ2: How much of the variance in student-level dosage and engagement metrics are associated with the students’ implementation contexts?
Since fidelity is traditionally measured as a contextual variable in education studies, we seek to understand the importance of the students’ context in explaining variations in dosage and engagement. By examining the portion of the variance of these variables associated with school, teacher, and class, we can quantify how much each aspect of the implementation context accounts for implementation fidelity.
RQ3: Can we classify high and low-fidelity implementation contexts using the dosage and engagement metrics?
After understanding which variables are best suited to measure student engagement and dosage, and which aspects of implementation context account for the variances in dosage and engagement metrics, we seek to identify which of these contexts provided high- and low-fidelity implementation environments during the study.
Method
Study description
The analyses for the current study used data from a randomized control trial described in Section 3. This study employed a student-level randomization into the following programs: FH2T (40%); DragonBox (20%); ASSISTments with immediate feedback (20%); and ASSISTments without immediate feedback (active control) (20%).
Sample
Initially, 52 seventh-grade mathematics teachers from 11 schools were recruited to participate in the study from a large, suburban district in the Southeastern United States during the summer of 2020. Due to the COVID-19 pandemic, one of these schools was designated as fully remote. At the start of the 2020–2021 school year, 4092 students were enrolled in the classes with the recruited teachers. Prior to randomization, one school decided not to participate. Due to the nature of the pandemic school year, students moved across schools and classrooms at a high rate, and many other students left the district entirely. (Further work on the movement of students during the school year can be found in Lee et al. (CitationUnder-Review).
As additional inclusion criteria, students must have attended school throughout the study and be randomized into a condition with available log-file data. Because DragonBox is a commercially owned app that was downloaded onto personal devices, our research team did not have access to the log-file data; therefore, students randomized into DragonBox were not included in this study. This exclusion did not bias any estimates as assignment to DragonBox was randomized within the classroom; therefore, these students were missing completely at random Rubin (Citation1976). Finally, 39 (1.31%) of the students rostered in the study could not be linked to their log-file data of the programs, so we excluded them from the analyses. Our final analytic sample for this case study included 2778 students taught by 37 teachers in 10 schools.
The district provided demographic data for the participating students. Of the analytic sample, 48.88% of the students were identified as White, 27.14% as Asian, 14.04% as Hispanic, 4.86% as Black, 0.69% as Native American, 0.04% as Native Pacific Islander, and 2.98% as two or more races. The district did not provide data for 1.37% of the students. About half the students were identified by the district as female (48.14%) and male (51.81%), with less than 1% of the population not reporting gender. The district did not provide any data on non-binary students. About one-tenth (9.10%) of students had an Individualized Education Plan, and 16.40% were identified as gifted. The district did not provide data on who received free or reduced lunch.
Procedures
At the start of the 2020–2021 school year, all math teachers attended a one-day professional development training that introduced them to the study, provided them with a detailed timeline for each assignment, and taught them how to use each technology. The research team also provided each teacher with class rosters, study login IDs, and passwords for each student in their classes. During the school year, teachers were expected to provide students with 30 min every two weeks to log into the ASSISTments system and complete 13 assignments spread out across the school year. Once in ASSISTments, students clicked a link and were redirected to their assigned programs. Four sessions were dedicated to assessments, and nine 30-min play sessions were dedicated to the different educational technologies. In in-person classrooms, students used their assigned programs during dedicated instructional periods. Students who received virtual instruction were provided with links in their learning management system to their respective interventions as part of their assigned learning activities. All students worked individually at their own pace.
In each session, students used their assigned login to log into the ASSISTments platform and click the link for that assignment. Once clicked, they were routed directly to their assigned intervention activity for the session. Students completed their assignments within the ASSISTments webpage, except those in the DragonBox condition, where they were given tablets preloaded with the app and their student profiles. During the session, students solved problems in their assigned technology for 30 min, and the system automatically logged them out at the end of the 30 min. Each 30-min session was assigned within a specific 2-week block of the school year.
Students participated in a total of 13 assignments. The first, sixth, twelfth, and thirteenth sessions were 40–45 min assessments of their algebra knowledge and attitudes toward math. Sessions 2–5 and 7–11 were activities in their assigned technology. In both the assessments and the activity sessions, students’ usage and progress for each program were captured by their respective technologies. As students solved problems in the systems, the platforms also logged information about students’ actions and performance.
Teacher fidelity expectations and monitoring
Because the study focused on student learning through the platforms, implementation did not require teacher instruction. Therefore, the role of the teacher in the study was simply to ensure that students had the designated time to complete the nine 30-min sessions across the school year and that students were actively engaged in the intervention programs. Throughout each intervention session (typically a 2-week window), researchers emailed teachers detailed updates about the assignments their students should complete each week. The mid-session emails also included graphs showing students’ usage of their prescribed technologies for that week, as well as lists of students based on whether they did not start, started but did not complete, and completed the sessions’ assignment. The researchers requested that the teachers respond to these updates by providing students with classroom or homework time to complete their 30 min and reminding students who had not started the assignment to log in and complete it during the session period.
Data collection
For the conditions run through ASSISTments—immediate feedback through adaptive scaffolding and the active control—log-file data on students’ behavior in the program were collected in the ASSISTments database. For the FH2T condition, students’ behaviors in the program were collected in the Graspable Math database, which hosts FH2T. The researchers did not have access to the DragonBox database; however, before and after students solved problems in DragonBox, they logged into ASSISTments and answered a series of self-reported questions about their starting and ending progress in the program. All data from this study are available through the Open Science Foundation (https://osf.io/r3nf2/), and a complete description of the data can be found in Ottmar et al. (Citation2023) The measures used in the analyses below were derived from action level data that included timestamps.
Measures
Assignments started and completed
During the study, students were expected to complete nine instructional assignments in their randomly assigned program. These assignments included all the components students were expected to participate in within each program. The ASSISTments system logged the number of assignments each student started and the number of assignments for which each student completed the required 30-minute session. Our analysis only includes the usage of the instructional assignments as part of the fidelity assessment.
Problems attempted
The number of problems attempted was collected digitally by the students’ assigned programs. For this study, students’ problems attempted were aggregated for each assignment and as a total of problems for the whole study. Accuracy on the problems is defined differently for each condition (e.g. FH2T defines it as providing the most efficient solution to the problem, whereas DragonBox defines accuracy as submitting the correct answer on the first attempt without viewing a hint). Therefore, we included all problems in which the student did any work, regardless of the correctness of their response.
Time in programs
Students’ assigned programs collected time through log-file data as the time students started and ended for each problem within the assignments. This time, measured in minutes, was summed for each student across all the problems they completed during their instructional assignments in their assigned program to create a total time in the program variable.
Student rosters
Throughout the study, the district provided up-to-date data on student rosters within schools, teachers, and classes. A quarter of students in the analytic sample (25.27%, n = 702) ended the school year in a different school, class, or teacher than they began the school year as a result of pandemic-related instability. As much of the student movement occurred at the beginning of the school year, we used the student end-of-school-year roster data in our analysis.
Analysis plan
We employed multiple analysis methods to address our research questions, including exploratory data analysis, multilevel modeling, and latent profile analysis. Each analysis built on the previous as information learned from answering one research question influenced decisions in subsequent work. Variables identified as suitable measures of dosage and engagement across programs in RQ1 are used to produce fidelity metrics which are then used in subsequent analysis to address RQ2 and RQ3.
To create metrics of student dosage and engagement (RQ1), we first calculated variables from the log-file data of each program. Then, we evaluated the variability of the data for each condition, descriptive statistics, and differences in metrics based on the condition. Finally, we explored ways of standardizing the variables to be usable for analysis across conditions. The selected and standardized variables are referred to as our fidelity metrics throughout the rest of the paper.
Next, to evaluate how much of the dosage and engagement metrics variance is associated with components of the implementation context (RQ2), we estimated a series of multilevel models using the lme4 package in R (Finch et al., Citation2019). Each model included random intercepts for school, teacher and class regressed on the fidelity metrics identified and standardized for RQ1. The variances of the fidelity metric associated with the random intercepts were compared to the total variance using intra-class correlations (ICC). This correlation provided us with an estimate of the importance of the students’ contexts in predicting their dosage and engagement.
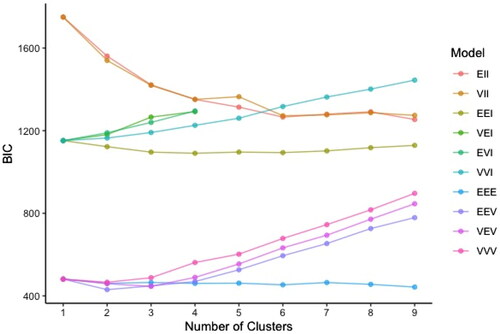
Finally, we conducted a latent profile analysis to identify different fidelity profiles. We aggregated the fidelity metrics identified in RQ1 at the context level (school, teacher, or class) with the highest ICCs from the analysis for RQ2. Then we estimated latent profiles using the mclust package in R Scrucca et al. (Citation2016). To determine the number of classes, the models’ variance, and covariance structure, we estimated a latent profile model for one through nine clusters and each possible structure. To select a final model, we compared the Bayesian Information Criteria (BIC) and selected the model with the lowest BIC. Finally, we compared the differences in distributions of the fidelity metrics by cluster to understand and label the fidelity profiles.
Results
RQ1: Which variables provide the best student-level estimates of dosage and engagement across conditions?
The following is an exploratory data analysis of the two key dimensions of implementation fidelity. presents aggregate variables aggregated from log-file data, categorized by whether we believed they reflected “dosage” or “engagement.” also indicates whether the measurement was equivalent across conditions in that the variables were captured by the same systems and had the same unit of measure. Assignments started and completed were equivalent across conditions because those variables were captured by ASSISTments’ system, regardless of programs. Alternatively, time in program and problems attempted were captured by the programs of the specific conditions. By exploring these variables’ equivalence across programs, descriptive statistics and correlations, and methods of standardization, we curate metrics of fidelity to use for subsequent analyses.
Table 1. Student-level dosage and engagement fidelity variables aggregated from each program’s log-file data.
Table 2. Means, standard deviations, and ANOVA statistics of student-level fidelity variables by condition.
Student-Level dosage variables
Using the students’ log-file data, we aggregated three dosage-related variables: assignments started, assignments completed, and time in-program. We calculated the percentage of instructional assignments each student started and completed out of the nine possible instructional assignments. As another dosage measure, we calculated the total number of minutes students spent attempting problems within their assigned programs. We aggregated this variable by taking each problem’s start and end time from their log-file data, calculating the differences between each time, and summing these times for all the problems students completed. presents the means and standard deviations of these variables. Assignments started and completed were both equivalent across conditions, because all students were tasked with completing up to nine assignments. Differences between either assignment started (F = 0.252, p = .777) or completed (F = 0.798, p = .450) by condition were not statistically significant. The correlation between these variables is 0.94 (p < .001). This collinearity between assignments started and assignments completed suggests that only one variable may be necessary to evaluate assignments started. For the following analysis, we use the assignments started variable to measure dosage, as it is the best indicator of whether teachers provided the opportunity for students to utilize the programs.
It is also notable that students in the FH2T condition had significantly higher recorded time in program than students in the ASSISTments (Immediate and Delay) conditions (F = 36.2, p < .001), yet they did not start or complete more assignments. This pattern suggests that the differences in time may have less to do with actual dosage and more to do with how the programs capture and calculate time, highlighting the difficulties in comparing time metrics across programs. Due to the lack of equivalency between the other conditions, we chose not to include time in the program in subsequent analyses.
Student-level engagement variables
After identifying assignments started as a dosage metric, we evaluated the engagement-related variables as candidates for engagement metrics. Even when students receive the same dosage, the amount of content they consume during their assignments may vary. Disengaged students may have started the assignment but only completed a few problems. Using the log-file data, we aggregated two variables related to engagement: the total number of problems attempted and the average number of problems attempted per assignment to provide data on student’s level of engagement with their respective programs. These two levels of aggregation allow us to evaluate two different definitions of engagement: overall engagement across the entire study and engagement within the assignments students started.
Unlike the dosage variables, the engagement measures are program-specific and, therefore, not equivalent across programs (). The FH2T condition had 252 problems, whereas the immediate and delayed conditions had 218 problems. Furthermore, these problems were not the same across conditions, as the problems involved specific pedagogical features associated with each condition (gamification, immediate feedback, etc.). This lack of equivalence between conditions for engagement variables prevents their use in evaluating implementation fidelity between classes, teachers, and schools. Students assigned to FH2T attempted significantly fewer problems overall than those in the other conditions (F = 538.100, p < .001), and students in the immediate feedback condition averaged fewer problems per assignment than those in the delayed condition (F = 220.100, p < .001).
This lack of equivalence makes it challenging to determine whether the engagement is associated with the student’s assigned program versus the implementation context. One solution is to standardize the variables within the programs by calculating the z-scores for each student using the means and standard deviations from the students’ assigned program. This calculation centers the variable around typical engagement for each program and removes the potential confounding influence of the program differences when evaluating context-level variation. Although they are highly correlated with one another (r = 0.78, p < 0.001), we chose to use both these standardized variables as metrics because they describe distinct aspects of student engagement: across the total program or within specific assignments.
RQ2: How much of the variance in student-level dosage and engagement metrics are associated with the students’ implementation contexts?
After selecting student-level fidelity metrics for dosage and engagement, we evaluated the extent to which these variables are associated with students’ educational context (i.e. the students’ classes, teachers, and schools). By calculating the ICC, we estimated how much variance in assignments started, total problems, and problems per assignment were associated with different nested aspects of the educational context. We also calculated the ICC for the residual variance, which is unexplained by contextual factors and attributed to the student.
In this study, the students were in classes taught by teachers, teachers taught multiple classes, and these teacher-class combinations existed within schools. After estimating multilevel models with random intercepts for each level of context (classes, teachers, schools) for each fidelity metric (assignments started, total problems, problems per assignment), we calculated ICCs for each level of context (). Overall, the ICCs for teachers were the highest among the context variables for each fidelity metric. This finding suggests that the student’s teacher was the most important contextual factor in determining implementation fidelity. Notably, less than one-third of the variation in assignments started was associated with the student (0.29). This finding suggests that dosage is primarily a context-dependent factor, and this variable is a good indicator of context-level fidelity. Although ICCs for total problems and problems per assignment are highest for the students (0.45 and 0.63, respectively), moderate-to-high proportions of the variance (0.43 and 0.21) are still associated with the teacher. This finding suggests that the teachers may influence engagement and that engagement metrics are indicators of both student-level engagement and teacher-level fidelity.
Table 3. Intra-class correlations of student-level fidelity metrics by implementation context.
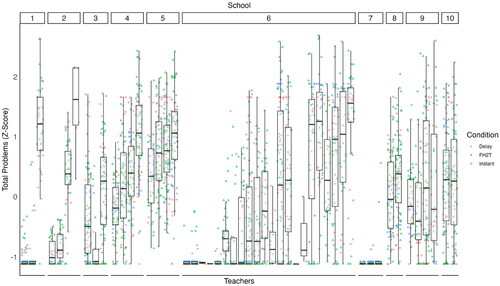
As a visual example of the within and between context variation in fidelity metrics, we present box plots of total problems for each teacher grouped by school in . The number of problems students attempted varied greatly by their teacher. Even within the same schools, there was substantial variation between the teachers’ distributions of problems their students attempted. For example, school six has teachers with students who attempted a few problems and teachers who attempted many problems. Alternatively, almost all of the students in school seven did not attempt many problems regardless of their teacher. The differences within teacher variation visualized by the differing heights of the boxes are also notable. Some teachers had high variation in the number of problems students attempted, although others had low variation as most students attempted similar numbers of problems.
Figure 2. Boxplots of total problems attempted standardized within condition by teacher. This visualization displays the variance in problems attempted across teachers and schools. There is extensive variation in the number of problems students completed across teachers, with some teachers’ students averaging under one standard deviation below the grand mean and others averaging one and half standard deviations above the grand mean.
RQ3: Can we classify high- and low-fidelity implementation contexts using the dosage and engagement metrics?
We identified which contexts provide different qualities of implementation fidelity using a latent profile analysis. Before estimating the latent profile model, we aggregated the fidelity metrics by teacher, taking their means and standard deviations of the metrics for students rostered under each teacher. We chose to include the teacher-level standard deviations, along with the means, in the model because we wanted to understand and account for the variation of student-level measurements within teachers. The latent profile model included 37 teachers and six variables. Although this sample size is small, simulation studies have found that high-quality indicators can compensate for small sample sizes in latent profile model estimation (Wurpts & Geiser, Citation2014).
To select the number of clusters, we compared the BIC of models with differing constraints. Latent profile models can differ in two ways: by the number of clusters and by constraints on how clusters are allowed to differ from one another. Clusters can differ by three dimensions: volume, shape, and orientation. The volume is the size of the multivariate space that each cluster can occupy. The shape is determined by the variances of the cluster dimensions within each profile. The orientation is the covariance of the variables within each profile. Clusters have either equal (E) or varying (V) volumes and shapes. They also have equal (E), varying (V), or undefined (I) covariance structures. We estimated models with one through nine clusters, and each model structure constraint possibility. visualizes the BIC comparison for each model, where the number of clusters is shown on the x-axis and the BIC is shown on the y-axis. The model with the lowest BIC closest to zero indicates the best fit (Wardenaar, Citation2021). In this analysis, the best-fitting model was a two-cluster model where the volume and shape were equal between clusters although the orientation varied (EEV).
Figure 3. Plot comparing fit (as measured by BIC) across models with differing numbers of clusters and structure constraints.
presents boxplots comparing the teacher-level aggregate fidelity metrics between teachers clustered into the two latent classes. compares the estimated model parameters from the mixture model–estimates of parameters characterizing latent classes of teachers drawn from the same population. The first two columns provide means and standard deviations of each measure and the last two columns give results of bootstrapped t-tests of the average differences of each measure between clusters in the population.
Figure 4. Boxplots and jittered scatter plots showing standardized means and standard deviations of averaged student-level fidelity metrics for high vs. low fidelity teachers. This figure shows the difference between high and low fidelity teachers on the fidelity metrics. High fidelity teachers had higher means on all metric showing that the model identified the teachers with higher usage students in the category. The high fidelity teachers also had higher standard deviations on assignments complete and total problems, suggesting more variability among students with these teachers. This was not the case for problems per assignment, in which low fidelity teachers had slightly higher standard deviations.
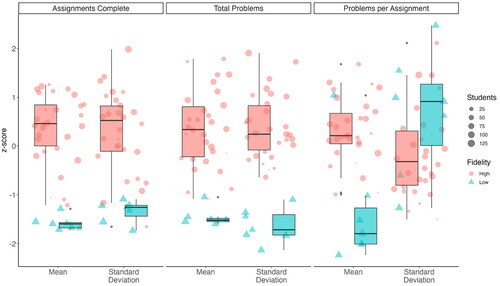
Table 4. Estimated model parameters from the mixture model and bootstrapped t-tests of statistical significance of model parameters between fidelity profiles.
Based on the model parameters of the fidelity metrics for each cluster, we labeled the two clusters as high and low fidelity. Of the 37 teachers included in the analysis, the model classified thirty as high fidelity and seven as low fidelity. The model parameters for the fidelity metrics mean for high-fidelity teachers were significantly higher for assignments started (t = −15.16, p < .001), problems attempted (t = −11.26, p < .001), and problems attempted per assignment (t = −3.27, p < .001) compared with low fidelity teachers. Notably, there was a nonsignificant difference in the standard deviations for assignments started between high- and low-fidelity teachers (t = −1.62, p = .124), despite there being a notable separation between the two profiles on this metric in the data, as displayed in . This suggests that for a different sample of teachers, differences in the variance of assignments started between teachers may be less pronounced than we see in the current sample. The standard deviations for total problems attempted were significantly higher for the high-fidelity teacher (t = −3.44, p = .003). This finding suggests that not only did the students in classes with low-fidelity teachers have lower fidelity metrics of dosage and engagement within the programs, but that few of these students deviated from their within-teacher peers’ behavior. Finally, low-fidelity teachers had significantly higher standard deviations for problems per assignment (t = 5.30, p < .001), suggesting that even though their students averaged low engagement during assignment, there was high variation in within-assignment productivity among these students.
Discussion
Monitoring implementation fidelity is essential to measuring a program’s impact (Durlak & DuPre, Citation2008; List et al., Citation2021), yet effectively conducting this monitoring at scale can be challenging. This study presents an alternative to the traditional method of implementation monitoring by using log-file data automatically collected through online learning platforms. By conducting a variety of analyses on variables created from log-file data, we were able to identify fidelity metrics that align with implementation expectations. Using these metrics, we evaluated levels of implementation context based on associations with the fidelity metrics and identified teachers as the most important contextual factor for fidelity. Finally, we identified latent profiles of fidelity among the teachers, classifying teachers as having high or low fidelity. This work provides a proof of concept for using students’ log-file data to estimate fidelity metrics and classifications that align with the traditional understanding of fidelity as a contextual construct at the teacher level.
As an evaluation of the implementations in the FH2T efficacy study, the analysis provided valuable information for understanding the implementation contexts in which students used their assigned programs during the study. Most notably, our analysis identified teachers as the most critical factor in determining the dosage students receive, although also providing evidence that teachers influenced engagement. Furthermore, we found that most teachers fell into the high-fidelity category, despite the complications presented by the COVID-19 pandemic in implementing the study. However, it is notable that there was much variance between teachers on these fidelity metrics, even in the high-fidelity category. This finding suggests that some of those trying to implement the study with fidelity struggled to ensure that all their students received dosage and displayed engagement aligned with program expectations.
This study also provides a template for monitoring implementation fidelity remotely. Our steps of selecting and standardizing fidelity metrics, evaluating which levels of context (class, teacher, or school) are most relevant to fidelity, and identifying different implementation types that may be replicated in future studies to monitor and assess implementations remotely. Decisions regarding what to measure when evaluating fidelity must align with each program’s idiosyncrasies (Breitenstein et al., Citation2010; Carroll et al., Citation2007; Kulo & Cates, Citation2013). Therefore, fidelity measures must address the studied programs’ essential components and metrics aligned with those components, regardless of the method of data collection - observations, self-reports, or utilization of log-file data (Al-Ubaydli et al., Citation2019). The selection of variables should be specific to the programs and researchers’ implementation expectations and may differ substantially for our metrics, but similar methods can still be applied. An added complication of log-file data is that the fidelity variables—like the number of problems attempted—may not be balanced across conditions. Our method of standardizing variables within conditions allows for cross-context comparison that is unconfounded by differences within each condition.
Measuring the association between the fidelity metrics and the contextual variables provides essential information about what aspects of a participant’s context may influence their fidelity-related behaviors. In the FH2T efficacy study, students’ teachers were the most important context factor, but this might differ for other programs. Some programs may have implementations that vary substantially by class even when the teacher remains constant because the various groups of students in classes differ, whereas other programs require school-wide implementations to ensure fidelity (Macaruso et al., Citation2019; Kaur, Citation2015). These distinctions have implications beyond evaluating fidelity in an efficacy study, as this information could help inform where resources are provided in the future to support implementations. For example, if most of the variance in the fidelity metrics is associated with the school, then when implementing the program in the future, providing professional development to administrators may help influence implementation fidelity.
Benefits and challenges of remote implementation fidelity monitoring using log-file data
There are some notable benefits to monitoring implementation fidelity using students’ log-file data. First, the information is highly reliable, as a computer automatically captures it. Unlike self-reports which may not accurately describe the implementation (Gresham et al., Citation2017), log-file data provides objective data on implementation-related behaviors. This form of passive observation is also unlikely to influence teacher and student behavior, which may not be true of direct observations (Cook, Citation1962). Second, the method avoids the cost of direct observations, which require multiple observations per teacher to provide reliable data (Cross et al., Citation2015). Third, log-file implementation monitoring provides ubiquitous monitoring through the implementation without requiring additional resources. Acquiring this amount of data through either direct observations or self-reports would be infeasible.
Remote monitoring of implantations may have the added benefit of being scalable beyond the research environment. In theory, similar data can be provided to educators through dashboards which will help classroom teachers monitor their students and administrators understand the implementations of their teachers. With these dashboards, information gathered during the study serves not only as an assurance that the programs were appropriately implemented during the study but also as a way to create metrics that can be used later to monitor whether future implementations align with study conditions. Thus, implementation fidelity data can be incorporated into the learning analytics framework, which includes using metrics from learning technologies to drive interventions which impact student learning (Clow, Citation2012; Wise et al., Citation2021). This will likely mitigate the “voltage effects” caused by inconsistencies in implementations as programs are scaled (Al-Ubaydli et al., Citation2019).
Although utilizing log-file data is a viable option for implementation monitoring for many studies of online learning platforms, this method presents some challenges. Researchers must consider data accessibility, integration, and usability using this monitoring method. Notably, we did not have access to log-file data for one condition in our larger study, DragonBox, which limited our ability to study its implementation fidelity. Whereas the FH2T study uses student-level randomization, the lack of data did not bias our estimates of teacher-level implementations. However, for studies using class- or school-level randomization, the lack of data from one program would present a severe challenge to fidelity-related analyses. Furthermore, data accessibility can be complicated by more complex program designs. In blended learning programs, where teachers and students engage in the learning process both online and offline (Hrastinski, Citation2019), using log-file data to measure dosage and engagement may be more difficult or even impossible. Future work should focus on understanding how to incorporate other components of log-file data, such as teacher logins, to accommodate more complex implementations.
Even when studying and monitoring programs focusing solely on in-program dosage and engagement, understanding broader implementation contexts may still be essential. Monitoring through log-file data cannot replace information gained from interactions with teachers and administrators about how programs are implemented. Qualitative data from in-person observations can still provide valuable insights into implementation aspects that may be hard to glean from quantitative data captured by computers. There is still much to be gained from more qualitative analysis of implementation contexts, even if log-file data can produce quality quantitative metrics for dosage and engagement.
Finally, we must consider how the data are used. Although log-file data may be used for improving program implementations outside of the research contexts, there are serious concerns that must be addressed if this or similar methods are adopted in schools. In efficacy studies, implementation fidelity monitoring is primarily observational, but when monitoring is used as a part of the program implementation, the data must be actionable. These data should be used to help educators have visibility into students’ work and help encourage implementation fidelity that leads to better outcomes. Yet, data could also be used to evaluate educators, which may have adverse effects on their teaching. If a teacher is assessed based on log-file data fidelity metrics, they will be incentivized to focus on meeting those metrics at the cost of thinking deeply about what their students need to learn, similar to the phenomenon of teaching to the test (Popham, Citation2001). Furthermore, research across multiple fields of work suggests that metricization of work may have adverse effects on workers’ mental health, stress, and the likelihood of burnout (Gleason, Citation2021; Kulikowski, Citation2023; Pishghadam et al., 2013). Thus, utilizing log-file data to help educators improve student outcomes should be conducted cautiously, with the goal of ensuring that we are creating and maintaining healthy learning environments for teachers and students.
Limitations and future directions
This work also has several limitations and presents opportunities for expanding our ability to study implementations remotely. The first limitation is the lack of observational data by which to validate the log-file data. This data is unavailable due to concerns posed by implementing the study during a pandemic, but future work should examine alignments between traditional and remote methods of implementation monitoring observations. Another limitation of our use of log-file data is that it creates univariate dimensions for complex constructs such as engagement. Although metrics like problems attempted may provide indications of engagement, they do not always provide rich data on the quality of that engagement or why a student is engaged or disengaged. Others have attempted to utilize log-file data to detect specific engagement behaviors, such as where students are “gaming-the-system” (Paquette & Baker, Citation2019), exhibiting unproductive persistence (Botelho et al., Citation2019), and even displaying specific affects (Ocumpaugh et al., Citation2014). Future work could utilize these detection methods to provide more information about the qualities of student engagement that better illuminate the implementation fidelity context.
Although this analysis provides valuable information for understanding the implementations in the FH2T efficacy study, there are still unanswered questions. First, the current study does not explicit connect fidelity to student outcomes because low-fidelity students rarely took the post-test; therefore, it is impossible for us to make inferences about differences in outcomes for high and low-fidelity students. Future research should address the differential effects of the programs based on whether their teachers are classified as high versus low fidelity. Second, future research should also address whether there were differences in implementation based on whether students were remote or in-person. This research would be helpful for further understanding implementation contexts and how teachers influence student dosage and engagement even when they were not physically proximal. Finally, more work should be conducted to understand how log-file data related to implementation fidelity can be used to improve implementations outside of the research context and for blended learning programs where teachers are more involved in program implementations.
Conclusion
This work illustrates an alternative method for monitoring implementation fidelity for efficacy studies of online learning platforms by accurately identifying high- and low-fidelity environments. Although the origin of this study is situational (e.g. the COVID-19 pandemic), the applications are broad. As educational technologies have advanced the ability to implement large-scale educational programs and as these programs become more prevalent in educational settings, we must also be able to measure these implementations at scale although evaluating their impacts. This article complements the growing body of literature that utilize log-file data to evaluate implementations (Crawford et al., Citation2012; Helsabeck et al., Citation2022; Rutherford et al., Citation2014; Wolgemuth et al., Citation2014) by addressing the value of assessing implementation contexts using student-level data extracted from online learning platforms. By evaluating students’ usage and engagement data in the FH2T efficacy study, we provide assessments of the implementations of the studied programs. Furthermore, by presenting a procedure for utilizing log-file data in evaluating implementations, we demonstrate the feasibility of using log-file data to investigate implementation fidelity that can be applied in other studies of online learning platforms.
Participant consent Statement
This research was approved by the Institutional Review Board at Worcester Polytechnic Institute. This research was conducted in a United States public school district and involved typical educational practices, thus did not require parental consent. Instead, parents were informed about the research, and the data collected from the educational technologies through a letter and could opt their child out of this study.
Disclosure statement
No potential conflict of interest was reported by the author(s).
Data availability statement
All data used for this study are available through the Open Science Foundation for those who fill out a data-sharing agreement (DSA) available here: https://osf.io/r3nf2/ (DOI 10.17605/OSF.IO/R3NF2). Once the DSA has been processed, researchers can access the data here: https://osf.io/2vftm/. Instructions for extracting the specific data used in this study are embedded within the R script found here: https://github.com/kirkvanacore/ImplementationFidelity_Analysis/blob/master/JCAL_IES_Fidelity_OPEN.Rmd. This script allows also allows researchers to completely reproduced the analyses presented in this article.
Additional information
Funding
Notes on contributors
Kirk Vanacore
Kirk Vanacore is a Graduate Student Researcher in the Learning Sciences Department at Worcester Polytechnic Institute. He studies how online learning platforms are transforming teaching practices and how they can be optimized to induce productive struggle and help students experience deep learning.
Erin Ottmar
Erin Ottmar is an Associate Professor of Learning Sciences and Psychology at Worcester Polytechnic Institute. Her interdisciplinary research aims to better understand how perceptual learning and educational technologies can be leveraged to unpack how cognitive and noncognitive pathways improve mathematics teaching and learning.
Allison Liu
Allison Liu is a Senior Evaluation Specialist at Lexia. She received her Ph.D. in Cognitive Psychology (Cognitive Neuroscience concentration) from the University of Pittsburgh. Her research interests lie in understanding the cognitive and motivational factors that influence learning and engagement across the lifespan, with a focus on large-scale educational technologies.
Adam Sales
Adam Sales is an Assistant Professor of Statistics at Worcester Polytechnic University. His research focuses on ways to use computer log data and administrative data to make stronger and more nuanced causal claims, principally in education research.
References
- Adair, J. G., Sharpe, D., & Huynh, C. L. (1989). Hawthorne Control Procedures in Educational Experiments: A Reconsideration of Their Use and Effectiveness. Review of Educational Research, 59(2), 215–228. URL: Publisher: American Educational Research Association. https://doi.org/10.3102/00346543059002215
- Al-Ubaydli, O., List, J. A., & Suskind, D. (2019). The science of using science: Towards an understanding of the threats to scaling experiments. National Bureau of Economic Research, 1–33. https://doi.org/10.3386/w25848
- Bos, S. E., Powell, S. R., Maddox, S. A., & Doabler, C. T. (2023). A synthesis of the conceptualization and measurement of implementation fidelity in mathematics intervention research. Journal of Learning Disabilities, 56(2), 95–115. https://doi.org/10.1177/00222194211065498
- Botelho, A. F., Varatharaj, A., Patikorn, T., Doherty, D., Adjei, S. A., & Beck, J. E. (2019). Developing early detectors of student attrition and wheel spinning using deep learning. IEEE Transactions on Learning Technologies, 12(2), 158–170. https://doi.org/10.1109/TLT.2019.2912162
- Breitenstein, S. M., Gross, D., Garvey, C. A., Hill, C., Fogg, L., & Resnick, B. (2010). Implementation fidelity in community-based interventions. Research in Nursing & Health, 33(2), 164–173. https://doi.org/10.1002/nur.20373
- Carroll, C., Patterson, M., Wood, S., Booth, A., Rick, J., & Balain, S. (2007). A conceptual framework for implementation fidelity. Implementation Science: IS, 2(1), 40. https://doi.org/10.1186/1748-5908-2-40
- Clow, D. (2012). The learning analytics cycle: Closing the loop effectively [Paper presentation]. Proceedings of the 2nd International Conference on Learning Analytics and Knowledge (pp. 134–138). https://doi.org/10.1145/2330601.2330636
- Cook, D. L. (1962). The Hawthorne effect in educational research. The Phi Delta Kappan, 44, 116–122. https://www.jstor.org/stable/ 20342865
- Crawford, L., Carpenter, D. M., Wilson, M. T., Schmeister, M., & McDonald, M. (2012). Testing the relation between fidelity of implementation and student outcomes in math. Assessment for Effective Intervention, 37(4), 224–235. https://doi.org/10.1177/1534508411436111
- Crooks, R. (2017). Representationalism at work: Dashboards and data analytics in urban education. Educational Media International, 54(4), 289–303. https://doi.org/10.1080/09523987.2017.1408267
- Cross, W., West, J., Wyman, P. A., Schmeelk-Cone, K., Xia, Y., Tu, X., Teisl, M., Brown, C. H., & Forgatch, M. (2015). Observational measures of implementer fidelity for a school-based preventive intervention: Development, reliability and validity. Prevention Science: The Official Journal of the Society for Prevention Research, 16(1), 122–132. https://doi.org/10.1007/s11121-014-0488-9
- Dane, A. V., & Schneider, B. H. (1998). Program integrity in primary and early secondary prevention: Are implementation effects out of control? Clinical Psychology Review, 18(1), 23–45. https://doi.org/10.1016/S0272-7358(97)00043-3
- Dart, E. H., Cook, C. R., Collins, T. A., Gresham, F. M., & Chenier, J. S. (2012). Test driving interventions to increase treatment integrity and student outcomes. School Psychology Review, 41(4), 467–481. https://doi.org/10.1080/02796015.2012.12087500
- Decker-Woodrow, L. E., Mason, C. A., Lee, J.-E., Chan, J. Y.-C., Sales, A., Liu, A., & Tu, S. (2023). The impacts of three educational technologies on algebraic understanding in the context of COVID-19. AERA Open, 9, 23328584231165919. https://doi.org/10.1177/23328584231165919
- Dieter, K. C., Studwell, J., & Vanacore, K. P. (2020). Differential responses to personalized learning recommendations revealed by event-related analysis [Paper presentation]. International Conference on Educational Data Mining (EDM). https://eric.ed.gov/?id=ED607826
- Durlak, J. A., & DuPre, E. P. (2008). Implementation matters: A review of research on the influence of implementation on program outcomes and the factors affecting implementation. American Journal of Community Psychology, 41(3-4), 327–350. https://doi.org/10.1007/s10464-008-9165-0
- Finch, W. H.,Bolin, J. E., &Kelley, K. (2019). Multilevel modeling using R (2nd ed.). CRC Press. https://doi.org/10.1201/9781351062268
- Fox, N. S., Brennan, J. S., & Chasen, S. T. (2008). Clinical estimation of fetal weight and the Hawthorne effect. European Journal of Obstetrics, Gynecology, and Reproductive Biology, 141(2), 111–114. https://doi.org/10.1016/j.ejogrb.2008.07.023
- Gleason, A. M. (2021). Remote monitoring of a work-from-home employee to identify stress: A case report. Workplace Health & Safety, 69(9), 419–422. https://doi.org/10.1177/2165079921997322
- Gresham, F. M., Dart, E. H., & Collins, T. A. (2017). Generalizability of multiple measures of treatment integrity: Comparisons among direct observation, permanent products, and self-report. School Psychology Review, 46(1), 108–121. https://doi.org/10.1080/02796015.2017.12087606
- Gupta, S., Supplee, L. H., Suskind, D., & A, L. J. (2021). Failed to scale: Embracing the challenge of scaling in early childhood. In Scale-up effect in early childhood and public policy: Why interventions lose essay. In Scale-up effect in early childhood and public policy pp. (1–21). Routledge.
- Gurung, A., Botelho, A. F., & Heffernan, N. T. (2021). Examining student effort on help through response time decomposition [Paper presentation]. LAK21: 11th International Learning Analytics and Knowledge Conference, ACM, Irvine CA USA (pp. 292–301). https://doi.org/10.1145/3448139.3448167
- Helsabeck, N. P., Justice, L. M., & Logan, J. A. R. (2022). Assessing fidelity of implementation to a technology-mediated early intervention using process data. Journal of Computer Assisted Learning, 38(2), 409–421. https://doi.org/10.1111/jcal.12621
- Hrastinski, S. (2019). What Do We Mean by Blended Learning? TechTrends, 63(5), 564–569. https://doi.org/10.1007/s11528-019-00375-5.
- Hurwitz, L.B., 2019. Getting a read on ready to learn media: A meta-analytic review of effects on literacy. Child Development 90, 1754–1771. https://doi.org/10.1007/s11528-019-00375-5
- Hurwitz, L. B., & Macaruso, P. (2021). Supporting struggling middle school readers: Impact of the Lexia® PowerUp Literacy® program. Journal of Applied Developmental Psychology, 77(1), 101329. https://doi.org/10.1016/j.appdev.2021.101329
- Kaur, B. (2015). What matters? From a small scale to a school-wide intervention. ZDM, 47(1), 105–116. https://doi.org/10.1007/s11858-014-0645-4
- Kulikowski, K., Przytuła, S., & Sułkowski, L. (2023). When publication metrics become the fetish: The research evaluation systems’ relationship with academic work engagement and burnout. Research Evaluation, 32(1), 4–18. https://doi.org/10.1093/reseval/rvac032
- Kulo, V. A., & Cates, W. M. (2013). The heart of implementation fidelity: Instructional design and intent. Prevention Science: The Official Journal of the Society for Prevention Research, 53(3), 215–229. http://www.jstor.org/stable/44430114.
- Lee, J. E.,Ottmar, E.,Chan, J. Y. C.,Decker-Woodrow, L., &Booker, B. (Under-Review). In-person vs. virtual: Learning modality selections and movement during COVID-19 and their influence on student learning.
- Lee, C. Y. S., August, G .J., Realmuto, G. M., Horowitz, J. L., Bloomquist, M. L., Klimes-Dougan, B. (2008). Fidelity at a distance: Assessing implementation fidelity of the early risers prevention program in a going-to-scale intervention trial. Prevention Science, 9(3), 215–229. https://doi.org/10.1007/s11121-008-0097-6
- List, J. A., Suskind, D., Supplee, L. H., Macaruso, P., Marshall, V., & Hurwitz, L. B. (2021). The scale-up effect in early childhood and public policy: Why interventions lose impact at scale and what we can do about it. Routledge. https://doi.org/10.4324/9780367822972.
- Macaruso, P., Marshall, V., & Hurwitz, L. B. (2019). Longitudinal blended learning in a low SES elementary school. In Proceedings of Global Learn 2019-Global Conference on Learning and Technology (pp. 253–262). https://www.learntechlib.org/primary/p/210313/
- McCambridge, J., Witton, J., & Elbourne, D. R. (2014). Systematic review of the Hawthorne effect: New concepts are needed to study research participation effects. Journal of Clinical Epidemiology, 67(3), 267–277. https://doi.org/10.1016/j.jclinepi.2013.08.015
- McMurray, S. (2013). An evaluation of the use of Lexia Reading software with children in Year 3, Northern Ireland (6- to 7-year olds). Journal of Research in Special Educational Needs, 13(1), 15–25. https://doi.org/10.1111/j.1471-3802.2012.01238.x
- Ocumpaugh, J., Baker, R., Gowda, S., Heffernan, N., & Heffernan, C. (2014). Population validity for educational data mining models: A case study in affect detection. British Journal of Educational Technology, 45(3), 487–501. https://doi.org/10.1111/bjet.12156
- Ottmar, E., Lee, J.-E., Vanacore, K., Pradhan, S., Decker-Woodrow, L., & Mason, C. A. (2023). Data from the efficacy study of from here to there! A dynamic technology for improving algebraic understanding. Journal of Open Psychology Data, 11(1), 5. https://doi.org/10.5334/jopd.87
- Paquette, L., & Baker, R.S. (2019). Comparing machine learning to knowledge engineering for student behavior modeling: A case study in gaming the system. Interactive Learning Environments 27(5-6), 585–597. https://doi.org/10.1080/10494820.2019.1610450.
- Pishghadam, R., Adamson, B., Sadafian, S.S., Kan F.L.F., (2014) Conceptions of assessment and teacher burnout, assessment in Education: Principles, Policy & Practice, 21:1, 34–51, https://doi.org/10.1080/0969594X.2013.817382
- Popham, W. J. (2001). Teaching to the test? Educational Leadership, 58(6), 16–21. https://olms.ctejhu.org/data/ck/file/TeachingtotheTest-Popham.pdf
- Rubin, D. B. (1976). Inference and missing data. Biometrika, 63(3), 581–592. https://doi.org/10.1093/biomet/63.3.581
- Rutherford, T., Farkas, G., Duncan, G., Burchinal, M., Kibrick, M., Graham, J., Richland, L., Tran, N., Schneider, S., Duran, L., & Martinez, M. E. (2014). A randomized trial of an elementary school mathematics software intervention: Spatial-temporal math. Journal of Research on Educational Effectiveness, 7(4), 358–383. https://doi.org/10.1080/19345747.2013.856978
- Schechter, R. L., Kazakoff, E. R., Bundschuh, K., Prescott, J. E., & Macaruso, P. (2017). Exploring the impact of engaged teachers on implementation fidelity and reading skill gains in a blended learning reading program. Reading Psychology, 38(6), 553–579. https://doi.org/10.1080/02702711.2017.1306602
- Schoenwald, S. K., Garland, A. F., Chapman, J. E., Frazier, S. L., Sheidow, A. J., & Southam-Gerow, M. A. (2011). Toward the effective and efficient measurement of implementation fidelity. Administration and Policy in Mental Health, 38(1), 32–43. https://doi.org/10.1007/s10488-010-0321-0
- Scrucca, L., Fop, M., Murphy, T. B., & Raftery, A. E. (2016). mclust 5: Clustering, classification and density estimation using Gaussian finite mixture models. The R Journal, 8(1), 289–317. https://doi.org/10.32614/RJ-2016-021
- Shamir, H., Pocklington, D., Feehan, K., & Yoder, E, Waterford Research Institute, Sandy, Utah, USA (2019). Evidence for dosage and long-term effects of computer-assisted instruction. International Journal of Learning and Teaching, 5(3), 220–226. https://doi.org/10.18178/ijlt.5.3.220-226
- Smith, J. D., Schneider, B. H., Smith, P. K., & Ananiadou, K. (2004). The effectiveness of whole-school antibullying programs: A synthesis of evaluation research. School Psychology Review, 33(4), 547–560. https://doi.org/10.1080/02796015.2004.12086267
- Spector, J. M. (2013). Emerging educational technologies and research directions. Journal of Educational Technology & Society 16(4),537–567. https://www.jstor.org/stable/jeductechsoci.16.2.21.
- Tobler, N.S. (1986). Meta-analysis of 143 adolescent drug prevention programs: Quantitative outcome results of program participants compared to a control or comparison group. Journal of Drug Issues 16, 537–567. https://doi.org/10.1177/002204268601600405
- Vanacore, K., Dieter, K., Hurwitz, L., & Studwell, J. (2021). Longitudinal Clusters of Online Educator Portal Access: Connecting Educator Behavior to Student Outcomes [Paper presentation]. LAK21: 11th International Learning Analytics and Knowledge Conference, 540–545. https://doi.org/10.1145/3448139.3448195
- Wang, H., Woodworth, K. (2011). A randomized controlled trial of two online mathematics curricula. Society for Research on Educational Effectiveness. https://eric.ed.gov/?id=ED528686
- Wardenaar, K. J. (2021). Latent Profile Analysis in R: A tutorial and comparison to Mplus. PsyArXiv. https://osf.io/wzftr, https://doi.org/10.31234/osf.io/wzftr
- Wise, A. F., Knight, S., & Ochoa, X. (2021). What makes learning analytics research matter. Journal of Learning Analytics, 8(3), 1–9. https://doi.org/10.18608/jla.2021.7647
- Wistrom, C. A. (2017). Perceptions of school leaders regarding the benefits of leadership dashboards (Order No. 10812880). Available from ProQuest One Academic; Publicly Available Content Database. http://ezproxy.wpi.edu/login?url=https://www.proquest.com/dissertations-theses/perceptions-school-leaders-regarding-benefits/docview/2039026967/se-2
- Wolgemuth, J. R., Abrami, P. C., Helmer, J., Savage, R., Harper, H., & Lea, T. (2014). Examining the impact of ABRACADABRA on early literacy in Northern Australia: An implementation fidelity analysis. The Journal of Educational Research, 107(4), 299–311. https://doi.org/10.1080/00220671.2013.823369
- Wu, K. S., Lee, S. S. J., Chen, J. K., Chen, Y. S., Tsai, H. C., Chen, Y. J., Huang, Y. H., & Lin, H. S. (2018). Identifying heterogeneity in the Hawthorne effect on hand hygiene observation: A cohort study of overtly and covertly observed results. BMC Infectious Diseases, 18(1), 1–8. https://doi.org/10.1186/s12879-018-3292-5
- Wurpts, I. C., & Geiser, C. (2014). Is adding more indicators to a latent class analysis beneficial or detrimental? Results of a Monte-Carlo study. Frontiers in Psychology, 5, 920. https://doi.org/10.3389/fpsyg.2014.00920