
 ?Mathematical formulae have been encoded as MathML and are displayed in this HTML version using MathJax in order to improve their display. Uncheck the box to turn MathJax off. This feature requires Javascript. Click on a formula to zoom.
Abstract
The objective of this paper is to conduct a comprehensive investigation into the buckling and post-buckling behavior of hyperelastic beams through both computational and experimental means. Natural rubber is used in the construction of a beam with a square cross-section. To determine the mechanical properties of natural rubber, a uniaxial tensile test is performed in accordance with ASTM D412. In finite element modeling (FEM), the nonlinear behavior of rubber is modeled using hyperelastic theory and the Yeoh strain energy function. The Static-Riks method is also implemented using Abaqus for the analysis of nonlinear buckling. To validate the present investigation results with FEM, an experimental test of digital image correlation (DIC) is conducted. The critical buckling force obtained via numerical methods exhibits an error of nearly 5% when compared to the corresponding results obtained from experimental testing. In order to ascertain the impact of various design parameters on the buckling behavior of the system, a comprehensive parametric analysis has been conducted. The parameters studied include the cross-sectional thickness, length of the structure, eccentric loads, as well as the mechanical properties of the materials used in the system. Consistent with the FEM outcomes, the critical buckling force exhibited by the hyperelastic beam demonstrates a positive correlation with increasing levels of hardness, cross-sectional thickness, and eccentric loads. The buckling behavior of the system is adversely affected by increasing its length. To ultimately validate the precision and reliability of the model, a supervised neural network (NN) learning method is employed.
1. Introduction
The stability of a structure under external and irregular loads is one of the most significant parameters in design. Structural engineers analyze the structure’s strength, stiffness, and durability, and determine appropriate materials and elements to use. To ensure stability, they use computer simulations, physical testing, and mathematical modeling to predict how the structure will behave under different conditions. Stability is crucial for providing safety and security to occupants (Chai and Yap Citation2008; Ebrahimi-Mamaghani et al. Citation2021; Vahidi Bidhendi et al. Citation2022; Zangoei et al. Citation2023; Zolfagharian et al. Citation2022). To estimate a structure’s critical buckling load (bifurcation), an Eigenvalue Buckling Analysis is generally used. This analysis can be performed as the initial step in a global analysis of an unloaded structure or after preloading the structure. By accurately predicting the critical buckling load, engineers can ensure that the structure is designed to withstand expected loads and avoid failure. (Akgöz and Civalek Citation2022; Cai, Gao, and Qin Citation2014; Civalek, Dastjerdi, and Akgöz Citation2022a; Forooghi and Alibeigloo Citation2022; Forooghi et al. Citation2022b). Novoselac, Ergić, and Baličević (Citation2012) perused numerical analysis of buckling and post-buckling behaviors of a bar considering the effects of the imperfections. They performed nonlinear buckling analysis with the Riks method. (Li et al. Citation2016) modeled the buckling and vibrational frequency of sandwich conical shells which have reinforced cores. Their experimental outcomes demonstrated that the semi-vertex angle of the cone has a significant impact on the vibrational frequency. (Huang et al. Citation2022) perused a geometric mesh free collocation (IMC) for the static, vibration, and buckling behaviors of composite plates. Based on Euler-Bernoulli beam theory, (Hosseini, Arvin, and Kiani Citation2022) modeled the buckling and post-buckling behavior of a rotating fully clamped functionally graded beam. They investigated the effect of different parameters such as rotor radius, the beam length to the thickness ratio, and the rotation speed on the critical buckling load. (Civalek, Uzun, and Yaylı Citation2022b) studied the buckling of a nanoscale restrained beam based on nonlocal Euler–Bernoulli beam theory by considering functionally graded materials.
Hyperelastic materials, also known as rubber-like materials, are materials that exhibit a large deformation when subjected to an external load and can return to their original shape when the load is removed. These materials are commonly used in a wide range of applications, including biomedical engineering, automotive industry, aerospace engineering, and more (Emam Citation2009; Emam and Nayfeh Citation2009; Hamzehei et al. Citation2018; Sharma et al., Citation2022; Hamzehei et al. Citation2020; Selvan T et al., Citation2022; Wang and Zhu Citation2021a, Citation2021b, Citation2022). The use of hyperelastic materials in these industries has gained significant attention in the field of nonlinear-elasticity and engineering due to their unique mechanical properties. Hyperelastic materials exhibit nonlinear stress-strain behavior, which means that their deformation is not proportional to the applied stress (Amabili et al. Citation2016; Attard Citation2003a; Citationb; Attard and Hunt Citation2008a; Azarniya, Rahimi, and Forooghi Citation2023; Dastjerdi et al. Citation2022; Khaniki et al. Citation2022a; Liu and Dai Citation2014; Mehta, Raju, and Saxena Citation2022b). This behavior is in contrast to linear elastic materials, such as metals, which exhibit a linear stress-strain relationship. These hyperelastic materials are widely used in various industries due to their unique mechanical properties. These materials exhibit nonlinear stress-strain behavior and can withstand large deformations without permanent damage or failure. The use of hyperelastic materials has gained significant attention in the field of nonlinear-elasticity and engineering due to their wide-ranging practical applications. There are several pieces of research regarding the buckling and post-buckling of hyperelastic structures. In this regard, (Dai and Wang Citation2012) studied the buckling and post-buckling of a hyperelastic rectangular layer with boundary condition sliding. They used the combined series-asymptotic expansions to derive nonlinear ordinary differential equations of hyperelastic layer. (Liu Citation2018) scrutinized the buckling of a hyperelastic tube under limited compression and consider both axial and circumferential modes. (Chen and Jin Citation2020) performed the post-buckling analysis for hyperelastic columns under axial compression. Their results showed that with the increasing width-to-length ratio for hyperelastic columns, they change from continuous state to snapping-through and snapping-back. (Flores et al. Citation2011) investigated hyperelastic finite element-based lattice for buckling behaviors in single wall carbon nanotubes. they adopted the Ogden’s strain energy function to determine the equivalent mechanical response of C–C bonds in SWCNTs. (Cai, Gao, and Qin Citation2014) scrutinized the post-buckling of a large deformed beam by utilizing the canonical dual finite element method (CD-FEM). (Chen and Jin Citation2021) investigated experimental and numerical snapping-back buckling of wide hyperelastic columns using reusable energy absorbing. (Attard and Hunt Citation2008b) developed the macro-buckling equations for a sandwich column. They used Timoshenko beam displacement theory and hyperelastic neo-Hookean formulation for constitutive relationships and equilibrium equations.
The Digital Image Correlation (DIC) method is an effective tool for solving a wide range of complex engineering problems. This is because the method has the ability to calculate the full-field displacement, which is essential in analyzing deformations in a material or structure. The DIC method is also a nondestructive testing method, which means that it does not cause any permanent damage to the material being analyzed. Additionally, the method has a high measurement sensitivity, which allows for accurate and precise measurements of deformations in the material or structure. Due to these unique properties, the DIC method is a valuable tool in many fields of engineering, including materials science, mechanical engineering, civil engineering, and aerospace engineering (Azarniya and Rahimi Citation2022; Peres and Bono Citation2011; Shojaeifard, Wang, and Baghani Citation2022; Tabatabaei and Fattahi Citation2022; Zangoei et al. Citation2023). In this approach, spots of the staining pattern are tracked before and after loading on the sample surface. (Cabello et al. Citation2016) introduced a novel approach for simulating sandwich beams including flexible core materials. By utilizing the elasticity theory and developing it for hyperelastic materials, they presented an analytical model and compared its outcomes with the DIC. In 2021, (Giordano, Mao, and Chiang Citation2021) performed the practical process of DIC to peruse the three-point bending of sandwich beams which are constructed by foam core and composite skins. In their work, the displacement and strain outcomes were compared with the analytical results.
The objective of this study is to analyze the buckling and post-buckling behavior of hyperelastic beams that have a square cross-sectional shape. The study aims to investigate how the mechanical properties of the hyperelastic material affect the deformation behavior of the beams when subjected to external loads that induce buckling. The analysis will provide insight into the nonlinear behavior of the beams and how they buckle. The findings of this study will contribute to a better understanding of the mechanics of hyperelastic materials and their applications in structural engineering. The main practical applications of such structures are in different mechanical systems that involve hyperelastic axially moving beams, such as treadmills, belt operating power transmission systems, conveyors, roll-to-roll systems, technical textile manufacturing processes, flexible electronics and nanotechnology and continuously variable transmissions. Modeling the nonlinear material and post-buckling analysis is carried out using Yeoh strain energy functions and the Static-Riks method. As part of the assessment of the mechanical properties of natural rubber, a uniaxial tensile test is conducted in accordance with ASTM D412. To validate the accuracy of the Finite Element Method (FEM) used in this study, the results obtained from the FEM analysis are compared to those obtained from a Digital Image Correlation (DIC) experimental test. By comparing the results of the two methods, the accuracy of the FEM can be evaluated and any discrepancies can be identified and analyzed. This validation process ensures that the FEM model used in the study is reliable and can be used to accurately predict the behavior of the material or structure being analyzed. The use of multiple methods for validation is a common practice in engineering research to ensure the accuracy and reliability of the results obtained. In addition to the Finite Element Method (FEM) analysis and experimental testing, a supervised neural network is developed to predict the critical buckling load of the system being studied. The neural network is trained using a set of input data and corresponding output data, which includes information about the material properties, geometry, and loading conditions of the system. Once trained, the neural network can be used to predict the critical buckling load of the system with a high degree of accuracy. The predictions made by the neural network are compared to the results obtained from the FEM and experimental testing to verify the accuracy of the model. This approach ensures that the results obtained from the study are reliable and can be used to make informed decisions about the design and performance of the material or structure being analyzed. In conclusion, the current research provides a thorough and comprehensive evaluation of various parameters and conditions related to the behavior of the material or structure being studied. The findings of the study can be used as a basis for further research in the field of structural engineering, providing valuable insight and understanding of the system being analyzed. The comprehensive assessment of the parameters and conditions provides a foundation for future studies to build upon and can inform the development of new structural models and approaches to engineering design. Overall, the current research contributes to the advancement of knowledge in the field and has the potential to impact future engineering practices.
2. Fabrication of specimens and experimental procedure
This section provides a detailed discussion of the manufacturing process for hyperelastic beams, determination of mechanical properties, and the procedure for conducting buckling tests. Natural rubber beams are manufactured as described in Section 2.1. The design of metal molds and the testing of rheometers for the fabrication of systems are also discussed. Section 2.2 refers to the determination of the mechanical properties of rubber. The two final parts of this section provide a detailed description of the experimental buckling test, which was performed using the Digital Image Correlation (DIC) experimental method, as well as the Finite Element Simulation. DIC method is advantageous as it provides accurate and detailed information about the deformation behavior of the system during buckling. Therefore, the description of the experimental procedure is essential in providing a complete understanding of the test and the data obtained, ensuring the reliability of the results obtained in the study.
2.1. Rubber compound and structure
Natural rubber, Carbon Black, butadiene rubber, sulfur, and other additives presented in are the ingredients of rubber compound raw materials. Initially, butadiene rubber is softened in a two-roller mill at 400 rpm at 25 °C for 10 min, which improves rubber mixing. A Banbury mixer is then used to mix natural rubber with butadiene rubber for five minutes. For the next 5-7 min, the other ingredients mentioned in are added to the mixture. As a result of the cross-linking between polymer chains, adding sulfur to rubber improves its mechanical properties. The process takes place at a temperature of 70-80 degrees Celsius. The raw rubber sample leaves the Banbury mixer and is then turned into rubber bands with identical thicknesses by a two-roller mixer. An illustration of the rubber compound after it has been mixed with two rollers is shown in . Rubber compounds are manufactured and utilized due to their distinctive nonlinear elastic behavior. This behavior is characterized by a highly nonlinear stress-strain relationship, with stress being highly sensitive to small changes in strain. As a result, rubber compounds exhibit unique mechanical properties, such as large deformation capability, high energy absorption, and excellent damping capacity. These properties make rubber compounds highly desirable for various industrial applications, such as in the automotive and aerospace industries, where they are used in vibration isolation systems and as shock absorbers.
Figure 1. Raw rubber compound.
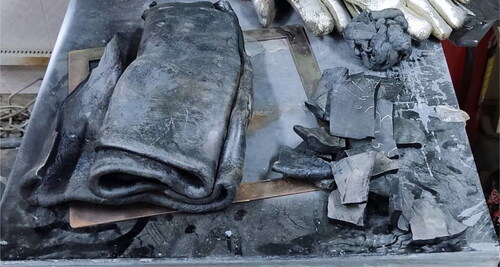
Table 1. Natural rubber ingredients.
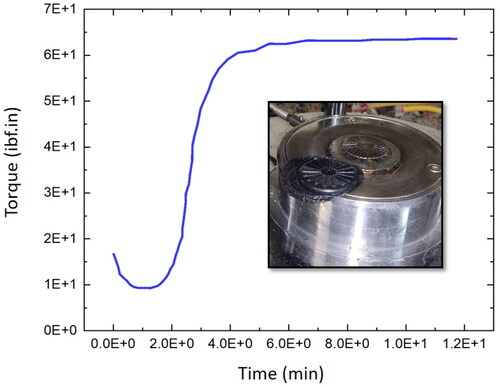
Rheometers are used to measure the curing time of rubber. The device is composed of two holes and a central disk. Between the two cavities, a rubber compound weighing 200 grams is placed. At a temperature of 140 °C, the middle disk rotates with an oscillating motion of ±1 degree and a rotational torque of 20 lbf.in. As the sample’s curing time rises, cross-links among the polymer chains are formed by the curing agent (sulfur), and the needed torque rises to a constant amount. As part of the production process of rubber products, this is the appropriate time for the sample to be cured. As can be observed in , the compound sample is made at 63 Ibf.in torque and reaches a constant amount at 10.2 min.
Figure 2. Rubber rheometer test diagram.
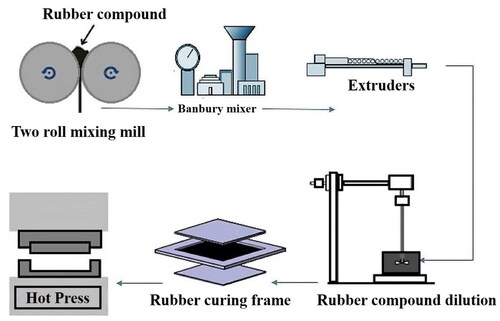
For the manufacture of a hyperelastic beam with a square cross-section, a metal mold is designed by means of SolidWorks software () and machined with an automatic lathe. Molds are made from MO40 steel, which is strong enough to withstand compressive forces and thermal stresses. Small pieces of rubber compound are embedded in the mold, making melting faster and preventing bubbles from forming. In the end, the rubber is pressed for 10 min with a hot press under 0.5 MPa, based on the results of the rheometer test. After curing the rubber compound, the hyperelastic beams are fabricated as . illustrates the steps of making a rubber beam. The constructed beams have a length of 250 mm and a square cross-sectional area of 400 mm2.
Figure 3. (a) Metal mold design and (b) steel mold and compound rubber.
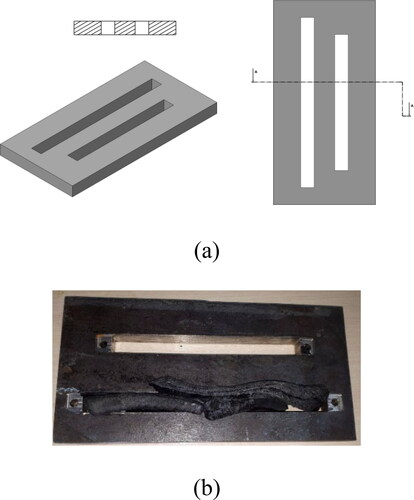
Figure 4. Steps of making a hyperelastic beam.
Eventually, due to the effective variables in the mechanical properties of the rubber, including curing time, molding method in hot press, percentage of ingredients, the temperature of Banbury mixer, etc., manufacturing several specimens is an important thing in reducing the possible experimental errors.
2.2. Mechanical properties of rubber
The ASTM D412 standard provides a reliable and standardized method for testing the tensile properties of rubbers, which can be useful in determining the suitability of materials for various applications. So, in order to find the appropriate hyperelastic criterion, the stress-strain curve of the uniaxial tensile test is obtained based on the ASTM D412 standard () and is imported to Abaqus software as input data (). Since the results of the uniaxial tensile test according to ASTM D412 can be influenced by many factors, including material composition, testing environment temperature and humidity, and stretching speed, multiple samples must be tested. Therefore, in this study, the presented outcomes represent the average of four tested samples. The coefficients of hyperelastic materials can be determined by comparing different strain energy functions such as Yeo, Neo-Hookean, OGDEN_N2, and ARRUDA_BOYCE to the uniaxial tensile test. Due to its small difference compared to the experimental test, Yeo is considered to be the strain energy function. Also, the Yeoh criterion is chosen as the congruence of the stress-strain curve of the uniaxial test ().
Figure 5. The uniaxial tensile test based on the ASTM D412 standard.
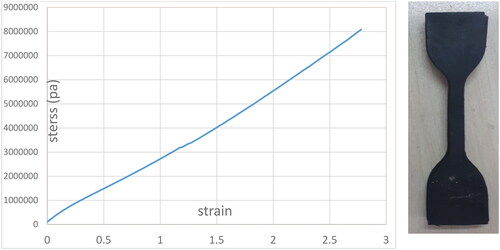
Figure 6. Overlap of experimental tensile test outcomes with strain energy functions.
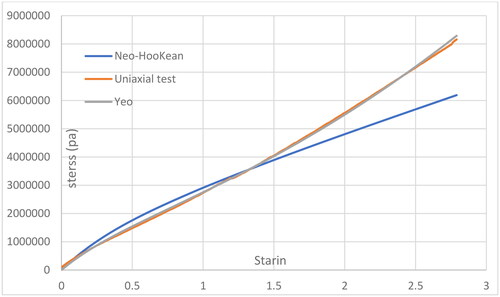
Table 2. Fixed coefficients of Yeoh and Neo-Hookean model (Khaniki et al. Citation2021; Khaniki et al. Citation2022b; Khaniki et al. Citation2022c).
2.3. Experimental test
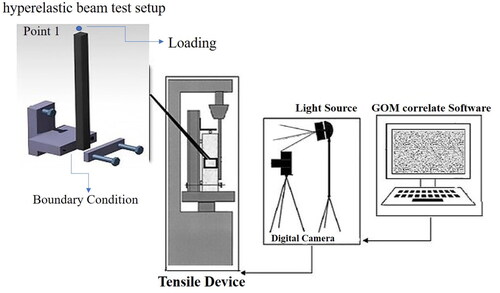
For the purpose of numerical simulation validation, DIC is used in the present study. DIC experiments include sample preparation, test setup, imaging of the sample surface using a digital camera before and after uploading and processing the image using GOM Correlate software (). The quality of the stain pattern is also a significant parameter in this method, with its clarity playing an important role in ensuring accurate image analysis and the determination of stress and deformation. A digital camera, a test setup, a tensile device, and a Dynamometer Sensor (Load Cell) are used as part of the experimental test equipment. In order to record force and displacement, a dynamometer sensor is installed on the hydraulic jack of the tensile device. At the top of the structure (point 1 in ), a hydraulic jack with a speed of 10 millimeters per minute is applied.
Figure 7. Experimental test steps of DIC.
Given the importance of photo recording speed, it is essential to use the maximum video recording speed to ensure high accuracy in image analysis and deformation measurement. Accurate calibration of the camera and image analysis system should also be considered when taking measurements.
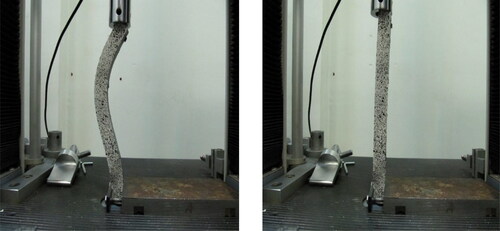
Finally, proper lighting is another crucial aspect of this approach. The accuracy of image analysis is affected by the laboratory’s lighting conditions. shows the boundary conditions and loading of the experimental test before and after deformation. The considered structure lies between the stand and the sheet metal, which is realized as a clamped boundary condition.
Figure 8. Experimental test of hyperelastic beams before and after loading.
2.4. Finite element method
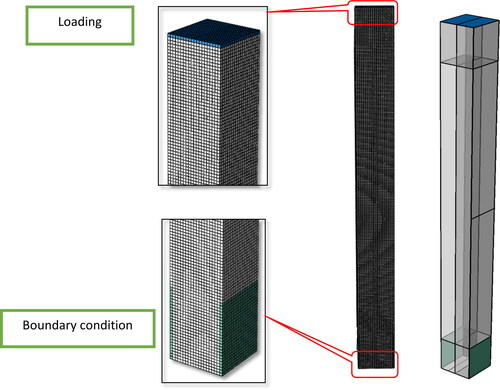
Abaqus software is used to simulate the FEM. Here, meshing with a significant edge size of 1 mm is performed after examining the convergence of the mesh for static bending. 3D beam components are constructed with 110691 and 100000 nodes and elements with C3D8RH types for hyperelastic beams with square cross-sections. Geometric nonlinear terms are taken into account in FE analysis due to large deformations during concentrated forces.
Uniaxial tensile test data is used to calibrate hyperelastic constitutive models of material behavior, which can also be evaluated using Abaqus software. Abaqus includes several constitutive hyperelastic models, such as Mooney-Rivlin, Polynomial, Neo-Hookean, Yeoh, and Ogden, that can fit experimental results of the uniaxial tensile test, check stability, and calculate material coefficients. The Yeo strain energy function is used to describe the material nonlinearity.
In addition, the boundary and loading conditions used in the numerical simulation are identical to those specified in the experimental study. The hyperelastic beam test setup (shown as the first drawing from the left in ) is modeled in Abaqus, with consideration given to the hydraulic jack operating at a speed of 10 mm/min. Clamped boundary conditions are defined, restricting the bottom edge of the beam (see and ). The first analysis is an eigenvalue problem to determine the critical buckling load.
Figure 9. Boundary and loading conditions in the finite element model.
Nonlinear static problems can sometimes result in buckling or collapse behavior, where the load-displacement response exhibits negative stiffness, and the structure must release strain energy to maintain equilibrium. The modified Static Riks method enables the identification of static equilibrium states during the unstable phase of the response. Therefore, for the analysis of hyperelastic beams post-buckling, the Static-Riks solver is implemented in Abaqus. The Static-Riks method solves displacements and loads simultaneously by using the magnitude of the load as an additional unknown. Arc length is the basis of the mentioned approach. Eventually, the displacement and strain contours are calculated numerically, and the results are validated through DIC experimental testing.
3. Results and discussion
The term buckling refers to the collapse of a structural member under high axial compression. During this collapse, the structural member suddenly deflects to the side. It is stated that the buckling load has been reached when the structure exhibits sudden lateral deflection under axial compression. Given the fact that buckling forces are lower than the maximum loads the structure can hold under axial compression, consideration of buckling during structural design is crucial. Under increasing loads, an axisymmetric structure (e.g., a column) reaches a critical load value (Pcr) at which its response can only take the form of two states in equilibrium. A purely compressed state without any lateral deflection or a purely deformed state (collapse).
An analysis of the stability of a hyperelastic beam is presented in this section. Section 3.1 discusses the Eigenvalue buckling analysis that determines the critical buckling load and mode shape. Moreover, in section 3.2, the Static-Riks solver is used to investigate the post-buckling analysis of the hyperelastic beam. Finally, DIC experimental results are compared to numerical results.
3.1. Eigenvalue buckling analysis
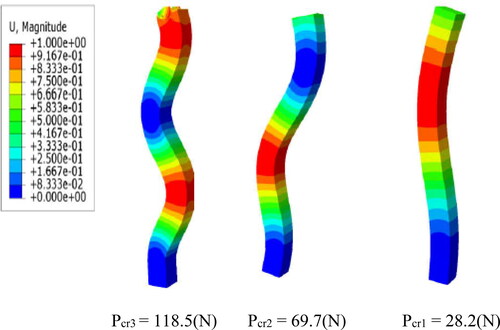
The first three critical buckling modes are illustrated in . The first linear eigenvalue is 28.2 N. As expected, it can be observed that the higher the modes, the higher the critical buckling loads.
Figure 10. First three buckling modes.
3.2. Post-buckling with the Static-Riks
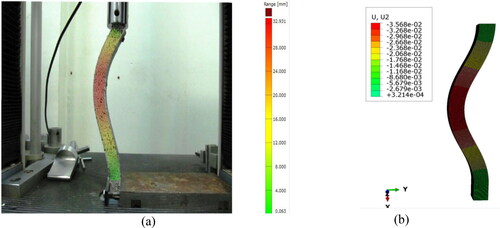
In Abaqus, the Static-Riks solver is used to perform the post-buckling analysis. This analysis assumes that a displacement of 16 mm is acting on top of the beam (i.e., in an ideal state) and that boundary conditions are clamped. and depict the X-axis and Y-axis displacement of the rubber beam in the FEM and the DIC. According to the numerical method, the maximum displacement of a beam is 16.66 mm and 35.68 mm, while the experimental test of DIC predicts 17.2 mm and 32.93 mm. It is assumed that the boundary conditions and the loading conditions are ideal in numerical simulations. In other words, The FEM ignores the influences of environmental conditions, friction effects in boundary conditions, etc., while they are present in experiments. So, there are differences between the results obtained by these two approaches.
Figure 11. The X-axis displacement contour of the (a) experimental test (b) finite element of the beam.
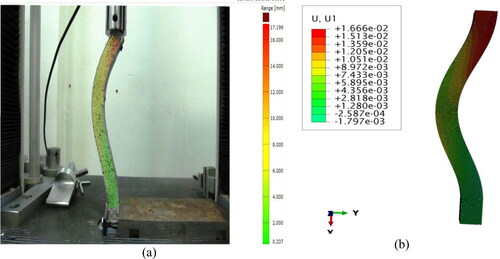
Figure 12. The Y-axis displacement contour of the (a) experimental test (b) finite element of the beam.
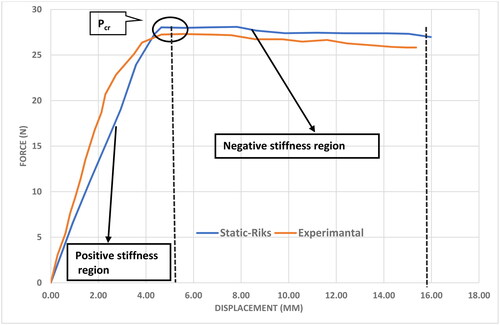
It is common to use load-displacement plots to determine how a structure may behave under load. This applies also to studying structural behavior in the post-buckling region (after the bifurcation point). Based on the load applied by the Riks algorithm, the load proportionality factor (LPF) can be schemed to identify pre-buckling and post-buckling regions. According to , the force-displacement diagram is depicted for the experimental test and the FEM. Static-Riks numerical results clearly show that the structure behaves in two regions of positive and negative stiffness. A buckling in the structure is indicated by a slope that changes from positive to negative on the force-displacement diagram. in other words, the structure instantly loses its load bearing capacity and exhibits a significant lateral displacement. As can be seen in the diagram, buckling is occurred at the displacement of 5 mm of the hyperelastic beam, where negative stiffness and load drop are occurred. According to the hyperelastic material FE model (i.e., Static-Riks) the critical buckling load is acquired similar to eigenvalue buckling analysis (i.e., Fcr ≈ 28.2 N). Moreover, the results obtained by Static-Riks have less variance than the experimental test, which indicates the validity of the numerical results.
Figure 13. The force-displacement diagram of the experimental test and the FEM.
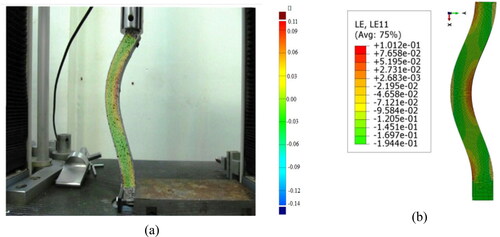
The strain in the x-axis direction of the hyperelastic beam in Abaqus software and the DIC experimental test is plotted in . According to the numerical simulation, the strain contour is compressive/tensile at the top/bottom of the neutral axis, which is similar to what was observed in the experimental test of digital image correlation. It can be seen that the structure is at the post-buckling region.
Figure 14. Strain contour of the (a) experimental test (b) finite element of the structure.
4. Parametric study
There are several design parameters that can influence the critical buckling load of a hyperelastic beam, including the thickness of the cross-section, the length, eccentric loads, and the mechanical properties of the beam. Below are subsections that discuss the effect of variations in the geometry and material of a system on its critical buckling force.
4.1. Effect of material
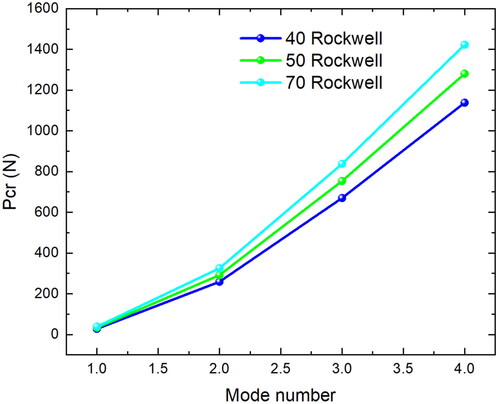
The hardness parameter is of significant importance in designing and manufacturing rubber compounds. The purpose of this subsection is to examine the effects of three rubber samples with Rockwell hardness coefficients of 40, 50, and 70. exhibits the change in the critical buckling load of the first four buckling modes given the hardness parameter difference. The length and width of the structure are 250 mm and 20 mm, respectively. The FEM results reveal that enhancing the hardness coefficient of the hyperelastic beam ascends the critical buckling force owing to its increasing effect on the stiffness of the structure.
Figure 15. Variations of critical buckling load versus the material hardness coefficient.
4.2. Effect of cross-section thickness
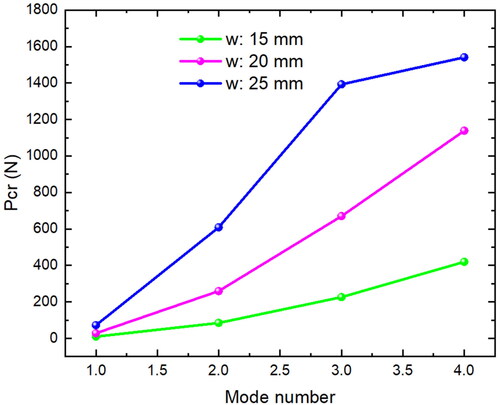
This subsection examines how changes in cross-section thickness impact the linear buckling behavior of hyperelastic beams. The hyperelastic beam has a length and width of 250 mm and 25 mm, respectively. The thicknesses of the cross-sections are 25, 20, and 15 mm, and the mechanical properties are set at C10 = 0.8 MPa. The variations of critical loads against the changes in cross-section thickness are illustrated in . It should be noted that increasing the w parameter leads to an increase in the critical load since there is a direct relationship between the critical load and the second moment of area. Also, as can be perceived, this increasing effect is more in the higher buckling modes.
Figure 16. Variations of critical buckling load versus cross-section thickness.
4.3. Effect of structure’s length
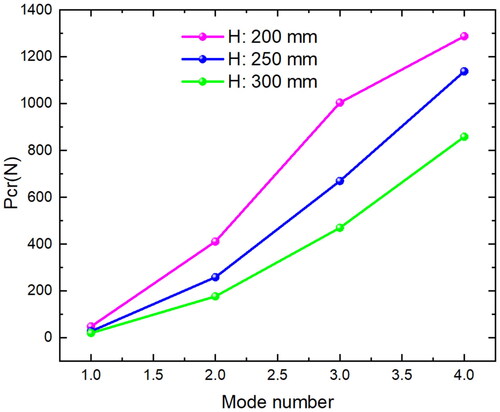
The purpose of this part is to examine the effect of beam length on the critical buckling force of the considered system. The structure has a width of 25 mm, a length of 200, 250, and 300 mm, and a mechanical property of C10 = 0.8 MPa. illustrates the critical buckling load versus the different lengths for the first four buckling modes. The results indicate that the H parameter has a considerable effect on the eigenvalue. So that enlargement of the length lessens the critical force. Since length significantly affects the stiffness of a structure, engineers and designers must pay close attention to the H parameter.
Figure 17. Variations of critical buckling load versus different lengths.
4.4. Effect of the eccentrical load
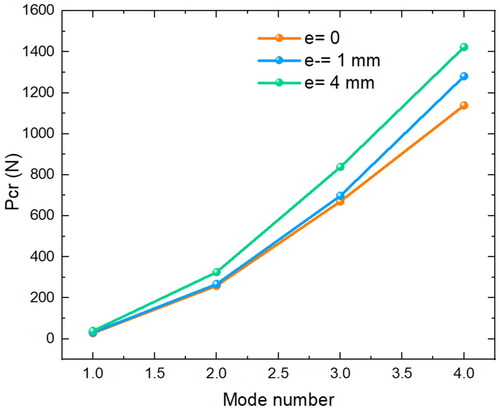
The influence of three eccentric loads on the system’s response is examined in order to determine the imperfection sensitivity of the hyperelastic beam. The analysis is performed for the first four buckling modes of the system under consideration. It is assumed that the rubber beams have a length and width of 250 mm and 20 mm, respectively. As is observed, increasing the eccentric loads causes an increment in the eigenvalue buckling ().
Figure 18. Variations of critical buckling force versus the eccentric loads.
investigates the influences of design parameters, including structure geometry, material properties, and eccentric loads on the studied system. Numerically derived results showed that enlarging the cross-section thickness, eccentric loads, and hardness coefficient result in the increment of eigenvalue buckling of the studied system. As a result, incrementing such parameters stabilizes the beam and delays the occurrence of buckling. In contrast, an increase in length has an inverse effect on the critical buckling load. In simple words, enhancing the length accelerate the occurrence of static instability in the system.
Table 3. Variations of linear eigenvalue versus geometry, material properties and eccentric loads.
5. Neural network
Validation and reliability of the quality of the results are the main concerns in any engineering problem. There are several options to consider, such as reducing risk, reducing errors, and finding an appropriate model to interpret the results of the analysis. This can be accomplished by using a Neural Network (NN) model as a tool to evaluate the accuracy of results generated by engineering problems. In NN models, neurons are represented in a series in a way that allows for the estimation and prediction of the model without prior knowledge of the inputs and outputs (Dey et al. Citation2016; Sharma et al., Citation2022; Forooghi et al. Citation2022a; Dey et al., Citation2019; Guo, Zhuang, and Rabczuk Citation2019; Mukhopadhyay et al. Citation2021a; Mukhopadhyay et al. Citation2023; Mukhopadhyay et al. Citation2021b).
The NN with one hidden layer provides accurate answers to the current problem since the data is small and does not follow nonlinear behavior. Therefore, for the purpose of avoiding extra costs in simulation, a NN model that is simple, efficient, fast, and cost-effective is used.
In order to validate the accuracy of the outcomes acquired from the finite element method using Abaqus software, an ANN is used for the present model. A shallow NN is applied according to the input numbers in this study, which is a supervised neural network composed of one layer. There are only one or two hidden layers in shallow neural networks (Bai et al. Citation2023; Shuai Wang et al. Citation2021). In the present work, the model takes into account the length of the beam, the material properties (Rockwell hardness coefficients), the thickness of the cross-section, and the eccentric loads as inputs to the neural network. Finally, the linear eigenvalue of the studied structure is considered the target. The algorithm and training algorithm are opted randomly and Levenberg–Marquardt, respectively.
Using Finite Element simulations is a common approach for generating training data for neural networks when experimental data is scarce or expensive (Naskar, Mukhopadhya, and Sriramula Citation2020). This method is especially effective when the difference between the results obtained from FEM and experimental tests is small. In this paper, the training dataset is obtained by extracting results from FEM simulations.
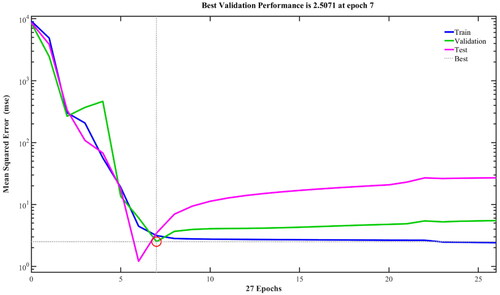
The target amounts of the database and the outcomes generated by the NN model must be compared in order to assess the performance of the network model and optimize the error between them. In order to assess and validate a model’s reliability, two statistical measures are commonly used - mean square error (MSE) and coefficient of determination (R2). As demonstrated in , the performance of the current problem is based on mean square error (MSE). The lowest MSE at Epoch 7 is the minimum value.
Figure 19. The training, validation, test, and whole model performance evolution versus the Epoch number.
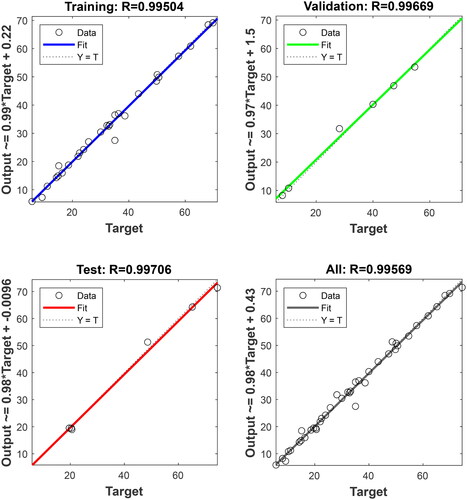
For four subsets, training, validation, testing, and all models, regression plots are presented on the basis of the correlation between outputs and targets. R2 values that are closer to 1 indicate a better fit and a better model as shown in . Regression plots evaluate output values computed by a network of four subsets and correlated with target values. In the graph below, the dotted lines represent the best fit between the two values (R2 = 1), while the solid lines represent the correlation between the calculated output and the initial target value. As indicated by the regression results, the generated outputs and targets show a good correlation.
Figure 20. The regression schemes for four subsets: (a) training, (b) validation, (c) test, and (d) full evaluation.
6. Conclusion and summary
The present work perused the experimental and numerical analysis of bucking and post-buckling of hyperelastic beams made of natural rubber. Besides using the Static-Riks theory for the post-buckling analysis, hyperelastic theory and Yeoh strain energy function were utilized to simulate rubber materials. The ASTM D412 standard was utilized in order to determine rubber’s mechanical properties. Furthermore, an experimental test of DIC was conducted in order to validate the results obtained from the FEM. As demonstrated, the simulation of FEM has a critical buckling force error of 5% compared with the experimental test. Furthermore, the obtained strain contour from the numerical approach was validated with DIC indicating the accuracy of the Yeoh energy function and the Static-Riks method. An analysis of changes in material properties, thickness and length of the beam, and eccentric loads showed that an increase in the linear eigenvalue was associated with an increase in cross-section thickness, and eccentric loads. Due to the increasing influence of the hardness coefficient on the stiffness of the structure, it has been observed that as the coefficient ascends, the stability region also expands. A longer beam, on the other hand, decreases the critical load and makes the system more vulnerable to the static instability occurrence. The results showed that higher buckling modes are more affected by changes in thickness. Specifically, the increasing effect of the thickness parameter is more pronounced in higher buckling modes. Given the important practical applications of this structure in fields such as medical implants, aerospace engineering, and robotics, engineers can increase the stability region (delaying the occurrence of static instability) or avoid accelerating the occurrence of buckling (shrinking the instability area) by fine-tuning these critical parameters. Additionally, a shallow NN model provided good results and was accurate in the validation process. A supervised neural network was found to be effective in improving the accuracy of the model. Further research can improve the model’s performance by optimizing it, and a model for these results may be developed in the future.
Acknowledgments
SN acknowledges the initiation grant received from the University of Southampton.
Disclosure statement
No potential conflict of interest was reported by the authors.
References
- Akgöz, B., and Ö. Civalek. 2022. Buckling analysis of functionally graded tapered microbeams via rayleigh–ritz method. Mathematics 10 (23):4429. doi: 10.3390/math10234429
- Amabili, M., P. Balasubramanian, I. D. Breslavsky, G. Ferrari, R. Garziera, and K. Riabova. 2016. Experimental and numerical study on vibrations and static deflection of a thin hyperelastic plate. Journal of Sound and Vibration 385:81–92. doi: 10.1016/j.jsv.2016.09.015.
- Attard, M. M. 2003a. Finite strain––beam theory. International Journal of Solids and Structures 40 (17):4563–84. doi: 10.1016/S0020-7683(03)00216-6.
- Attard, M. M. 2003b. Finite strain––isotropic hyperelasticity. International Journal of Solids and Structures 40 (17):4353–78. doi: 10.1016/S0020-7683(03)00217-8.
- Attard, M. M., and G. W. Hunt. 2008a. Column buckling with shear deformations—a hyperelastic formulation. International Journal of Solids and Structures 45 (14-15):4322–39. doi: 10.1016/j.ijsolstr.2008.03.018.
- Attard, M. M., and G. W. Hunt. 2008b. Sandwich column buckling–a hyperelastic formulation. International Journal of Solids and Structures 45 (21):5540–55. doi: 10.1016/j.ijsolstr.2008.05.022.
- Azarniya, O., and G. H. Rahimi. 2022. Numerical and experimental analysis of free vibrations and static bending of a sandwich beam with a hyperelastic core. Mechanics Based Design of Structures and Machines:1–23. doi: 10.1080/15397734.2022.2121721.
- Azarniya, O., G. Rahimi, and A. Forooghi. 2023. Large deformation analysis of a hyperplastic beam using experimental/fem/meshless collocation method. Waves in Random and Complex Media:1–20. doi: 10.1080/17455030.2023.2184645.
- Bai, J., T. Rabczuk, A. Gupta, L. Alzubaidi, and Y. Gu. 2023. A physics-informed neural network technique based on a modified loss function for computational 2D and 3D solid mechanics. Computational Mechanics 71 (3):543–62. doi: 10.1007/s00466-022-02252-0.
- Cabello, M., J. Zurbitu, J. Renart, A. Turon, and F. Martínez. 2016. A non-linear hyperelastic foundation beam theory model for double cantilever beam tests with thick flexible adhesive. International Journal of Solids and Structures 80:19–27. doi: 10.1016/j.ijsolstr.2015.10.017.
- Cai, K., D. Y. Gao, and Q. H. Qin. 2014. Post-buckling solutions of hyper-elastic beam by canonical dual finite element method. Mathematics and Mechanics of Solids 19 (6):659–71. doi: 10.1177/1081286513482483.
- Chai, G. B., and C. W. Yap. 2008. Coupling effects in bending, buckling and free vibration of generally laminated composite beams. Composites Science and Technology 68 (7-8):1664–70. doi: 10.1016/j.compscitech.2008.02.014.
- Chen, Y., and L. Jin. 2020. From continuous to snapping-back buckling: A post-buckling analysis for hyperelastic columns under axial compression. International Journal of Non-Linear Mechanics 125:103532. doi: 10.1016/j.ijnonlinmec.2020.103532.
- Chen, Y., and L. Jin. 2021. Reusable energy‐absorbing architected materials harnessing snapping‐back buckling of wide hyperelastic columns. Advanced Functional Materials 31 (31):2102113. doi: 10.1002/adfm.202102113.
- Civalek, Ö., S. Dastjerdi, and B. Akgöz. 2022a. Buckling and free vibrations of cnt-reinforced cross-ply laminated composite plates. Mechanics Based Design of Structures and Machines 50 (6):1914–31. doi: 10.1080/15397734.2020.1766494.
- Civalek, Ö., B. Uzun, and M. Ö. Yaylı. 2022b. An effective analytical method for buckling solutions of a restrained fgm nonlocal beam. Computational and Applied Mathematics 41 (2):67. doi: 10.1007/s40314-022-01761-1.
- Dai, H.-H., and F.-F. Wang. 2012. Analytical solutions for the post-buckling states of an incompressible hyperelastic layer. Analysis and Applications 10 (1):21–46. doi: 10.1142/S0219530512500029.
- Dastjerdi, S., A. Alibakhshi, B. Akgöz, and Ö. Civalek. 2022. A novel nonlinear elasticity approach for analysis of nonlinear and hyperelastic structures. Engineering Analysis with Boundary Elements 143:219–36. doi: 10.1016/j.enganabound.2022.06.015.
- Dey, S., T. Mukhopadhyay, S. Naskar, T. K. Dey, H. D. Chalak, and S. Adhikari. 2019. Probabilistic characterisation for dynamics and stability of laminated soft core sandwich plates. Journal of Sandwich Structures & Materials 21 (1):366–97. doi: 10.1177/1099636217694229.
- Dey, S., S. Naskar, T. Mukhopadhyay, U. Gohs, A. Spickenheuer, L. Bittrich, S. Sriramula, S. Adhikari, and G. Heinrich. 2016. Uncertain natural frequency analysis of composite plates including effect of noise–a polynomial neural network approach. Composite Structures 143:130–42. doi: 10.1016/j.compstruct.2016.02.007.
- Ebrahimi-Mamaghani, A., A. Forooghi, H. Sarparast, A. Alibeigloo, and M. Friswell. 2021. Vibration of viscoelastic axially graded beams with simultaneous axial and spinning motions under an axial load. Applied Mathematical Modelling 90:131–50. doi: 10.1016/j.apm.2020.08.041.
- Emam, S. A. 2009. A static and dynamic analysis of the postbuckling of geometrically imperfect composite beams. Composite Structures 90 (2):247–53. doi: 10.1016/j.compstruct.2009.03.020.
- Emam, S. A., and A. H. Nayfeh. 2009. Postbuckling and free vibrations of composite beams. Composite Structures 88 (4):636–42. doi: 10.1016/j.compstruct.2008.06.006.
- Flores, E. S., S. Adhikari, M. Friswell, and F. Scarpa. 2011. Hyperelastic axial buckling of single wall carbon nanotubes. Physica E: Low-Dimensional Systems and Nanostructures 44 (2):525–9. doi: 10.1016/j.physe.2011.10.006.
- Forooghi, A., and A. Alibeigloo. 2022. Hygro-thermo-magnetically induced vibration of fg-cntrc small-scale plate incorporating nonlocality and strain gradient size dependency. Waves in Random and Complex Media:1–32. doi: 10.1080/17455030.2022.2037784
- Forooghi, A., N. Fallahi, A. Alibeigloo, H. Forooghi, and S. Rezaey. 2022a. Static and thermal instability analysis of embedded functionally graded carbon nanotube-reinforced composite plates based on hsdt via gdqm and validated modeling by neural network. Mechanics Based Design of Structures and Machines:1–34. doi: 10.1080/15397734.2022.2094407.
- Forooghi, A., S. Rezaey, S. M. Haghighi, and A. M. Zenkour. 2022b. Thermal instability analysis of nanoscale fg porous plates embedded on kerr foundation coupled with fluid flow. Engineering with Computers 38 (S4):2953–73. doi: 10.1007/s00366-021-01426-3.
- Giordano, A., L. Mao, and F.-P. Chiang. 2021. Full-field experimental analysis of a sandwich beam under bending and comparison with theories. Composite Structures 255:112965. doi: 10.1016/j.compstruct.2020.112965.
- Guo, H., X. Zhuang and T. Rabczuk. 2019. A deep collocation method for the bending analysis of kirchhoff plate. Computers, Materials & Continua 59 (2):433–56.
- Hamzehei, R., J. Kadkhodapour, A. P. Anaraki, S. Rezaei, S. Dariushi, and A. M. Rezadoust. 2018. Octagonal auxetic metamaterials with hyperelastic properties for large compressive deformation. International Journal of Mechanical Sciences 145:96–105. doi: 10.1016/j.ijmecsci.2018.06.040.
- Hamzehei, R., S. Rezaei, J. Kadkhodapour, A. P. Anaraki, and A. Mahmoudi. 2020. 2d triangular anti-trichiral structures and auxetic stents with symmetric shrinkage behavior and high energy absorption. Mechanics of Materials 142:103291. doi: 10.1016/j.mechmat.2019.103291.
- Hosseini, S. M. H., H. Arvin, and Y. Kiani. 2022. On buckling and post-buckling of rotating clamped-clamped functionally graded beams in thermal environment. Mechanics Based Design of Structures and Machines 50 (8):2779–94. doi: 10.1080/15397734.2020.1784205.
- Huang, J., N. Nguyen-Thanh, J. Gao, Z. Fan, and K. Zhou. 2022. Static, free vibration, and buckling analyses of laminated composite plates via an isogeometric meshfree collocation approach. Composite Structures 285:115011. doi: 10.1016/j.compstruct.2021.115011.
- Khaniki, H. B., M. H. Ghayesh, R. Chin, and M. Amabili. 2021. Large amplitude vibrations of imperfect porous-hyperelastic beams via a modified strain energy. Journal of Sound and Vibration 513:116416. doi: 10.1016/j.jsv.2021.116416.
- Khaniki, H. B., M. H. Ghayesh, R. Chin, and M. Amabili. 2022a. A review on the nonlinear dynamics of hyperelastic structures. Nonlinear Dynamics 110 (2):963–94. doi: 10.1007/s11071-022-07700-3.
- Khaniki, H. B., M. H. Ghayesh, R. Chin, and L.-Q. Chen. 2022b. Experimental characteristics and coupled nonlinear forced vibrations of axially travelling hyperelastic beams. Thin-Walled Structures 170:108526. doi: 10.1016/j.tws.2021.108526.
- Khaniki, H. B., M. H. Ghayesh, R. Chin, and S. Hussain. 2022c. Nonlinear continuum mechanics of thick hyperelastic sandwich beams using various shear deformable beam theories. Continuum Mechanics and Thermodynamics 34 (3):781–827. doi: 10.1007/s00161-022-01090-y.
- Li, W., F. Sun, P. Wang, H. Fan, and D. Fang. 2016. A novel carbon fiber reinforced lattice truss sandwich cylinder: Fabrication and experiments. Composites Part A: Applied Science and Manufacturing 81:313–22. doi: 10.1016/j.compositesa.2015.11.034.
- Liu, Y. 2018. Axial and circumferential buckling of a hyperelastic tube under restricted compression. International Journal of Non-Linear Mechanics 98:145–53. doi: 10.1016/j.ijnonlinmec.2017.10.016.
- Liu, Y., and H.-H. Dai. 2014. Compression of a hyperelastic layer-substrate structure: Transitions between buckling and surface modes. International Journal of Engineering Science 80:74–89. doi: 10.1016/j.ijengsci.2014.02.020.
- Mehta, S., G. Raju, and P. Saxena. 2022b. Wrinkling as a mechanical instability in growing annular hyperelastic plates. International Journal of Mechanical Sciences 229:107481. doi: 10.1016/j.ijmecsci.2022.107481.
- Mukhopadhyay, T., S. Naskar, S. Chakraborty, P. Karsh, R. Choudhury, and S. Dey. 2021a. Stochastic oblique impact on composite laminates: A concise review and characterization of the essence of hybrid machine learning algorithms. Archives of Computational Methods in Engineering 28 (3):1731–60. doi: 10.1007/s11831-020-09438-w.
- Mukhopadhyay, T., S. Naskar, S. Dey, Vaishali. 2023. On machine learning assisted data-driven bridging of FSDT and hozt for high-fidelity uncertainty quantification of laminated composite and sandwich plates. Composite Structures 304: 116276. doi: 10.1016/j.compstruct.2022.116276.
- Mukhopadhyay, T., S. Naskar, K. Gupta, R. Kumar, S. Dey, and S. Adhikari. 2021b. Probing the stochastic dynamics of coronaviruses: Machine learning assisted deep computational insights with exploitable dimensions. Advanced Theory and Simulations 4 (7):2000291. doi: 10.1002/adts.202000291.
- Naskar, S., T. Mukhopadhya, and S. Sriramula. 2020. A comparative assessment of ann and pnn model for low-frequency stochastic free vibration analysis of composite plates. In Handbook of probabilistic models, 527–47. Elsevier.
- Novoselac, S., T. Ergić, and P. Baličević. 2012. Linear and nonlinear buckling and post buckling analysis of a bar with the influence of imperfections. Tehnicki Vjesnik/Technical Gazette 19 (3):695–701.
- Peres, M., and R. Bono. 2011. Modal testing and shaker excitation: Setup considerations and guidelines. SAE Technical Paper 2011-01-1652. doi: 10.4271/2011-01–1652.
- Selvan T, M., S. Sharma, S. Naskar, S. Mondal, M. Kaushal, and T. Mondal. 2022. Printable carbon nanotube-liquid elastomer-based multifunctional adhesive sensors for monitoring physiological parameters. ACS Applied Materials & Interfaces 14 (40):45921–33. doi: 10.1021/acsami.2c13927.
- Sharma, A., T. Mukhopadhyay, S. M. Rangappa, S. Siengchin, and V. Kushvaha. 2022. Advances in computational intelligence of polymer composite materials: Machine learning assisted modeling, analysis and design. Archives of Computational Methods in Engineering 29 (5):3341–85. doi: 10.1007/s11831-021-09700-9.
- Sharma, S., M. Selvan, S. Naskar, S. Mondal, P. Adhya, T. Mukhopadhyay, and T. Mondal. 2022. Printable graphene-sustainable elastomer-based cross talk free sensor for point of care diagnostics. ACS Applied Materials & Interfaces 14 (51):57265–80. doi: 10.1021/acsami.2c17805.
- Shojaeifard, M., K. Wang, and M. Baghani. 2022. Large deformation of hyperelastic thick-walled vessels under combined extension-torsion-pressure: Analytical solution and fem. Mechanics Based Design of Structures and Machines 50 (12):4139–56. doi: 10.1080/15397734.2020.1826963.
- Tabatabaei, S. S., and A. Fattahi. 2022. A finite element method for modal analysis of fgm plates. Mechanics Based Design of Structures and Machines 50 (4):1111–22. doi: 10.1080/15397734.2020.1744004.
- Vahidi Bidhendi, M., G. H. Rahimi, M. S. Gazor, and A. R. Zangoei. 2022. Experimental and numerical investigation of debonding in the composite sandwich structures with a foam-composite core under tpsb test. Journal of the Brazilian Society of Mechanical Sciences and Engineering 44 (12):604. doi: 10.1007/s40430-022-03907-y.
- Wang, S., J. Wang, H. Lu, and W. Zhao. 2021. A novel combined model for wind speed prediction–combination of linear model, shallow neural networks, and deep learning approaches. Energy 234:121275. doi: 10.1016/j.energy.2021.121275.
- Wang, Y., and W. Zhu. 2021a. Nonlinear transverse vibration of a hyperelastic beam under harmonic axial loading in the subcritical buckling regime. Applied Mathematical Modelling 94:597–618. doi: 10.1016/j.apm.2021.01.030.
- Wang, Y., and W. Zhu. 2021b. Nonlinear transverse vibration of a hyperelastic beam under harmonically varying axial loading. Journal of Computational and Nonlinear Dynamics 16 (3):031006. doi: 10.1115/1.4049562.
- Wang, Y., and W. Zhu. 2022. Supercritical nonlinear transverse vibration of a hyperelastic beam under harmonic axial loading. Communications in Nonlinear Science and Numerical Simulation 112:106536. doi: 10.1016/j.cnsns.2022.106536.
- Zangoei, A. R., G. H. Rahimi, M. S. Gazor, M. Vahidibidhendi, and O. Azarniya. 2023. Experimental and numerical study of delamination phenomenon in sandwich structures with hybrid corrugated core in the mode ii of crack growth. Journal of Composite Materials 57 (6):1199–210. doi: 10.1177/00219983221150429.
- Zolfagharian, A., M. Bodaghi, R. Hamzehei, L. Parr, M. Fard, and B. F. Rolfe. 2022. 3D-printed programmable mechanical metamaterials for vibration isolation and buckling control. Sustainability 14 (11):6831. doi: 10.3390/su14116831.