
 ?Mathematical formulae have been encoded as MathML and are displayed in this HTML version using MathJax in order to improve their display. Uncheck the box to turn MathJax off. This feature requires Javascript. Click on a formula to zoom.
ABSTRACT
In this study, a dynamic spillover index method based on generalized variance decomposition is used to measure the volatility and return spillover effects of futures and spot markets on China’s price levels (consumer and producer price indices) at different time-frequencies. The results indicate that both domestic and foreign futures and spot markets exerted time-varying volatility and return spillover effects on China’s price levels and that major global crises aggravate the overall volatility and return spillover effect of the global futures and spot markets. In addition, the spillover effect of domestic and foreign futures and spot markets on China’s price levels is asymmetrical. The results of this study also indicate that the longer the frequency of a cycle is, the stronger the spillover effect of each market on price fluctuations is, and the weaker the return spillover effect is. Finally, the results demonstrate that China can use a combination of monetary easing and credit tightening to control inflation more effectively.
1. Introduction
With the rise of economic globalization, the volatility spillover effects of domestic and foreign bulk commodity futures and spot markets are becoming increasingly prominent. The commodity price boom has resulted in a serious price bubble; the main effect of this bubble on real economic activities has been a spike in inflationary pressure and a corporate profit squeeze. However, emerging market economies (EMEs), which serve as a considerable force in global financial markets, have yet to recover from the pandemic. The commodity market shock has exacerbated the threats to the economic recovery of EMEs, exposing the vulnerability of these economies. With growth prospects deteriorating, inflation soaring, and current account deficits widening, EMEs will likely come under severe strain in the recovery process. Within this context, economic policymakers in countries with EMEs must grapple with the problem of highly volatile commodity prices.
Understanding the sources of commodity price fluctuations is key to developing effective macroeconomic policies. Empirical studies have obtained valuable insights into commodity price fluctuations and their influencing factors. Three major categories of factors resulting in price fluctuations have been identified: market supply and demand factors, real economic factors, and macroeconomic policy factors (Bannigidadmath and Narayan Citation2020; Inamura et al. Citation2011; Phillip and Friederich Citation2013). Moreover, the results of various tests performed in previous studies have supported the robustness of the relationship between commodity spot and futures markets (e.g., Acharya, Lochstoer, and Ramadorai Citation2013; Bannigidadmath and Narayan Citation2022; Narayan, Narayan, and Sharma Citation2013; Narayan and Sharma Citation2018; Westerlund and Narayan Citation2013). Using cross-correlations from a Department of Commerce and Consumer Affairs report, Bannigidadmath and Narayan (Citation2022) demonstrated that futures markets generally contribute to changes in spot market prices. Westerlund and Narayan (Citation2013) proposed a heteroskedasticity-consistent weighted least-squares estimator for predicting commodity spot market prices by using futures market prices.
This paper contributes to the literature on the empirical analysis of the spillover effects of commodity markets on prices. In this study, four indices are used to represent domestic and foreign commodity markets. This study is inspired by previous studies (Bloch and Sapsford Citation2004; De Gregorio Citation2012; Gelos and Ustyugova Citation2012; Gospodinov and Ng Citation2013; Joshi and Acharya Citation2011) that have investigated the importance of commodity prices in policymaking processes, curbing inflation, and forecasting macroeconomic variables. Researchers generally use two key models to study the effect of commodity prices on the price levels of different countries: an empirical model based on the theoretical framework of the new Keynesian Phillips curve (e.g., Hooker Citation2002) and the vector autoregression (VAR) model (or a modified version), which is used to study the relationship between commodity prices and price levels (e.g., Garner Citation1989; Mensi et al. Citation2021; Yalcin, Arikan, and Emirmahmutoglu Citation2015).
China’s investment and trade volume have remained stable despite the global investment downturn. China’s macroeconomic policies are more independent and less susceptible to external disturbances than are those of other EMEs. However, research on China’s commodity market and price levels has remained sparse.
This study takes China as an example to achieve its three main objectives. First, this study investigates whether the spillover effects of domestic and foreign futures and spot markets differ significantly from the perspective of volatility and return. Second, this study analyzes the mechanisms underlying the spillover effects of domestic and foreign commodity markets on Chinese prices. Finally, this study characterizes the effects of the volatility spillover from domestic and foreign commodity markets on China’s prices. The results of this study may serve as a reference for the central bank of China in developing monetary policies according to rising commodity prices and aggravated inflation. They may also be used to develop guidelines for the sustainable economic development of other countries after the COVID-19 pandemic.
The contributions of this paper to the relevant literature are twofold. First, this study examines the frequency dynamics of volatility and return spillover and connectedness among the foreign spot market (represented by the CRB index), foreign futures market (represented by the RJ/CRB index), domestic spot market (represented by the CCPI index), and domestic futures market (represented by the Nanhua Commodity Futures Price Index) over a period encompassing the 2008 financial crisis and the outbreak of the COVID-19 pandemic in 2020. In the study of commodity markets, Yang, Li, and Miao (Citation2021) reported that volatility connectedness across commodities is primarily driven by low-frequency volatility connectedness, which is affected by broad economic conditions. Moreover, studies (Xiao et al. Citation2019; Yang, Li, and Miao Citation2021) have revealed that a high degree of total connectedness and strong spillover effects can be consistently observed during times of turmoil. Therefore, this paper further contributes to the literature on risk management in the current spot commodity market.
Second, by constructing a connectedness network of domestic and foreign futures and spot commodity markets and China’s prices levels, this study elucidates some of the underlying mechanisms of volatility and return spillover. The results of this study may serve as a reference in the development of regulatory policies that can effectively control inflation in the domestic and foreign commodity markets and the negative effects of inflation on prices in China. They may also serve as a reference for investors looking to optimize their investment portfolios.
The remainder of this paper is organized as follows. Section 2 introduces the methodological approach employed in this study, which emphasizes the spillover and connectivity index models. Section 3 presents a description and analysis of the collected data. The conclusions of this study are presented in Section 4.
2. Methodology
2.1. Diebold and Yilmaz Method
In this study, a measurement analysis of the volatility spillover effect and return spillover effect of each commodity market is performed using the spillover index method based on generalized variance decomposition (GVD) proposed by Diebold and Yilmaz (Citation2014). The analysis can be divided into three main steps: the application of a covariance-stationary N-variable VAR(p) model, the decomposition of the generalized variance in the model, and the establishment of the overall volatility spillover and directional spillover indices. The overall spillover index measures the overall volatility and return spillover of domestic and foreign commodity markets, and the directional spillover index can describe the intensity and direction of spillover between markets.
2.2. Connectedness Measurement Method
This study also employs the connectedness measurement model based on variance decomposition proposed by Diebold and Yilmaz (Citation2014), which predicts the shares of forecast error variation in various locations due to shocks arising elsewhere. In this paper, represents the Hth-order variance decomposition component caused by the effect of variable j on the variance decomposition of variable i. All the connectedness measures (including those of directional connectedness and overall connectedness) employed herein are based on the variance decomposition of “non-own” or “cross” variance decompositions, that is,
.
An N-dimensional covariance-stationary data-generating process with orthogonal shocks can be described as follows:
where is an N × 1 column vector representing the volatility or return rate of each commodity market in period t.
According to the GVD method proposed by Pesaran and Shin (Citation1998), the elements in the ith row and jth column of the H-step GVD matrix can be defined as
because the generalized connectedness index is not based on but on
=[
] in the formula
. In the standardized variance decomposition matrix
, the sum of the elements in each row must be equal to 1, that is,
, and the sum of all elements must be N, that is,
. In matrix
, when i ≠ j, the rightmost column is the sum of the corresponding row
, the bottom row is the sum of the corresponding columns, and the bottom right corner is the total average. The matrix is used to measure pairwise directional connectedness which defines the directional connectedness from j to i as
and net directional connectedness as
The row sum of off-diagonal elements represents the overall spillover connectedness from other markets to market i and can be defined as follows:
The column sum of off-diagonal elements represents the overall spillover connectedness from j to others and can be defined as follows:
Similarly, the net volatility spillover connectedness of market i to other commodity market price volatility or return can be defined as
Finally, the total volatility or return connectedness in the matrix can be defined as
Each matrix has only one total volatility or return connectedness measure.
3. Empirical Results
3.1. Sample and Data
To fully reflect the price changes in various bulk commodity markets at home and abroad, this study uses the China bulk commodity price index, Nanhua Commodity Futures Price Index, CRB spot index, and RJ/CRB index to represent the domestic spot market (ZGXH), domestic futures market (ZGQH), foreign spot market (GWXH), and foreign futures market (GWQH), respectively. The research period is from June 2006 to February 2021. All monthly data for the aforementioned indices employed herein is from the Choice Financial database.
presents the descriptive statistics for the overall change rates of the domestic and foreign futures and spot market prices, consumer price index (CPI), and producer price index (PPI). The domestic and foreign futures markets have standard deviations of 4.62 and 5.54, respectively, and the domestic and foreign spot markets have standard deviations of 3.79 and 3.19, respectively. Overall, the price volatility levels in the futures markets are significantly greater than those in the spot markets. Furthermore, according to the skewness and kurtosis values, both the spot and futures markets have nonnormal left-skewed distributions. Therefore, a GJR(1,1)–Gaussian dynamic conditional correlation model is used to model and analyze the marginal distribution herein.
Table 1. Descriptive statistics on commodity market Returns and China’s price returns.
3.2. Full-Sample Spillover
A full-sample analysis of the domestic and foreign bulk commodity markets and their spillover effects on and China’s prices is conducted herein. The analysis adopts the spillover index method based on GVD. The VAR lag order for volatility and return is 1 and 2, respectively, and the number of periods for forecast error variance decomposition is set to 10.
is a spillover table that provides an “input–output” decomposition of the spillover index values. The ijth entry in the table is the estimated spillover from market i to market j. The off-diagonal row and column sums are the spillover from other markets to market i and the spillover to other markets from market j, respectively. The total volatility and return spillover indices are 41.10% and 49.57%, respectively, indicating that the total volatility and return spillover effects are relatively strong. Therefore, futures and spot market volatility (return) is more due to its own previous volatility (return), and volatility in foreign markets also has a significant effect.
Table 2. Volatility (return) spillover table on commodity market and China’s price.
Moreover, the indices of the volatility spillover effects of the domestic futures market on the foreign futures and spot markets are 24.33% and 18.23%, respectively, whereas those of volatility spillover from the domestic spot market to the foreign futures and spot markets are 9.63% and 0.14%, respectively. This indicates that the amount of volatility spillover from the domestic futures market to foreign commodity markets is greater than the amount of volatility spillover from the domestic spot market to foreign commodity markets. The indices of volatility spillover from the foreign futures market to the domestic spot and futures markets are 23.53% and 23.83% respectively, whereas those of volatility spillover from the foreign spot market to domestic spot and futures markets are 2.46% and 16.49% respectively. This indicates that the volatility spillover effects of foreign commodity markets on domestic commodity markets are stronger than those of domestic commodity markets on foreign commodity markets. The same is true of the return spillover effects of such markets.
However, returns and volatility spillovers may differ significantly at any point in time. In other words, their dynamics may differ (Diebold and Yilmaz Citation2009). Therefore, this study further tests this hypothesis through a dynamic rolling sample analysis.
3.3. Overall Spillover
illustrates the changes in overall spillover during the study period. The overall volatility spillover index fluctuated between 30% and 70% throughout the study period, peaking during the 2008 financial crisis and falling to a historic low in 2011. Thereafter, volatility spillover remained low until 2020, at which point it began to trend upward. These trends indicate that the domestic and foreign bulk commodity markets are strongly affected by major global events (such as the financial crisis in 2008 and the start of the COVID-19 pandemic in 2020), which, in turn, strongly affects volatility and return spillover. The trends in overall return spillover are similar to those in overall volatility spillover, but the fluctuations in return spillover are greater than those in volatility spillover.
Figure 1. Overall spillover on commodity market volatility (return) and China’s price volatility (return).
3.4. Connectedness Network
illustrates part of the connectedness network of commodity markets and prices in China during the study period. In ), a higher connectedness index indicates a stronger volatility spillover effect, and the domestic futures market has the strongest external connectedness, with connections to PPI ( 69.02%), domestic spot market (
47.71%), and foreign spot market (
56.26%). By contrast, the foreign futures market is connected only to CPI (
63.04%). This indicates that volatility in the domestic futures market strongly affects China’s PPI, whereas volatility in the foreign futures market strongly affects China’s CPI.
Figure 2. Directional connectedness network on commodity market and China’s price.
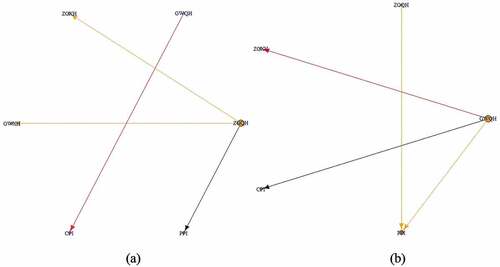
In ), a higher connectedness index indicates a stronger return spillover effect, and the foreign futures market has the strongest external connectedness, with connections to CPI ( 52.46%), PPI (
44.49%), and domestic spot market (
48.06%). By contrast, the domestic futures market is connected only to PPI (
40.57%). This indicates that China’s PPI is affected by return spillover from the domestic and foreign futures markets, whereas China’s CPI is mainly affected by return spillover from the foreign futures market.
3.5. Static/Dynamic Volatility and Return Spillover Effects
As indicated in , volatility spillover among the domestic and foreign futures and spot markets affects China’s PPI more strongly than it affects China’s CPI. The volatility spillover effects of various markets on CPI are relatively similar and weak. The static return spillover data reveal that the price changes in the domestic futures market and the foreign futures and spot markets strongly affect China’s price levels. Because of the mutual influence between CPI and PPI, changes in PPI drives changes in CPI to a certain extent. Moreover, further analysis revealed that the spillover effect on PPI was stronger. Overall, both volatility and return spillover between the domestic futures market and the foreign futures and spot markets significantly affect price levels in China.
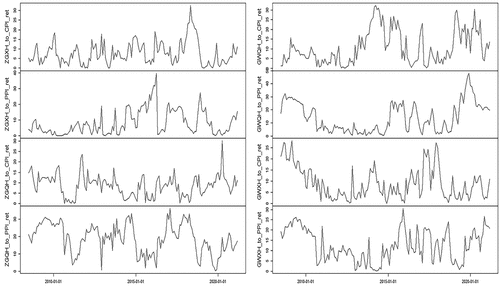
illustrate the trends in the dynamic volatility and return spillover effects of the domestic and foreign futures and spot markets on China’s CPI and PPI. The dynamic spillover effects varied over time. Generally, the trends in each dynamic volatility spillover effect differ. However, regarding dynamic return spillover effects, at the beginning of 2020, the return spillover effects of the domestic spot market on CPI and PPI started rapidly increasing and were relatively synchronous.
Figure 3. Dynamic volatility spillover on commodity market and China’s price.
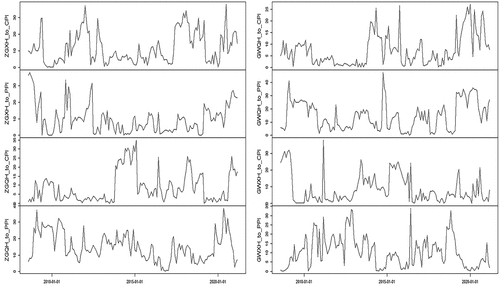
Figure 4. Dynamic return spillover on commodity market and China’s price.
3.6. Spillover Effects at Different Time Frequencies
To thoroughly analyze the aforementioned trends in spillover effects, the short-term, intermediate-term, and long-term spillover effects of the domestic and foreign futures and spot markets on China’s prices at different time frequencies are analyzed herein. With reference to the framework proposed by Baruník and Krehlik (Citation2018), [π/2, π] is set as the high-frequency band, which represents short-term spillover (over a period of 1 to 2 months); [π/6, π/2] is set as the mid-frequency band, which represents intermediate-term spillover (over a period of 2 to 6 months); and [0, π/6] is set as the low-frequency band, which represents long-term spillover (over a period of over 6 months). H is set to 100 days. The results are presented in .
Table 3. Different time-frequency spillover table of commodity market and China’s price.
The volatility spillover effects of the domestic and foreign futures and spot markets on CPI and PPI are relatively weak in the short term and intermediate term but relatively strong in the long term. Regarding return spillover, the short-term return spillover effect of the foreign futures market on PPI and the intermediate-term return spillover effect of the domestic spot market on CPI are relatively strong (3.95% and 2.93%, respectively). The foreign futures and domestic spot markets exert relatively strong return spillover effects on China’s PPI, whereas the foreign spot and domestic futures markets do not. The strength of return spillover effect of each market on CPI and PPI decreases further in the long term. Overall, the longer the cycle frequency is, the stronger the volatility spillover effects and the weaker the return spillover effects of commodity markets on prices are.
3.7. Influencing Factors
Drawing on the results obtained thus far, the effects of the global commodity supply and demand situation, domestic monetary policy, corporate prosperity index, domestic and foreign futures and spot market volatility, and other factors on the overall volatility and return spillover effects and China’s prices from July 2008 to February 2021 are analyzed herein. provides the definitions of the main variables used in this analysis.
Table 4. Main variables description.
As indicated in , the domestic spot market significantly enhances the overall volatility and return spillover effects. Each 1% increase in domestic spot market volatility increases the overall volatility spillover index by 2.59% (2.88%). The domestic futures market enhances the overall return spillover effect but has no obvious effect on the overall volatility spillover effect. Similarly, the foreign spot market significantly enhances the overall volatility spillover effect but has no obvious effect on the overall return spillover effect. The foreign futures market inhibits the overall return spillover effect but has no significant effect on the overall volatility spillover effect. Imbalance between global supply of and demand for commodities suppresses the overall volatility spillover effect but enhances the overall return spillover effect. The recovery of the business climate in China will likely enhance the overall volatility spillover effect of the global commodity market but suppress the overall return spillover effect. From the perspective of monetary policy, both the expansion of monetary policy and the growth of 1-year real interest rates on bank loans enhance the overall return spillover effect. The outbreak of COVID-19 in 2020 enhanced the volatility and return spillover effect of the global commodity market.
Table 5. Influencing factors analysis of overall volatility (return) spillover and China’s price.
As indicated in , domestic futures and spot market volatility exerts a significant inhibitory effect on China’s CPI, whereas foreign futures and spot market volatility drastically increases China’s CPI. In terms of monetary policy, M2 has no obvious effect on China’s CPI growth rate, but LL exerts a significant inhibitory effect on the CPI growth rate. Accordingly, a price-based monetary policy may be more effective than a quantitative monetary policy in controlling inflation.
PPI is strongly affected by domestic and foreign futures markets, and the effect of foreign futures markets is far greater than that of domestic futures markets. In terms of monetary policy, M2 and LL significantly inhibit the rise of China’s PPI. This suggests that a mixed monetary policy may be more effective than a single monetary policy in controlling PPI inflation. For example, a mixed monetary policy combining monetary easing and credit tightening may effectively control PPI inflation in China.
4. Concluding Remarks
This study investigates the time-varying volatility and return spillover effects of domestic and foreign futures and spot markets on price levels in China through an analysis of commodity market price index and China’s price index values from June 2006 to February 2021. The mechanisms underlying the spillover effects of various commodity markets on China’s price levels are also explored herein through the construction of a connectedness network. The conclusions of this study are as follows. First, the spillover effect of foreign commodity markets on domestic commodity markets is usually stronger than that of domestic commodity markets on foreign markets, and the volatility and return spillover effects of the domestic futures market on the foreign commodity market are stronger than those of the domestic spot market. According to the analysis of the trends in overall spillover during the study period, major global events enhance the volatility and return spillover effects in commodity markets. Second, the connectedness network of return and volatility in commodity markets differ significantly, and the centers of the two networks differ. Finally, imbalance in the global supply of and demand for commodities restricts the rise of China’s CPI but aggravate PPI inflation. Moreover, the outbreak of COVID-19 restricted the growth of China’s CPI and PPI.
The main implications of these findings are twofold. First, identifying the direction and extent of the effect of commodity market shocks on price levels at different time frequencies can help the government effectively respond to such shocks and can boost the stability of financial markets. The results of this study indicate that a mixed monetary policy combining monetary easing and credit tightening may be particularly effective in controlling inflation. In the future, efforts to control inflation in China should focus on preventing sharp increases in PPI and the transmission to CPI. Second, investors in vulnerable EMEs may benefit use the findings of this study as a reference for developing effective investment strategies, given that responses to the risk spillovers vary over time.
Disclosure statement
No potential conflict of interest was reported by the author(s).
Additional information
Funding
References
- Acharya, V. V., L. A. Lochstoer, and T. Ramadorai. 2013. Limits to arbitrage and hedging: Evidence from commodity markets. Journal of Financial Economics 109 (2):441–65. doi:10.1016/j.jfineco.2013.03.003.
- Bannigidadmath, D., and P. K. Narayan. 2020. Commodity futures returns and policy uncertainty. International Review of Economics and Finance 72:364–83. doi:10.1016/j.iref.2020.11.009.
- Bannigidadmath, D., and P. K. Narayan. 2022. Economic importance of correlations for energy and other commodities. Energy Economics 107:105854. doi:10.1016/j.eneco.2022.105854.
- Baruník, J., and T. Krehlik. 2018. Measuring the frequency dynamics of financial connectedness and systemic risk. Journal of Financial Econometrics 16 (2):271–96. doi:10.2139/SSRN.2627599.
- Bloch, H., and D. Sapsford. 2004. Commodity prices, wages, and U.S. inflation in the twentieth century. Journal of Post Keynesian Economics 26 (3):523–45. doi:10.1080/01603477.2004.11051404.
- De Gregorio, J. 2012. Commodity prices, monetary policy, and inflation. IMF Economic Review 60 (4):600–33. doi:10.1057/imfer.2012.15.
- Diebold, F. X., and K. Yilmaz. 2009. Measuring financial asset return and volatility spillovers, with application to global equity markets. Economic Journal 119 (534):158–71. doi:10.1111/j.1468-0297.2008.02208.x.
- Diebold, F. X., and K. Yilmaz. 2014. On the network topology of variance decompositions: Measuring the connectedness of financial firms. Journal of Econometric 182 (1):119–34. doi:10.1016/j.jeconom.2014.04.012.
- Garner, C. A. 1989. Commodity prices: Policy target or information variable? Journal of Money, Credit & Banking 21 (4):508–14. doi:10.2307/1992357.
- Gelos, G., and Y. Ustyugova. 2012. Inflation responses to commodity price Shocks - how and why do countries differ? Journal of International Money and Finance 72. doi:10.1016/j.jimonfin.2016.10.001.
- Gospodinov, N., and S. Ng. 2013. Commodity prices, convenience yields and inflation. Review of Economics & Statistics 95 (1):206–19. doi:10.2307/23355660.
- Hooker, M. A. 2002. Are oil shocks inflationary? asymmetric and nonlinear specifications versus changes in regime. Journal of Money, Credit, and Banking 34 (2):540–61. doi:10.2139/ssrn.208890.
- Inamura, Y., T. Kimata, T. Kimura, and T. Muto. 2011. Recent surge in global commodity prices– impact of financialization of commodities and globally accommodative monetary conditions. No. 11-E-2, Bank of Japan. Accessed September 20, 2021. http://www.boj.or.jp/en/research/wps_rev/rev_2011/data/rev11e02.pdf
- Joshi, A. R., and D. Acharya. 2011. Commodity prices and domestic inflation in India. Global Journal of Emerging Market Economies 3 (2):223–46. doi:10.1177/097491011100300204.
- Mensi, W., S. Hammoudeh, X. V. Vo, and S. H. Kang. 2021. Volatility spillovers between oil and equity markets and portfolio risk implications in the US and vulnerable EU countries. Journal of International Financial Markets, Institutions and Money 75:101457. doi:10.1016/j.intfin.2021.101457.
- Narayan, P. K., S. Narayan, and S. S. Sharma. 2013. An analysis of commodity markets: What gain for investors? Journal of Banking & Finance 37 (10):3878–89. doi:10.1016/j.jbankfin.2013.07.009.
- Narayan, P. K., and S. S. Sharma. 2018. An analysis of time-varying commodity market price discovery. International Review of Financial Analysis 57 (MAY):122–33. doi:10.1016/j.irfa.2018.03.008.
- Pesaran, H. H., and Y. Shin. 1998. Generalized impulse response analysis in linear multivariate models. Economics Letters 58 (1):17–29. doi:10.1016/S0165-1765(97)00214-0.
- Phillip, R. C., and U. J. Friederich. 2013. Monetary policy shocks and real commodity prices. The B.E. Journal of Macroeconomics 13 (1):715–49. doi:10.1515/bejm-2012-0083.
- Westerlund, J., and P. K. Narayan. 2013. Testing the efficient market hypothesis in conditionally heteroskedastic futures markets. Journal of Futures Markets 33 (11):1024–45. doi:10.1002/fut.21624.
- Xiao, B. Q., H. H. Yu, L. B. Fang, and S. F. Ding. 2019. Estimating the connectedness of commodity Futures using a network approach. Journal of Futures Markets 40 (4):598–616. doi:10.1002/fut.22086.
- Yalcin, Y., C. Arikan, and F. Emirmahmutoglu. 2015. Determining the asymmetric effects of oil price changes on macroeconomic variables: A case of Turkey. Empirical Economics 42 (2):737–46. doi:10.1007/s10663-014-9274-y.
- Yang, J., Z. Li, and H. Miao. 2021. Volatility spillovers in commodity futures markets: A network approach. Journal of Futures Markets 41 (12):1959–87. doi:10.1002/fut.22270.