
 ?Mathematical formulae have been encoded as MathML and are displayed in this HTML version using MathJax in order to improve their display. Uncheck the box to turn MathJax off. This feature requires Javascript. Click on a formula to zoom.
ABSTRACT
We study the impact of COVID-19 on the pairwise dependence between three indices, the COVID-19 Media Coverage Index, MSCI World Semiconductor Index, and the MSCI World Energy Index, as well as investigate the respective volatility spillovers. We find intervals of weak, moderate, and strong coherence between the Media Coverage Index and returns and volatility of semiconductor and energy sector companies. Low coherence intervals indicate a diversification potential of investments in these sectors and in their volatility-based products during periods of systemic crises such as the financial turmoil induced by COVID-19. Our results provide evidence that after the escalation of the pandemic in early 2020, the energy sector cedes its leading role in terms of volatility to the semiconductor industry. We report on appealing hedging attributes related to the decoupling between the trends in the global semiconductor industry and the global energy sector accelerated by the COVID-19 triggered crisis.
1. Introduction
The COVID-19 pandemic has caused the deepest recession on a global scale since the Great Depression of the thirties, severely affecting financial markets worldwide (Cepoi Citation2020; Goodell Citation2020; Gubareva Citation2021; Narayan Citation2021; Padhan and Prabheesh Citation2021). This has attracted attention of academia and market players to the overall impact of the pandemic on global financial markets and renewed interest in the capability of various sectors of the financial market to serve as a potential hedge during such systemic crisis. This has resulted in a large body of literature on equities, commodities, currencies, and fixed income securities that documents differences in the performance of these financial assets during the pandemic. However, certain important COVID-19 driven intersectoral shifts are yet to be explored. One such intersectoral shift is a switch of economic power between two key industries representing the semiconductor sector and the energy sector.
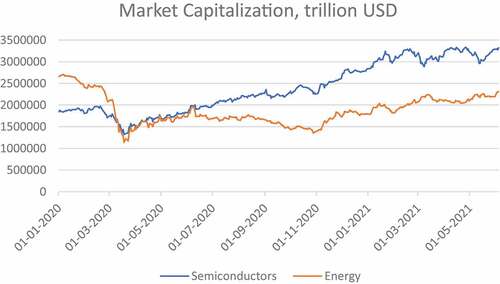
Our interest in these two sectors stems from the argument that COVID-19 was a catalyst for accelerating economic changes in status quo on a global scale. shows an example of such a shift for the case of the semiconductor and energy sectors (represented by the MSCI AC World Semiconductor and Energy indices, respectively) with the market capitalization dynamics of the former sector surpassing that of the latter one.
We intend to study the underlying dynamics of this shift with a focus on the role of the COVID-19 pandemic. We argue that COVID-19 has accelerated a process of structural decline experienced by the fossil fuel industry. In particular, the oil price, the main measure of the energy sector performance, plummeted in March 2020 leading to amplifying investors´ concern that the pandemic could lead to one of the worst oil market shocks in history due to decaying demand. On the contrary, an upward trend in the semiconductor sector has been further accelerated due to remote working practices and mobility restrictions during the pandemic. Another related factor is a shortage of chips for the automotive industry. The global deficit of semiconductor components, experienced by carmakers worldwide in the first quarter of 2021, halted assembly lines around the world. Thus, we see a direct and indirect influence of COVID-19 on the semiconductor and the energy sector as well as the interrelation of these two sectors (Huang and Zheng Citation2020).
Our contribution to the broad financial economics literature is as follows. We contribute to a long strand of literature on spillover, contagion, and co-movement across asset classes by assessing the relationship between the semiconductor and energy sector (Gubareva and Umar Citation2020; Gubareva et al. Citation2022; Jawadi et al. Citation2016; Jawadi, Jawadi, and Cheffou Citation2020; Kenourgios, Umar, and Lemonidi Citation2020; Riaz, Shehzad, and Umar Citation2019; Riaz et al., Citation2021; Stereńczak, Zaremba, and Umar Citation2020; Umar and Gubareva Citation2020, Citation2021; Umar and Suleman Citation2017; Umar et al. Citation2019; Umar, Gubareva, and Teplova Citation2021a; Citation2021b; Citation2021c; Zaremba et al. Citation2021). Given the strategic importance of these two sectors for the global economy, such an analysis will undoubtedly prove useful for various market segments. Although the energy sector has been widely explored, its comovement dynamics with the semiconductor industry has not. Thus, we extend the existing literature by documenting the comovement dynamics of these two paramount sectors. Second, we enrich the literature on the impact of sentiments on the market dynamics. We incorporate the effect of the recent COVID-19 pandemic, which in itself is a unique episode of financial turmoil. Specifically, this study adds to the ongoing research on structural inter- and intra-sectoral industry changes caused or accelerated by the pandemic. Thus, we investigate the decoupling hypothesis ohese two sectors.
We analyze the interdependency between the COVID-19 media coverage and returns and volatilities of the MSCI World Energy and the MSCI World Semiconductor indices by computing the wavelet-based coherence and phase difference measures. We use the Ravenpack COVID-19 Media Coverage Index (MCI) as a proxy for the market sentiment and quantify its relationship with the price and volatility of the Energy and Semiconductor indices. The wavelet approach allows us to gain insights into the joint behavior of the Semiconductor, Energy, and the MCI indices in time and frequency domain. Moreover, we use the wavelet phase difference technique to gain further insight into the lead-lag roles and the causality aspects. Our findings support the decoupling hypothesis of the energy and semi-conductor sector and the role of COVID-19 in accelerating this phenomenon.
Figure 1. Market capitalization of the semiconductor and energy sectors, Jan 2020 - Jun 2021.
The reminder of the article is structured as follows. Section 2 presents the data along with a description of the methodology. Section 3 discusses the empirical results. Section 4 concludes the article.
2. Methodology and Data
We adopt the squared wavelet coherence (SWC) and the wavelet coherence phase difference (WCPD) techniques from Torrance and Compo (Citation1998) and Torrence and Webster (Citation1999). To study the multiscale interdependency between the MCI and the MSCI World Semiconductor and Energy indices we employ the continuous wavelet transformation to obtain SWC similar to Vacha and Barunik (Citation2012) and Zaremba et al. (Citation2019). One advantage of the wavelet approach is that a non-parametric analysis can be applied within it. Nonetheless, below we try to more explain our choice, referring to the original works on this subject.
We use Morlet wavelet. The Morlet wavelet dates back to the early 1980s, when the continuous wavelet transform was developed as such; see Morlet et al. (Citation1982a, Citation1982b) and Goupillaud, Grossman, and Morlet (Citation1984). It builds on a Gaussian-windowed sinusoid, the Gabor transform which was introduced by Gabor (Citation1946) to decompose a signal into its frequency and phase content as time evolves. Unlike the Gabor transform, the Morlet wavelet retains its shape through frequency shifts, thus providing a “reasonable” separation of contributions from different frequency bands “without excessive loss” in the time resolution (Goupillaud, Grossman, and Morlet Citation1984) and the feasibility of series reconstruction. Hence, in line with the available literature, we employ the continuous transformation.
The cross wavelet transform (CWT) of two time series x(t) and y(t), can be expressed in terms of their individual CWTs, and
, as:
where u denotes position and s is the scale factor. The SWC that captures the co-movement is given by:
Since the SWC only assumes positive values and as such does not account for lead–lag relationship, we use the WCPD measure of Torrence and Compo (Citation1998) given by:
The WCPD measure is used in many studies in finance to get insight into the lead–lag relationship among financial and economic timer series (Goodell and Goutte Citation2020; Zaremba et al., Citation2019; and Gubareva and Umar Citation2020; among others).
We obtain COVID-19 media coverage data with daily frequency from Ravenpack. The Ravenpack MCI is a proxy for the COVID-19 media coverage and shows the proportion of the sources of the Coronavirus-related news to all news providers. Hence, it serves as a barometer for the impact of the pandemic on general public sentiment as well as on the level of investors’ awareness of coronavirus. The MCI ranges between 0% and 100% with 0% indicating the lowest and 100% indicating the highest value of the media coverage.
At this point, it is important to note that the use of the COVID-19 media coverage as a sentiment measure is a result of our assumption. Other metrics and proxies, such as conventional google trends and/or the number of COVID-19 cases may be employed. However, in line with several studies that work with the MCI, - see, for instance, (Cepoi Citation2020; Gubareva and Umar Citation2020); Umar and Gubareva (Citation2021); and the references therein, - we choose the COVID-19 media coverage as a sentiment measure, although clearly recognizing that the use of different assumptions and datasets could result in slightly different quantitative outcomes which could be used for the purpose of robustness checks in future research.
Apart from the MCI, our dataset includes the MSCI World Energy and MSCI World Semiconductor indices. The return and volatility data for the MSCI World Energy and MSCI World Semiconductor indices are obtained from Bloomberg. The time period under our analysis encompasses 18 months of the ongoing pandemic outbreak: from January 2020 to June 2021. shows the descriptive statistics of all the series from January to June 2021.
Table 1. Descriptive statistics for the MCI and the MSCI Semiconductor and Energy indices.
According to , the average value of MCI is 67.71 implying that on average approximately 68% of the news coverage is related to the COVID-19 underscoring the significance of pandemic media coverage. All the series are non-normal as evidenced by Jarque-Bera statistics.
In order to obtain further insights into the interdependences of the analyzed variables we construct their correlation matrix.
From , one may notice two important features. First, the value of the correlation coefficient between the MCI and the MSCI World Energy index indicates a strong negative correlation between the movements of these two indices. It is plausible as an increase in the pandemic media coverage augments risks of contingency measures, including tightening mobility restrictions that potentially reduces the demand for oil and, hence, negatively affects the value of oil industry stocks. Second, for both the world energy and the world semiconductor industry, stock returns are negatively correlated with stock volatility: −0.54 and −0.43, respectively. Seemingly, it also makes sense, especially during crisis periods, when collapses in stock prices cause market nervousness and, therefore, volatility increases, and vice versa, the recovery of stocks appeases markets which, consequently, become less volatile.
Table 2. Correlation Matrix.
3. Empirical Analysis
In this section, we present our empirical results for each pair of time series.
3.1. Wavelet Analysis of the MCI and the MSCI World Semiconductor Index
We start our empirical analysis by discussing the results for wavelet coherence and phase-difference between the MCI sentiment index and the MSCI World Semiconductor index (Semi) as shown in . The keys to reading the graph are shown in the legend of each heatmap. Time is displayed on the horizontal axis and frequency is shown on the vertical axis. The warmer the color (yellow to red) in the graphs, the higher the coherence or interdependence, whereas the cooler the colors (blue to green) the lower the coherence level.
Figure 2. Wavelet analysis: the MCI versus the MSCI World Semiconductor index (Semi).
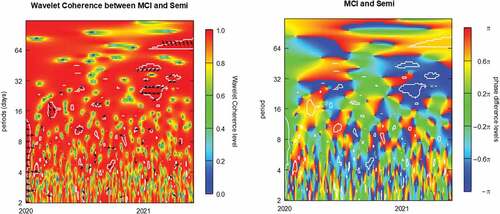
illustrates the results of wavelet analysis for the MCI-Semi pair. We notice that coherence is time varying, ranging from moderate to high values along the entire timescale. Along the frequency scale, we notice a greater level of coherence across all frequencies but for higher frequencies it distinctively shifts from high to moderate and low, with the lowest coherence observed for 3-day intervals. The preponderance of red colored areas shows that the MSCI World Semiconductors index price is highly correlated with the COVID-19 media coverage leaving less room for diversification based on this index. However, the intervals of green region imply that the global semiconductor industry exhibits some diversification attributes despite the COVID-19 panic.
We also identify causality and phase differences between the MCI and the MSCI World Semiconductor index. The arrows on the coherence graphs show phase-differences. We interpret arrows heading to the right (left) as an indication of in-phase (anti-phase) behavior, equivalent to the perfect positive (negative) correlation. An arrow pointing upward shows that the first series is leading the second series by π/2. Moreover, a upward (downward) directed arrow shows that the first (second) series leads the second (first) series by π/2. We use these rules for inferring our results.
Close to the left hand border of the SWC diagram, in January 2020, we see a cloud of right pointing arrowheads (→), signifying an in-phase relationship in the 2-days-to-2-week frequency band and indicating a positive correlation between the MCI and the MSCI World Semiconductor index. We relate this period to the early phase of the pandemic when COVID-19 just started to spread globally. In addition, on the left-hand heatmap of , we observe in March a cloud of arrows ↖, signifying an out-of-phase relationship in the 2-to-3-week frequency band. This cloud indicates a rather negative correlation between the MCI and the MSCI World Semiconductor index, characterized by the MSCI World Semiconductor index lagging behind changes in the MCI index. We ascribe this phenomenon to the extreme pandemic meltdown occurred in late March, when the media coverage of the COVID-19 pandemic played the role of the main driver of stock price movements, with the MCI increase negatively influencing investors´ perceptions around the globe. In addition, in 2021, we observe four clouds of left-directed arrowheads pointing either toward the top (↖) or toward the bottom (↙), which indicate an anti-phase behavior with the lead by the MCI, in the former case, or with the lead by the MSCI World Semiconductor index, as in the latter, a clearly predominant situation.
To get a better understanding of the interdependency relationship, we refer to the right-hand heatmap of which illustrates the lead–lag relationship between the MCI and the MSCI World Semiconductor index. We notice four important features here. First, in the first half of 2020, for the 3-to-4-week frequency band, we see the predominance of the blue color indicating that the MSCI World Semiconductor index leads the MCI. Second, since July onwards, the overall tonality is clearly cooler that during the first half of 2020, as hot red and yellow colors are dominated by cold sky-blue, deep-blue, and green tonalities. An overall lead of the MSCI AC World Semiconductors over the MCI is observed. This is consistent with the impressive recovery of the global semiconductor industry from the COVID-19 lows in late March; see . Third, in 2021, for a large 2-to-8-week frequency band we see another instance of the predominance of the blue color which indicates the leading role of the world semiconductor industry during the second pandemic year characterized by a partial return to relatively normal economic conditions around the world. Fourth, for the 2-days-to-2-week frequency band, we clearly observe well-defined boundaries between deep blue and red, which are indicative of a lead-lag regime-switching behavior. This finding could be of use for investors assessing the attractiveness of investments in the global semiconductor industry as possessing some very attractive hedging attributes, which seemingly work through periods of crisis, being distinctively manifested during the recovery from the COVID-19 economic meltdown.
3.2. Wavelet Analysis: The MCI and the MSCI World Semiconductor Index Volatility
Next, we discuss the interdependence between the COVID-19 media coverage and the price volatility of the global semiconductor industry. The respective wavelet coherence and phase-difference results are presented in .
Figure 3. Wavelet analysis: the MCI vs. the MSCI World Semiconductor index volatility (S_vol).
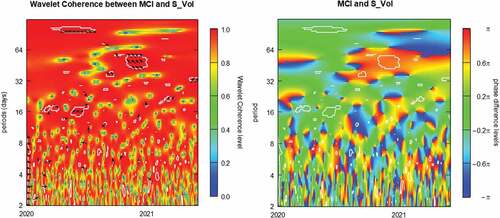
The overall coherence pattern on the left heatmap of is similar to the respective panel of and so are the respective findings regarding the interdependence of the MCI and the MSCI World Semiconductor index. However, differently from the previous case, we observe, in June 2020, a cloud of arrows heading right and upward (↗) in the 2-to-3-week frequency band. This cloud indicates a partial positive correlation between the MCI and the MSCI World Semiconductor index volatility characterized by changes in the MCI leading changes in stock price volatility of the global semiconductor manufacturers. We ascribe this phenomenon to an extreme uncertainty regarding the global economy perspectives adversely affected by the COVID-19 triggered crisis. For instance, until the end of June investors had more worried about conditions of the economy as a whole. Hence, across the semiconductor and energy sectors of the world economy, the recovery trends do not vary much, as evidenced in . However, since July 2020 onwards, we observe sector-specific patterns, resulting in decoupling between the recovery dynamics of the semiconductor and energy sectors. It is worth noticing that in certain time-frequency zones, the lead of the MCI over the MSCI World Semiconductor index appears most pronounced, as indicated, for instance, by a cloud of arrows heading left and upward (↖) in the upper part of the SWC panel by the end of the year 2020.
In its turn, on the phase-difference graph, for the 3-to-5-week frequency band, we observe a vast green belt spreading throughout the entire considered period which indicates mostly synchronized behavior of media coverage intensity and stock volatility of the semiconductor manufacturers. It is also worth noting that the vast mostly red-colored region in the middle of the phase-difference panel indicates that for low, 1-to-2-month frequencies since August 2020 until June 2021, the MCI plays a lead role for the MSCI World Semiconductor index volatility. This is an interesting result, revealing differences between the responses of stock price and stock price volatility of the semiconductor companies to changes in the COVID-19 media coverage, which could be of interest for investors, who consider volatility-based products for hedging their portfolio exposures.
3.3. Wavelet Analysis of the MCI and the MSCI World Energy Index
We continue our analysis by discussing the results for wavelet coherence and phase-difference between the MCI sentiment index and the MSCI World Energy index (Energy) as shown in .
Figure 4. Wavelet analysis: the MCI versus the MSCI World Energy index (Energy).
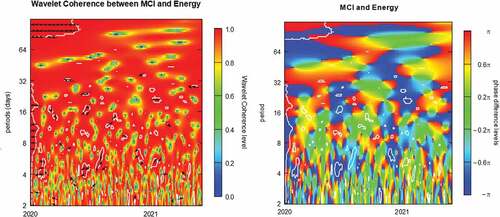
The overall coherence pattern on the left heatmap of is similar to the respective panel of and so are the respective findings regarding the varying levels of coherence between the MCI and the MSCI World Energy index. However, differently from the previous case, the left-hand heatmap of exhibits a cloud of left-pointing arrows (←) in January 2020. This cloud is indicative of an anti-phase relationship in the below-1-month frequency band and implies a negative correlation between the MCI and the MSCI World Energy index. We relate this phenomenon to the early phase of the pandemic, when COVID-19 started to spread globally negatively affecting the demand for energy resources. Unlike the MCI-Semi pair (see ) that exhibit a positive correlation at the beginning of the pandemic, for the MCI-Energy pair, visualizes that stock prices of the global energy companies move in an opposite mode vis-à-vis the COVID-19 media coverage index.
The difference in behavior of the MSCI World Energy and MSCI World Semiconductor indices can also be seen in : during the first 2 months of 2020, the former exhibits an overall downward trend while the latter experiences an overall increase despite the accelerated spread of the coronavirus across the globe.
The right-hand heatmap of provides further detail on the dependency structure and lead-lag patterns for the MCI and the MSCI World Energy index. We notice three important features here. First, in the first half of 2020, for 1-to-1.5-month investment horizons, we distinguish the red colored area that clearly indicates that the price movements of the MSCI World Energy index lag behind the moves of the MCI. It means that the global energy industry perspectives are incorporating with a certain lag the newly emerging changes in the COVID-19 media coverage, seemingly affecting the overall sentiment of energy sector investors. Second, green regions indicating a synchronized behavior of the two indices are rather limited. Still on the heatmap we observe a few green regions. For instance, we see two relevant green zones in April–May 2020 and in August–September 2020. Also, for the 2-months-plus frequency band, we observe a pronounced green region corresponding to the period from the last quarter of 2020 until the first quarter of 2021. The rest of the phase-difference panel is dominated by other colors, either red or blue, both implying a rather unsynchronized behavior for all the considered diapasons of the investment horizons. This may appear somewhat attractive in a sense of a potential usefulness for designing hedge strategies, resilient to the mainstream market sentiments. Third, similarly to the MCI-Semi case, well-defined boundaries between the deep blue and red zones are indicative of the lead-lag regime-switching behavior. This time, however, we clearly observe such patterns through the entire time-frequency space.
This finding could be of use for investors assessing the attractiveness of investments in the global energy industry as possessing some very attractive hedging attributes, which seemingly work through the periods of crisis.
3.4. Wavelet Analysis: The MCI and the MSCI World Energy Index Volatility
We extend our analysis by reporting the results for interdependence between the COVID-19 media coverage and the price volatility of the global energy industry. The respective wavelet coherence and phase-difference are presented in .
Figure 5. Wavelet analysis: the MCI vs. the MSCI World Energy index volatility (E_vol).
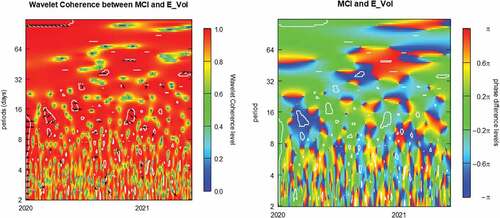
The overall patterns of both the SWC and WCPD heatmaps of are quite similar to the respective panels of for the MCI-S_Vol pair. So are the respective findings regarding the varying levels of coherence between the MCI level and the price volatility of the MSCI World Energy index, as well as the conclusions regarding the alternating patterns in the media coverage and energy stock volatility lead-lag relationship. However, interestingly enough, the lead of the E_Vol over the MCI in February–May 2020, implied by the blue region in the middle of the right-hand panel of for the 1-to-3-week frequency band, corresponds to the green zone of the synchronized behavior of the pair MCI-S_Vol, see the WCPD heatmap of . And vice-versa, the lead of the S_Vol over the MCI in August–November 2020, implied by the blue region in the middle of the right-hand panel of for the 1-to-3-week frequency band, corresponds to the green zone of the synchronized behavior of the pair MCI-E_Vol, see the WCPD heatmap of . Thus, we effectively observe that during the escalation of the pandemic crisis, developments in energy stock volatility anticipate those in the MCI and S_Vol, while semiconductor stock volatility plays the role of a leader over the MCI and E_Vol during the advanced phase of the recovery from the COVID-19 crisis. This result is of a potential interest for designing volatility-based hedge-strategies capable to perform through periods of global crises.
Further insights into hedging attributes for our sectoral set-up are to be found by examining the results of the wavelet analysis of interdependence between the MSCI World Semiconductor and World Energy indices.
3.5. Wavelet Analysis: The MSCI World Semiconductor and World Energy Indices
We continue our analysis by examining the results for wavelet coherence and phase-difference between the MSCI World Semiconductor (Semi) and the MSCI World Energy (Energy) indices, as shown in .
Figure 6. Wavelet analysis: the MSCI World Semiconductor (Semi) vs. World Energy (Energy) indices.
The left-hand panel of demonstrates a varying level of wavelet coherence for different regions of the time-frequency space. Overall, we observe a high coherence represented by the predominantly red color which, however, diminishes toward the bottom of the panel reaching its lowest level over a 3-day frequency. During the first half of 2020, we observe several clouds of arrows, always pointing to the right, which imply an in-phase relationship between the two time series, certifying a positive, either total (→) or partial (↗, ↘), correlation between the indices. This is in perfect correspondence with the WCPD heat map, where the locations of the respective clouds delimited by white lines are green-colored, signifying the synchronized behavior between stock price movements of semiconductor and energy sector companies. This is also clearly observable for March–June in . We ascribe this behavior to the panic-leads-markets meltdown followed by the recovery-leads-markets phase, not producing meaningful discrimination between different sectors, as, for instance, between the semiconductor and energy industries. However, sector-specific mechanisms start to play a more significant role in the more advanced phase of the recovery in the second half of 2020. On the WCPD heatmap of , we observe increasingly pronounced hot, red, and yellow colors which imply a lead role of the semiconductor stock prices over stock prices of the global energy industry, especially for investment horizons in the vicinity of a two-month frequency. In our view, it makes perfect sense, as after the cultural changes brought about by the COVID-19 mobility restrictions and work-from-home policies, people around the globe usually need, first, to connect (connectivity depends on semiconductor components) to be able, then, to run their businesses, i.e., to consume energy. We believe that this insight sourced from the wavelet analysis will be extremely helpful for investors for reassessing their investment and hedging strategies in light of an evidenced switch of dominance in the global market power between the semiconductor and energy sectors of the world economy.
Now we turn to addressing volatility spillover between these two industries.
3.6. Wavelet Analysis: World Semiconductor versus World Energy Volatility
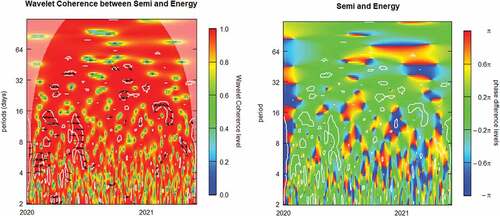
We extend our analysis by reporting results for volatility interdependence between the MSCI World Semiconductor and MSCI World Energy indices. The respective wavelet coherence and phase-difference results are presented in .
Figure 7. Wavelet analysis: Semiconductor index volatility (S_vol) vs. Energy index volatility (E_vol).
The overall coherence pattern on the left heatmap of is similar to the respective panel of and so are the respective findings regarding the varying levels of coherence between the price volatility of the MSCI World Semiconductor and World Energy indices. Similar to the Semi-Energy pair (see ), the left-hand heatmap of exhibits, in the first half of 2020, a cloud of the right pointing arrows (→) which imply an in-phase relationship of a perfect positive correlation between the two volatilities for the 3-week-plus frequency band. As in the previously analyzed case, we ascribe this behavior to the panic-leads-markets meltdown followed by the recovery-leads-markets phase, not producing meaningful discrimination between different sectors and, hence, governing the overall market volatility as a whole. This is also corroborated by the WCPD heatmap, where the location of the respective cloud, confined within white contours, is green-colored, meaning a synchronous behavior between the two volatilities. However, around the apogee of the pandemic-triggered crisis in Mach-April 2020, for 1-to-3-week investment horizons, we observe a red region, identifying a lead role of E_Vol over S_Vol. As the global energy industry was the heaviest hit by the COVID-19 economic impacts, stock prices of energy companies turned very sensitive to the expansion of COVID-19 and outstripped changes in stock prices of semiconductor corporations. Hence, during this initial phase of the pandemic, E_Vol led S_Vol.
However, the situation changes in the third quarter of 2020 when development-positive sector-specific mechanisms start to play a more significant role in the more advanced phase of the recovery. The well-observed blue region in July-September of 2020 in the same 1-to-3-week frequency range clearly indicates a leading role of the semiconductor sector volatility over the volatility of energy sector stock prices. Moreover, the observable alternating red-blue patterns of lead-lag regime switching could be interpreted as the “good” upside volatility of the energy sector interchanging its relative importance with the “bad” downside volatility of energy sector companies. This phenomenon further highlights the decoupling between these two industries accelerated, as demonstrated by our research, throughout the COVID-19 triggered pandemic.
4. Conclusion
We analyze the pairwise dependence between prices and volatilities of three indices, the Media Coverage Index (MCI), the MSCI World Semiconductor Index, and the MSCI World Energy Index. We use the wavelet framework to compute coherence and phase-difference. Our results reveal an alternating pattern of high, medium, and low coherence between stock prices of semiconductor and energy companies and the MCI. Predominantly high coherence underscores a high correlation between a systemic event, such as the COVID-19 induced crisis and both the semiconductor and energy sector volatility highlighting the importance of adequate hedging strategies. However, we notice periods of low coherence across various time and frequency scales for these indices. Low coherence intervals show that both the semiconductor and the energy sector companies as well as their volatility-based products, may possess attractive attributes allowing to harvest diversification benefits. For instance, we evidence that after the escalation of the COVID-19 pandemic in early 2020, the energy sector cedes its leading role in terms of volatility to the semiconductor industry. Thus, this pair of volatilities represents a potentially interesting setup for designing hedge instruments that retain their resilience across periods of global crises such as the COVID-19 global meltdown. We also report a superior diversification potential of the global semiconductor industry during the recovery from the COVID-19 triggered slowdown. We evidence appealing hedging attributes related to the decoupling between the global semiconductor industry and the global energy sector accelerated by the COVID-19 crisis.
Our findings corroborate the usage of investments in the semiconductor and energy industries for developing diversification and downside risk hedging strategies. Our results have important implications for retail and institutional investors, regulators, policy makers, and future research. They can be useful for portfolio managers and investors seeking to develop cross-sector and cross-asset hedging strategies during periods of turmoil as evidenced by the COVID-19 pandemic. Financial institutions could utilize our findings for better delineating accurate risk profiles of their investments in stocks of semiconductor and energy companies, and, hence, for a better allocation of financial resources. Policymakers can use the results of this research for designing policies to reduce downside energy market volatility during highly uncertain times such as the COVID-19 triggered global crisis and for obtaining a more robust economic deployment of production factors. Finally, yet importantly, future research can focus on extending our results by using alternative techniques and assessing implications of including such investments in a portfolio choice framework.
Highlights
We study the effects of COVID-19 triggered crisis on the energy and semiconductor industries.
We document intervals of weak, moderate, and strong coherence.
We analyze comovements and volatility of the media coverage and the sectors indices.
In terms of volatility, the energy (semiconductor) sector leads during the meltdown (recovery).
COVID-19 accelerates decoupling between the global semiconductor and energy sectors.
The semiconductor and energy sectors jointly possess crisis-resilient hedging attributes.
Acknowledgments
The first author thankfully acknowledges the support provided by FCT, I.P., the Portuguese national funding agency for science, research and technology, under the Project UIDB/04521/2020. The article was prepared within the framework of the Basic Research program at HSE University. This research is partly funded by Institute of Business Research, University of Economics Ho Chi Minh City, Ho Chi Minh City, Vietnam.
Disclosure statement
No potential conflict of interest was reported by the author(s).
References
- Cepoi, C.-O. 2020. Asymmetric dependence between stock market returns and news during COVID-19 financial turmoil. Finance Research Letters 36:101658. doi:10.1016/j.frl.2020.101658.
- Gabor, D. 1946. Theory of communication. Journal of the Institution of Electrical Engineers – Part III: Radio and Communication Engineering 93:429–41. doi:10.1049/ji-3-2.1946.0074.
- Goodell, J. 2020. COVID-19 and finance: Agenda for future research. Finance Research Letters 35: 101512. doi:10.1016/j.frl.2020.101512
- Goodell, J., and S. Goutte. 2020. Co-movement of COVID-19 and Bitcoin: Evidence from wavelet coherence analysis. Finance Research Letters 38: 101625. doi:10.1016/j.frl.2020.101625
- Goupillaud, P., A. Grossman, and J. Morlet. 1984. Cycle-octave and related transforms in seismic signal analysis. Geoexploration 23:85–102. doi:10.1016/0016-7142(84)90025-5.
- Gubareva, M. 2021. The impact of the COVID-19 on liquidity of emerging market bonds. Finance Research Letters 41:101826. doi:10.1016/j.frl.2020.101826.
- Gubareva, M., and Z. Umar. 2020. Emerging market debt and the COVID-19 pandemic: A time-frequency analysis of spreads and total returns dynamics. International Journal of Finance & Economics. doi:10.1002/ijfe.2408.
- Gubareva, M., Z. Umar, T. Teplova, and X. V. Vo. 2022. Flights-to-quality from EM bonds to safe-haven US treasury securities: A time-frequency analysis. Emerging Markets Finance and Trade 1–25. doi:10.1080/1540496X.2022.2103399.
- Huang, W., and Y. Zheng. 2020. COVID-19: Structural changes in the relationship between investor sentiment and crude oil futures price. Energy Research Letters 1 (2). doi:10.46557/001c.13685.
- Jawadi, F., N. Jawadi, and A. Cheffou. 2020. Wavelet analysis of the conventional and Islamic stock market relationship ten years after the global financial crisis. Applied Economics Letters 27 (6):466–72. doi:10.1080/13504851.2019.1631438.
- Jawadi, F., W. Louhichi, H. Ameur, and A. Cheffou. 2016. On oil-US exchange rate volatility relationships: An intraday analysis. Economic Modelling 59:329–34. doi:10.1016/j.econmod.2016.07.014.
- Kenourgios, D., Z. Umar, and P. Lemonidi. 2020. On the effect of credit rating announcements on sovereign bonds: International evidence. International Economics 163:58–71. doi:10.1016/j.inteco.2020.04.006.
- Morlet, J., G. Arens, E. Fourgeau, and D. Giard. 1982a. Wave propagation and sampling theory – Part I: Complex signal and scattering in multilayered media. Geophysics 47:203–21. doi:10.1190/1.1441328.
- Morlet, J., G. Arens, E. Fourgeau, and D. Giard. 1982b. Wave propagation and sampling theory – Part II: Sampling theory and complex waves. Geophysics 47:222–36. doi:10.1190/1.1441329.
- Narayan, P. K. 2021. COVID-19 research outcomes: An agenda for future research. Economic Analysis and Policy 71:439–45. doi:10.1016/j.eap.2021.06.006.
- Padhan, R., and K. P. Prabheesh. 2021. The economics of COVID-19 pandemic: A survey. Economic Analysis and Policy 70:220–37. doi:10.1016/j.eap.2021.02.012.
- Riaz, Y., C. Shehzad, and Z. Umar. 2019. Pro-cyclical effect of sovereign rating changes on stock returns: A fact or factoid? Applied Economics 51 (15):1588–601. doi:10.1080/00036846.2018.1527465.
- Riaz, Y., C. T. Shehzad, and Z. Umar. 2021. The sovereign yield curve and credit ratings in GIIPS. International Review of Finance 21 (3). doi:10.1111/irfi.12306.
- Stereńczak, S., A. Zaremba, and Z. Umar. 2020. Is there an illiquidity premium in frontier markets? Emerging Markets Review 42:100673. doi:10.1016/j.ememar.2019.100673.
- Torrence, C., and G. P. Compo. 1998. A Practical Guide to Wavelet Analysis. Bulletin of the American Meteorological Society 79:61–78. doi:10.1175/1520-0477(1998)079.
- Torrence, C., and P. J. Webster. 1999. Interdecadal Changes in the ENSO-Monsoon System. Journal of Climate 12:2679–2690. doi:10.1175/1520-0442(1999)012<2679.
- Umar, Z., and M. Gubareva. 2020. A time–frequency analysis of the impact of the COVID-19 induced panic on the volatility of currency and cryptocurrency markets. Journal of Behavioral and Experimental Finance 28:100404. doi:10.1016/j.jbef.2020.100404.
- Umar, Z., and M. Gubareva. 2021. Faith-based investments and the COVID-19 pandemic: Analyzing equity volatility and media coverage time-frequency relations. Pacific-Basin Finance Journal 67:101571. doi:10.1016/j.pacfin.2021.101571.
- Umar, Z., M. Gubareva, M. Naeem, A. Akhter, and P. Caraiani. 2021c. Return and volatility transmission between oil price shocks and agricultural commodities. Plos One 16 (2):e0246886. doi:10.1371/journal.pone.0246886.
- Umar, Z., M. Gubareva, and T. Teplova. 2021a. The impact of COVID-19 on commodity markets volatility: Analyzing time-frequency relations between commodity prices and coronavirus panic levels. Resources Policy 73:102164. doi:10.1016/j.resourpol.2021.102164.
- Umar, Z., Y. Manel, Y. Riaz, and M. Gubareva. 2021b. Return and volatility transmission between emerging markets and US debt throughout the pandemic crisis. Pacific-Basin Finance Journal 67:101563. doi:10.1016/j.pacfin.2021.101563.
- Umar, Z., C. T. Shehzad, and A. Samitas. 2019. The demand for eurozone stocks and bonds in a time-varying asset allocation framework. European Journal of Finance 25 (11). doi:10.1080/1351847X.2018.1564690.
- Umar, Z., and T. Suleman. 2017. Asymmetric return and volatility transmission in conventional and Islamic equities. Risks 5 (2):22. doi:10.3390/risks5020022.
- Vacha, L., and J. Barunik. 2012. Co-movement of energy commodities revisited: Evidence from wavelet coherence analysis. Energy Economics 34 (1):241–247.
- Zaremba, A., A. Szyszka, A. Karathanasopoulos, and M. Mikutowski. 2021. Herding for profits: Market breadth and the cross-section of global equity returns. Economic Modelling 97:348–64. doi:10.1016/j.econmod.2020.04.006.
- Zaremba, A., Z. Umar, and M. Mikutowski. 2019. Inflation hedging with commodities: A wavelet analysis of seven centuries worth of data. Economics Letters 181. doi:10.1016/j.econlet.2019.05.002.