
 ?Mathematical formulae have been encoded as MathML and are displayed in this HTML version using MathJax in order to improve their display. Uncheck the box to turn MathJax off. This feature requires Javascript. Click on a formula to zoom.
ABSTRACT
This paper examines the small business net revenue club convergence clustering dynamics in 51 states in the United States during the first wave of the Covid-19 pandemic. Our analysis is based on the daily data from January 10, 2020, to June 8, 2020. The results indicate that there was only one club convergence for all states during the first wave of the Covid-19 pandemic. This evidence implies that the support policies enacted during the Covid-19 crisis for small and medium-sized enterprises were effective.
1. Introduction
The Covid-19 pandemic and unprecedented lockdown significantly affected the global economy (Fang, Gozgor, and Nolt Citation2022; Gozgor Citation2022; Vidya and Prabheesh Citation2020). For instance, Bartik et al. (Citation2020), Crane et al. (Citation2022) Fairlie and Fossen (Citation2022) document that the Covid-19 crisis has led to a vast amount of business closures. Drawn on the firm-level Survey of Business Uncertainty, Barrero et al. (Citation2021) find that the Covid-19 pandemic reallocated employment and sales growth across different industries where the industries with a relatively low capacity of employees to work from home are hit the hardest.
The Covid-19 pandemic significantly affected digital innovation in businesses worldwide. Specifically, the Covid-19 pandemic has accelerated digital transformation. Firstly, the Covid-19 pandemic has forced many businesses to quickly adapt to a remote work environment, which has led to accelerating digital transformation efforts (Barrutia and Echebarria Citation2021). At this stage, virtual collaboration tools (e.g., messaging apps and video conferencing) have become essential for businesses with more employees working from home (Hacker et al. Citation2020). Secondly, the Covid-19 pandemic significantly increased online sales because more consumers have shopped at e-commerce. Therefore, many businesses have invested in their digital presence, including delivery services, online marketing and stores (Nanda, Xu, and Zhang Citation2021). Finally, the Covid-19 pandemic has disrupted supply chains worldwide, leading many businesses to reassess their supply chain strategies and invest in more resilient and flexible models (Sharma et al. Citation2021)
According to the United Nations Industrial Development Organization (Citation1999), Small and Medium-sized Enterprises (henceforth SMEs) represent approximately 90% of companies worldwide and more than 50% of employment across the globe. SMEs play an essential role in generating jobs and promoting economic growth globally. However, SMEs are more exposed and vulnerable to the disruption arising from the Covid-19 crisis than large enterprises. This issue is due to a range of reasons about the characteristics of SMEs. First, SMEs are generally concentrated in sectors such as retail, tourism, hospitality and leisure, which are directly affected by government restrictions to control the spread of the pandemic. Second, compared with established large enterprises, SMEs have poor access to external financing and suffer from a liquidity shortage and insolvency. As a result, various stimulus packages have been introduced worldwide to alleviate the adverse effects on private enterprises, especially SMEs.
The revenues of small businesses in the United States can also have direct and indirect effects on emerging markets. For instance, small businesses in the United States import goods or services from emerging markets, contributing to their economies through a global trade network. The revenues of these small businesses have decreased during the Covid-19 pandemic. In that case, they reduced their imports, harming emerging market economies (Vidya and Prabheesh Citation2020). If the United States slows down, this will negatively affect emerging market economies via global value chains and Chinese exports (Qin, Liu, and Zhou Citation2020; Salisu, Adediran, and Gupta Citation2022). However, small businesses in the United States compete with businesses in emerging markets for customers or resources. A decrease in revenues for small businesses in the United States may reduce their competitiveness power, and there can be advantages for emerging market businesses (Luo and Tung Citation2007). In addition, small businesses in the United States invest directly (foreign direct investments) in emerging markets, or they can purchase bonds and stocks (portfolio investments). A decrease in revenues for these businesses may lead to a reduction in investment, which can hurt emerging market economies (Loayza and Pennings Citation2020). Finally, small business owners in the United States may send money back to their home countries to support their families or invest in their businesses. If revenues for these small businesses decrease, they may reduce the money they send back, which can harm emerging economies (Claessens and Yurtoglu Citation2013).
Given these backdrops, this paper investigates the club convergence dynamics of SMEs across the 51 United States states during the first wave of the Covid-19 pandemic. By utilizing the daily net revenue data for small businesses collected from Womply, we find that the support policies enacted during the Covid-19 crisis for small and medium-sized enterprises were effective because we found that all states converged. To the best of our knowledge, this is the first work to bridge the club convergence methodology to evaluate the effectiveness of the United States government support policies and inform future policy design and implementation.
The contribution of this paper is threefold. First, it sheds light on small businesses’ net revenue club convergence paths in the United States during the Covid-19 pandemic. Second, this paper offers a high-frequency and timely analysis using daily data at the firm level. Finally, the empirical findings suggest that the stimulus packages implemented during the Covid-19 crisis for small and medium-sized enterprises positively affected corporate performance regarding net revenue. This paper confirms that government support policies play an imperative role in maintaining resilience and stimulating the recovery of SMEs. Our findings are consistent with Gourinchas et al. (Citation2022) in that the government support schemes have effectively kept a modestly low level of business failures.
The paper is organized as follows. Section 2 discusses the literature on club convergence, clustering methodology, and Covid-19-related studies. Section 3 describes the data and the econometric methodology. Section 4 documents the empirical findings and provides the policy implications of the results. Section 5 concludes.
2. Literature Review
Phillips and Sul (Citation2007) develop a framework to evaluate the economic transition process when growth components are present. This framework enables a convergence regression test and a method to conveniently cluster panels into club convergence groups. This paper utilizes the club convergence and clustering methodology proposed by Phillips and Sul (Citation2007), allowing for heterogeneity and nonlinearity in the panel data. The time-varying convergence dynamics of the United States small businesses in different sectors are evaluated by clustering the firm panel into different club convergence groups.
2.1. Previous Studies on Club Convergence and Clustering Methodology
Fischer and Stirböck (Citation2006) provide an econometric framework that relates club convergence with spatial heterogeneity. The authors confirm that club convergence presents cross-regional growth from a pan-European perspective. Specifically, they show heterogeneity in the convergence rate and the steady-state level of cross-regional growth across 256 regions in 25 European countries. It is pointed out that spatial error dependence leads to bias in identifying clubs in the cross-regional growth convergence process. Hence, it is vital to mitigate the effect of such bias to avoid inaccurate findings and conclusions.
Fischer and Stumpner (Citation2008) investigate the transition process and convergence paths of 27 European Union (EU) regions from 1995 to 2003. The authors show a catching-up of the poorest areas with the wealthier regions at a shallow speed, demonstrating that it is crucial to analyze the regional income distribution process from a geographical perspective. In addition, they highlight the importance of assessing the growth and convergence process at the regional level with spatially filtered data. It is found that the cross-section distribution of regional per capita income is divided into two convergence groups from which the group of wealthier urban regions is shifting away from the remaining areas within the EU. They demonstrate that spatial effects largely explain income distribution dynamics. However, the spatial effects have a minimal role in interpreting the presence of the two convergence groups in European countries. Artelaris, Kallioras, and Petrakos (Citation2010) evaluate the regional inequalities in each European Union’s new member-states by analyzing the presence of convergence clubs at the regional level. The authors find that regional convergence groups are present in multiple European Union new member-states, which indicates that the process of the EU economic integration has a heterogeneous spatial impact on each new member-state. Moreover, they show high regional inequalities across the European Union’s new member-states over time. Consequently, it is shown that policymakers must tackle the regional integration of the European Union’s new member-states with other EU member states.
Rughoo and Sarantis (Citation2014) use the deposit and lending rates of the household sector from 2003 to 2011 to explore the integration process of the retail-banking sector in the EU. The authors also show that the convergence presents all deposits and lending rates to the household sector from 2003 to 2007. They further show convergence in sub-clusters of countries despite the slow convergence rate. However, the convergence in all deposit and credit markets disappeared following the 2008 financial crisis.
In contrast, a few countries are found to be diverging altogether. Apergis, Christou, and Miller (Citation2014) analyze the convergence behavior of international equity markets with both country and industry effects. The authors illustrate that there is the presence of a unified convergence club in 33 equity markets across 42 countries. In particular, they find that country factors are more important than industry factors in interpreting the convergence dynamics in real stock prices. The empirical findings shed light on allocating international equity assets for investors, financial advisers and fund managers. Apergis and Georgellis (Citation2015) investigate the happiness convergence behavior in EU countries. The authors find no entire homogeneous happiness convergence club within the EU countries included in the sample. Also, they provide empirical evidence of the presence of different happiness convergence clubs. The study also discusses gender differences in the convergence of happiness.
Burnett (Citation2016) focuses on the convergence paths of energy-related carbon dioxide emissions across the United States from 1960 to 2010. The authors find the carbon dioxide emissions within a club of 26 states converging to one steady-state growth path through time. In contrast, the divergence of state-level carbon dioxide emissions is presented in the rest of the states in the sample. They also conclude that these 26 states have a higher convergence rate than the entire sample. Herrerias, Aller, and Ordóñez (Citation2017) investigate the convergence dynamics of electricity and coal consumption in rural and urban areas in China from 1995 to 2011. The authors demonstrate the significant club convergence in rural and urban residential energy consumption. With the urbanization transition and the geographical transformation of economic activities in China, they argue that the presence of the regional clusters converging to different steady-state levels requires specific energy policies designed explicitly for different regions in China. More specifically, the authors provide empirical findings suggesting four clubs for coal and two for electricity and liquid gas. Therefore, tailored regional energy policies are needed, given the characteristics of transition paths for different energy sources.
Parker and Liddle (Citation2017) explore the convergence dynamics of energy productivity in 33 countries from 1971 to 2008. The authors observe four clubs for economy-wide energy productivity and six for manufacturing energy productivity. In particular, they find that China and Mauritius are the countries with the best-performing club. In contrast, Brazil and Indonesia experience a dampening of energy productivity in manufacturing. They suggest relevant policy interventions if the worsening energy productivity is permanent instead of merely transitory. In addition, they show that both developing and developed economies converge to long-run equilibrium in energy productivity. Apergis and Payne (Citation2017) employ the club convergence procedure proposed by Phillips and Sul (Citation2007) to investigate the convergence of per capita carbon dioxide emissions at the state level in the United States from 1980 to 2013. They demonstrate convergence clubs in the aggregate and sector (residential, commercial, industrial, transport, and electric). Furthermore, they also find convergence groups for two fossil fuel sources (natural gas and coal). In particular, the authors document full panel convergence in per capita carbon dioxide emissions from petroleum while three convergence clubs present for natural gas and coal emissions, respectively.
Moreover, Gozgor, Lau, and Lu (Citation2019) examine the convergence clustering behavior in 31 Chinese provinces using macroeconomic indicators from 1952 to 2016. The authors use a club convergence and clustering procedure to find the regional clusters in the per capita (real) gross domestic product (GDP), consumption – income ratio, retail price, and consumer price inflation rates. Specifically, there are five significant clusters for the per capita income, four for the consumption – income ratio, four for the retail inflation rates, and two for the consumer inflation rates in China. The empirical results provide policy implications for local and central planners on economic growth, savings and price adjustment policies for different provinces. Bhattacharya, Inekwe, and Sadorsky (Citation2020) investigate the convergence dynamics of carbon dioxide emissions across 70 countries from both consumption and territory perspectives. The authors illustrate two convergence groups for carbon emissions from the consumption perspective and three convergence clubs for carbon emissions from the territory perspective. They find a negative relationship between carbon emissions intensity and total factor productivity, renewable energy consumption and urbanization. At the same time, there is a positive relationship between carbon emissions intensity and industry value-added. In addition, they explore the club convergence paths with an extended dataset, including predicted carbon emissions intensity data from 2015 to 2030. They also find three convergence clubs for consumption-based carbon emissions intensity and two convergence groups for territory-based carbon emissions intensity. The authors further demonstrate that there tend to be more countries in the high carbon emissions intensity group from 2014 to 2030 for both consumption-based and territory-based carbon emissions intensity. Sueyoshi and Wang (Citation2020) utilize the convergence methodology to evaluate sustainable development in 121 countries from 1990 to 2014. The authors confirm club convergence in developing and developed economies by analyzing each country’s economic and environmental performance. They also suggest no convergence to a unique steady state for the entire sample, implying a lack of sustainable development achievement cohesion across the countries included in the sample.
The club convergence analysis highlights the importance of designing and implementing specific environmental policies tackling climate change at the country level (Azam et al. Citation2021). Given the role of income inequality, there is no direct link between economic and sustainable development (Wu et al. Citation2022). Countries with similar economic indicators can evolve along different transitional paths and converge to different steady states in sustainable development. Mazzola and Pizzuto (Citation2020) explore how the Great Global Recession in 2008 was associated with per capita GDP convergence dynamics in the EU-28 regions and countries from 2000 to 2015. They provide empirical evidence indicating that the Great Global Recession had a significant divergent effect on identifying convergence clubs between the European regions and countries, despite its intensified impact on each. Also, they find a “multi-speed” Europe by analyzing the components related to the convergence club membership and comparing the Eastern European countries and regions with the original European members. The results show a positive relationship between regional macroeconomic factors, higher club membership, and resilience to the Great Global Recession in 2008. In addition, they show that globalization contributes to the distinct convergence paths for per capita GDP across the European regions and countries.
2.2. The Covid-19 Related Studies
As shown by Adams-Prassl et al. (Citation2020), the immediate labor market effects of the Covid-19 pandemic are significantly different across the United States (US), the United Kingdom (UK), and Germany by analyzing real-time survey data. The authors find that with a well-established short-time work scheme, workers in Germany are much less affected by the pandemic. They show that the Covid-19 pandemic has a more considerable negative impact on employees in alternative work arrangements who can only undertake a small proportion of work from home. They also find that less educated female employees are likelier to lose their jobs and suffer lower earnings during the pandemic. Alexander, Karger, and McFarland (Citation2020) also analyze the effects of reopening businesses on economic activity and public health in the United States by investigating the relationship between state-level re-openings of nonessential businesses and health outcomes (Covid-19-related deaths and the Covid-19 cases), mobility, and revenue. They find that early reopening can benefit states with a faster recovery of business activity in the short term, albeit at the potential expense of increased Covid-19 cases and deaths in the longer term. Following the outbreak of the Covid-19 pandemic, Crane et al. (Citation2022) find strong evidence of increased business closures among restaurants from the SafeGraph data and some evidence for related industries from the Womply and Homebase data. The authors document that business exits can have detrimental consequences such as job losses, dislocations and the destruction of intangible and fixed capital. The authors point out that small businesses in mining, transportation, warehousing, information, education, leisure and hospitality tend to heighten exit expectations. At the same time, sectors such as construction, finance, insurance, real estate, and professional, scientific, and technical services are likely to perform better than the average.
Finally, Chetty et al. (Citation2020) examine the heterogeneity of the impacts of the Covid-19 pandemic on United States businesses and households. The authors find that the Paycheck Protection Program loans help boost employment at small businesses by just 3%. They emphasize the importance of stimulating the economy through social insurance instead of injecting liquidity into businesses since health concerns during the pandemic restrict consumption. This finding is confirmed by Dong et al. (Citation2021) since they found that the Covid-19 pandemic has decreased personal consumption in the United States across 51 states significantly.
3. Data and Econometric Methodology
3.1. Data
We examine state-level clusters for small business activities (measured by small business revenues) in the United States. The balanced panel data are based on 51 states in the United States from January 10, 2020, to June 8, 2020. The frequency of the data is daily. All data are seasonally adjusted and are defined as the growth rate relative to the averaged indexed data from January 4, 2020, to January 31, 2020.
The data series described below can be freely downloaded from the Economic Tracker website. The data consists of a per cent change in net revenue for small businesses, calculated as a seven-day moving average, seasonally adjusted, and indexed from January 4, 2020, to January 31, 2020. The list of states, including the statefips and state abbreviations involved in our empirical analyses, is provided in .
Table 1. States included in the dataset.
We consider the whole business (all sectors) at the state level. We also focus on small businesses in different sectors: i) trade, transportation, and utilities, ii) professional and business services, iii) education and health services, iv) leisure and hospitality, v) accommodation and food services, and vi) retail trade sectors. We downloaded the related data from https://tracktherecovery.org/, introduced by Chetty et al. (Citation2020). The list of states, including the statefips and state abbreviations involved in our empirical analyses, is provided in . We also summarize the descriptive statistics of the indicators in the dataset in .
Table 2. Descriptive statistics.
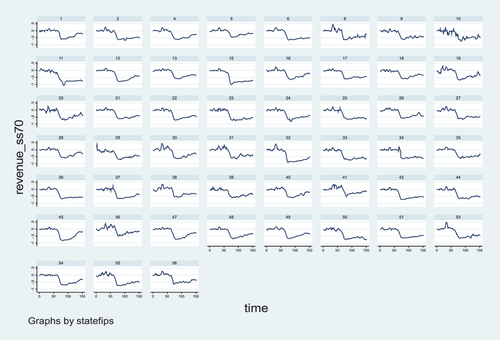
plot the graph for “revenue_all,” “revenue_inchigh,” “revenue_inclow,” “revenue_incmiddle,” “revenue_ss40,” “revenue_ss60,” “revenue_ss65,” and “revenue_ss70,” respectively.Footnote1 We observe from the figures that there is a structural break for net revenue percentage just before April 18, 2020 (see ). The impact of Covid-19 in the high-income (quartile 4 of median income) zipcode areas seems minimal (see ). In contrast, the net revenue percentage growth for the low-income (quartile 1 of median income) zip code areas is more volatile. The professional and business services (NAICS supersector 60) seem more resilient to the Covid-19 pandemic.
Figure 1. Plot for the “revenue_all” across 51 states.
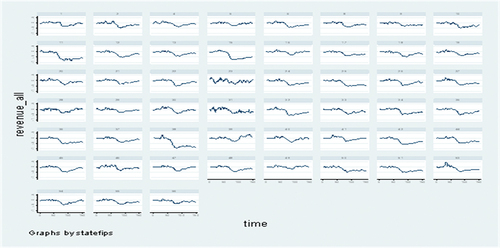
Figure 2. Plot for the “revenue_inchigh” across 51 states.
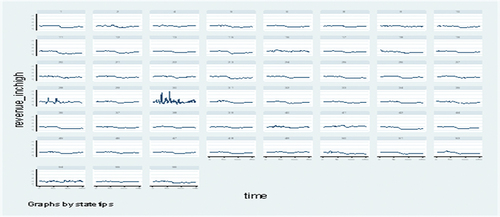
Figure 3. Plot for the “revenue_inclow” across 51 states.
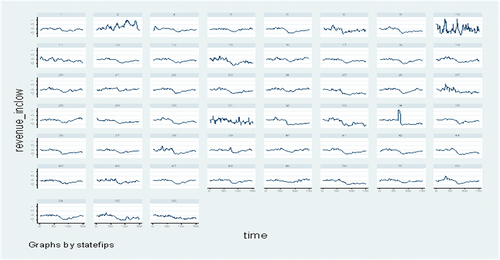
Figure 4. Plot for the “revenue_incmiddle” across 51 states.
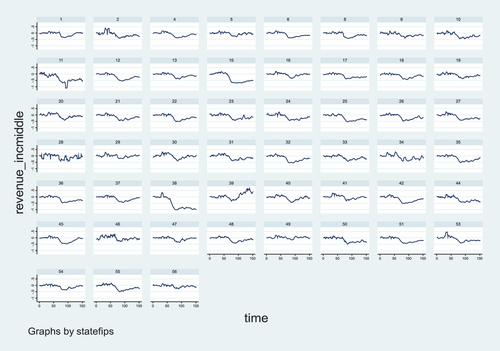
Figure 5. Plot for the “revenue_ss40” across 51 states.
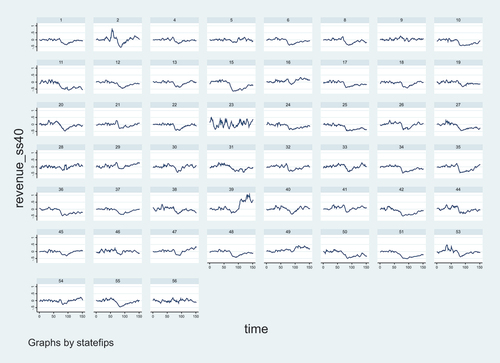
Figure 6. Plot for the “revenue_ss60” across 51 states.
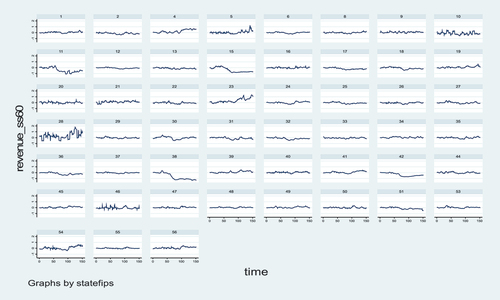
Figure 7. Plot for the “revenue_ss65” across 51 states.
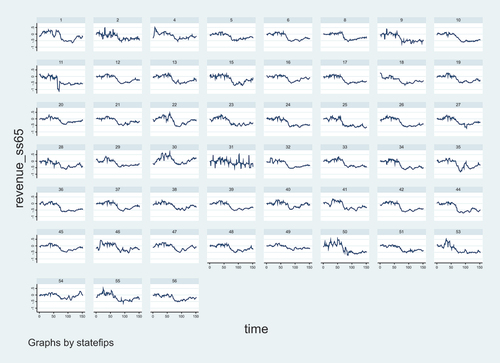
Figure 8. Plot for the “revenue_ss70” across 51 states.
3.2. Econometric Methodology
Phillips and Sul (Citation2007, Citation2009) propose the econometric technique for testing convergence and identifying convergence clubs. This econometric technique considers a nonlinear time-varying factor model and uses a nonlinear transition mechanism with different stages. The main advantage of this technique is based on the validity of stationary time series (Lau et al. Citation2022). Also, this approach is valid when there are common factors in the data-generating process. On the other hand, an econometric technique of Phillips and Sul (Citation2007) allows cross-section heterogeneity of cross-sections (states) within an unbalanced panel dataset.
At this stage, the convergence test analyses consider transitional dynamics of the states in the United States, which are expected to have different cross-sectional dependencies in the convergence testing procedure in the panel datasets (Meyer, Prescott, and Sheng Citation2022). Specifically, several states are initially in a state of the Covid-19 shocks or can be around the steady-state equilibrium of the Covid-19 shocks on businesses. We use the growth rate of daily data relative to the index’s average from January 4, 2020, to January 31, 2020. We also consider 51 individual states with the growth rates of business activities from January 10, 2020, to June 8, 2020. Therefore, we have 151 days sample for every 51 states in the United States, potentially having heterogeneous convergence paths.
Overall, the econometric approach is suitable for analyzing the convergence of business activities in the United States at the state-level data. Our paper’s main objective is to empirically determine the convergence clubs in business activities in the United States. We explain the details of the convergence club’s approach as follows.
3.2.1. Relative Transition Paths
The variable indicates the variable of interest for state i at time t, where i=1,2, … , N; t=1,2, … , T. Following Phillips and Sul (Citation2007), the business activity indicator can be decomposed into two components: the standard components of cross-sectional dependence in a panel,
and transitory components,
, as such:
Phillips and Sul (Citation2007) reformulate EquationEquation (1)(1)
(1) as common and idiosyncratic components are separated. At this stage, the estimated model takes a nonlinear form as such:
EquationEquation (2)(2)
(2) indicates
is the standard component and
is a time-varying distinctive element. Therefore,
measures the relative distance between the common trend component
and source states’ initial value of
at time t.
For example, in terms of business revenues, stands for a standard business revenues trend in 51 states, while
represents a relative share of specific business revenue in a common trend in the United States economy at the state level. The primary approach in the convergence technique of Phillips and Sul (Citation2007, Citation2009) is to obtain the time-varying loadings,
which can be considered to explain the club convergence if the loadings will converge.
Then, Phillips and Sul (Citation2007, Citation2009) introduce the transition coefficient, and calculate the time-varying factor loadings,
, as such:
Where, is the transition parameter, which can measure,
, related to the panel average at time
. Therefore, we describe the transition path for source state
relative to the panel average. Data for all indicators are de-trended by Hodrick-Prescott’s filter with Lambda value set to 1440 for daily data to remove the cyclical trend from the original data. The filtered transition parameter coefficients are defined as
. While the extracted time trend is indicated as
.
Meanwhile, the club convergence test constructed the cross-sectional variance ratio, and that is:
Phillips and Sul (Citation2007, Citation2009) show that the transition distance, Ht, has a limitation as such:
Where, A is a positive constant, L(t) is a function of t, and indicates the convergence speed. Phillips and Sul (Citation2007, Citation2009) perform log t regressions to test for the null hypothesis of convergence. Therefore, the null hypothesis of convergence can be written as follows:
and
and against the alternative
for all
or
3.2.2. The Log t Regression
Following Phillips and Sul (Citation2007, Citation2009), the below Ordinary Least Squares (OLS) regression is performed:
In EquationEquation (6)(6)
(6) ,
and the fitted coefficient of log
is
, where and
is the estimate of
in the null hypothesis. The squares of log t are included to increase the power to capture the nonlinearities. We use the impact of initial conditions on the test. Therefore, we run empirical regression after a sample fraction is removed.
The data for the Log t regression starts at some point with
Phillips and Sul (Citation2007) recommend
to employ a one-sided
-test of null
. The authors use the estimate of
. The estimates’ standard errors are calculated by the heteroskedasticity and autocorrelation consistent (HAC) estimator for the residuals’ long-run variance. At this stage, the test statistic
is normally distributed. In other words, the decision rule for the null hypothesis of convergence is rejected if
3.2.3. Club Convergence Algorithm
Phillips and Sul (Citation2007, Citation2009) further argue that a strict rejection of the null of global convergence may rule out sub-group convergence within the panel. Within this approach, our paper provides new information on the convergence process within business activities in 51 states in the United States by explaining whether the convergence clusters are presented in the period under concern. A club convergence algorithm is developed to detect units of the clusters. This approach of club convergence is vital since the relationship can be further investigated based on states’ economic structural characteristics. The clustering algorithm is based on repeated regressions; therefore, it provides the following four main steps:
Step 1 (Ordering): One should order the indicator (i.e., the series) in the panel dataset following the last observation.
Step 2 (Core Group Formation): One should calculate the convergence t-statistic for each panel unit (k). A core group is formed by choosing the first
highest panel members (Step 1) to form the subgroup
for some
and the core group size
is chosen by maximizing
under the condition that min
.
Step 3 (Club Membership): One should select the states for membership in the core group (Step 2) by including each remaining state separately in the core group. The log test is run. The new state (member) will be added in the associated t-statistic greater than zero (conservative choice) – the convergence criterion checks for the club as usual.
Step 4 (Recursion and Stopping): One should utilize the log -test on the group of unselected states indicated in the previous step. If no subgroups exist (see Step 2), these states demonstrate a divergent pattern during the concerning period. If this set of states converges, the second club will be checked. Otherwise, the procedure will repeat Steps 1 to 3 to explain some sub-convergent clusters.
4. Empirical Results
4.1. Club Convergence Dynamics
The result for the club convergence clustering hypothesis is provided in for eight categories of percentage change in net revenue for small businesses.
Table 3. Club convergence tests for net revenues.
The empirical findings indicate a single club convergence for all net revenue indicators, except for “revenue_ss60,” professional and business services (NAICS supersector 60). For the “All” category, the t-statistic is 0.832, implying that the (null) convergence hypothesis cannot be rejected. An interesting result was detected for the category of “ss60” in professional and business services (NAICS supersector 60). Two clubs for this category were found, with the log t regression for the first club consisting of 48 states. The associated t-statistic is −0.971, indicating that the null hypothesis of convergence can be rejected. The second club consists of three states (the District of Columbia, Hawaii, and North Dakota) with an associated t-statistic of 1.582, indicating that the null convergence hypothesis can be rejected.
4.2. Policy Implications
The Covid-19 crisis is considered to have created one of, if not the most considerable, government debt to rescue the global public and economy. In particular, the United States government deficit reached $3.1 Trillion, corresponding to 14.9% of GDP in 2020, the largest proportion since World War II. Despite the effective support policies enacted during the first wave of the pandemic, it is worth noting that a significant amount of small businesses will be at risk of failure when the government Covid-19 support schemes suspend and employees come off furlough (Zhang et al. Citation2021). Therefore, we emphasize that Covid-19 has persistent damage to small businesses and argue that both short-run and long-run support policies should be in place to attenuate the negative impacts of the pandemic.
This evidence has two implications for policymakers to consider. First, a sharp fiscal cliff on support for viable SMEs is undesired, whilst the implementation of tailored support policies in the middle to long-term underpinned by the features of SMEs will provide additional flexibility to assist small businesses in reducing potential debt-overhang risk and overcoming insolvency crisis. Second, it is crucial to provide targeted stimulus packages explicitly to small companies with high growth potential, which is beneficial to enhancing productivity and stimulating the economy’s recovery.
5. Conclusion
This paper presented an empirical analysis of small business club convergence patterns during the Covid-19 crisis. In particular, the paper explored the small business net revenue club convergence clustering hypothesis in 51 states in the United States during the first wave of the Covid-19 pandemic. The empirical analyses are based on the daily data from January 10, 2020, to June 8, 2020. It is found that there was only one club convergence for all states during the first wave of the Covid-19 pandemic, implying that the support policies, including emergency liquidity support measures enacted during the Covid-19 crisis for small and medium-sized enterprise, was adequate.
This paper provides policy implications that address the importance of the swift implementation of effective support policies in both the short-term and long term. However, our evidence is limited to the first wave of Covid-19, which ended in June 2020. It is also only available in the United States. At this stage, future papers can use more comprehensive data and focus on the post-pandemic era to investigate the small business indicators’ club convergence in 51 states in the United States.
Disclosure Statement
No potential conflict of interest was reported by the author(s).
Correction Statement
This article has been republished with minor changes. These changes do not impact the academic content of the article.
Notes
1. Note that the “revenue_all” is calculated as a seven-day moving average seasonally adjusted and indexed to from January 4, 2020 to January 31, 2020. “revenue_inchigh” is calculated as a seven-day moving average seasonally adjusted and indexed to January 4–31 2020 in high income (quartile 4 of median income) zipcodes. “revenue_inclow,” is calculated as a seven-day moving average seasonally adjusted and indexed to January 4–31 2020 in low income (quartile 1 of median income) zipcodes. “revenue_incmiddle” is calculated as a seven-day moving average seasonally adjusted and indexed to January 4–31 2020 in middle income (quartiles 2 & 3 of median income) zipcodes. “revenue_ss40” is calculated as a seven-day moving average seasonally adjusted and indexed to January 4–31 2020 in transportation (NAICS supersector 40). “revenue_ss60” is calculated as a seven-day moving average seasonally adjusted and indexed to January 4–31 2020 in professional and business services (NAICS supersector 60). “revenue_ss65” is calculated as a seven-day moving average seasonally adjusted and indexed to January 4–31 2020 in education and health services (NAICS supersector 65). Finally, “revenue_ss70” is calculated as a seven-day moving average seasonally adjusted and indexed to January 4–31, 2020, in leisure and hospitality (NAICS supersector 70).
References
- Adams-Prassl, A., T. Boneva, M. Golin, and C. Rauh. 2020. Inequality in the impact of the coronavirus shock: Evidence from real time surveys. Journal of Public Economics 189:104245. doi:10.1016/j.jpubeco.2020.104245.
- Alexander, D., E. Karger, and A. McFarland. 2020. Measuring the relationship between business reopenings, Covid-19, and consumer behavior. Chicago Fed Letter 445:1–6. doi:10.21033/cfl-2020-445.
- Apergis, N., C. Christou, and S. M. Miller. 2014. Country and industry convergence of equity markets: International evidence from club convergence and clustering. The North American Journal of Economics & Finance 29:36–58. doi:10.1016/j.najef.2014.05.002.
- Apergis, N., and Y. Georgellis. 2015. Does happiness converge? Journal of Happiness Studies 16 (1):67–76. doi:10.1007/s10902-013-9495-y.
- Apergis, N., and J. E. Payne. 2017. Per capita carbon dioxide emissions across US states by sector and fossil fuel source: Evidence from club convergence tests. Energy Economics 63:365–72. doi:10.1016/j.eneco.2016.11.027.
- Artelaris, P., D. Kallioras, and G. Petrakos. 2010. Regional inequalities and convergence clubs in the European Union new member-states. Eastern Journal of European Studies 1 (1):113.
- Azam, M., A. I. Hunjra, E. Bouri, Y. Tan, and M. A. S. Al-Faryan. 2021. Impact of institutional quality on sustainable development: Evidence from developing countries. Journal of Environmental Management 298:113465. doi:10.1016/j.jenvman.2021.113465.
- Barrero, J. M., N. Bloom, S. J. Davis, and B. H. Meyer. 2021. COVID-19 is a persistent reallocation shock. AEA Papers & Proceedings 111 (5):287–91. doi:10.1257/pandp.20211110.
- Barrutia, J. M., and C. Echebarria. 2021. Effect of the COVID-19 pandemic on public managers’ attitudes toward digital transformation. Technology in Society 67:101776. doi:10.1016/j.techsoc.2021.101776.
- Bartik, A. W., M. Bertrand, Z. Cullen, E. L. Glaeser, M. Luca, and C. Stanton. 2020. The impact of COVID-19 on small business outcomes and expectations. Proceedings of the National Academy of Sciences 117 (30):17656–66. doi:10.1073/pnas.2006991117.
- Bhattacharya, M., J. N. Inekwe, & P. Sadorsky. 2020. Consumption-based and territory-based carbon emissions intensity: Determinants and forecasting using club convergence across countries. Energy Economics 86:104632. doi:10.1016/j.eneco.2019.104632.
- Burnett, J. W. 2016. Club convergence and clustering of US energy-related CO2 emissions. Resource and Energy Economics 46:62–84. doi:10.1016/j.reseneeco.2016.09.001.
- Chetty, R., J. N. Friedman, N. Hendren, and M. Stepner. 2020. The economic impacts of COVID-19: Evidence from a new public database built using private sector data. National Bureau of Economic Research (NBER) Working Paper, No. 27431, NBER, Cambridge, MA.
- Claessens, S., and B. B. Yurtoglu. 2013. Corporate governance in emerging markets: A survey. Emerging Markets Review 15:1–33. doi:10.1016/j.ememar.2012.03.002.
- Crane, L. D., R. A. Decker, A. Flaaen, A. Hamins-Puertolas, and C. Kurz. 2022. Business exit during the COVID-19 pandemic: Non-traditional measures in historical context. Journal of Macroeconomics 72:103419. doi:10.1016/j.jmacro.2022.103419.
- Dong, D., G. Gozgor, Z. Lu, and C. Yan. 2021. Personal consumption in the United States during the COVID-19 crisis. Applied Economics 53 (11):1311–16. doi:10.1080/00036846.2020.1828808.
- Fairlie, R., and F. M. Fossen. 2022. The early impacts of the COVID-19 pandemic on business sales. Small Business Economics 58 (4):1853–64. doi:10.1007/s11187-021-00479-4.
- Fang, J., G. Gozgor, and J. H. Nolt. 2022. Globalisation, economic uncertainty and labour market regulations: Implications for the COVID‐19 crisis. The World Economy 45 (7):2165–87. doi:10.1111/twec.13230.
- Fischer, M. M., and C. Stirböck. 2006. Pan-European regional income growth and club-convergence. The Annals of Regional Science 40 (4):693–721. doi:10.1007/s00168-005-0042-6.
- Fischer, M. M., and P. Stumpner. 2008. Income distribution dynamics and cross-region convergence in Europe. Journal of Geographical Systems 10 (2):109–39. doi:10.1007/s10109-008-0060-x.
- Gourinchas, P. O., S. Kalemli-Özcan, V. Penciakova, and N. Sander. 2022. Estimating SME failures in real time: An application to the COVID-19 crisis. National Bureau of Economic Research (NBER) Working Paper, No. 27877, NBER, Cambridge, MA.
- Gozgor, G. 2022. Global evidence on the determinants of public trust in governments during the COVID-19. Applied Research in Quality of Life 17 (2):559–78. doi:10.1007/s11482-020-09902-6.
- Gozgor, G., C. K. M. Lau, and Z. Lu. 2019. Convergence clustering in the Chinese provinces: New evidence from several macroeconomic indicators. Review of Development Economics 23 (3):1331–46. doi:10.1111/rode.12590.
- Hacker, J., J. Vom Brocke, J. Handali, M. Otto, and J. Schneider. 2020. Virtually in this together–how web-conferencing systems enabled a new virtual togetherness during the COVID-19 crisis. European Journal of Information Systems 29 (5):563–84. doi:10.1080/0960085X.2020.1814680.
- Herrerias, M. J., C. Aller, and J. Ordóñez. 2017. Residential energy consumption: A convergence analysis across Chinese regions. Energy Economics 62:371–81. doi:10.1016/j.eneco.2016.06.006.
- Lau, C. K., S. Pal, M. K. Mahalik, and G. Gozgor. 2022. Economic globalization convergence in high and low globalized developing economies: Implications for the post Covid-19 era. Economic Analysis and Policy 76:1027–39. doi:10.1016/j.eap.2022.10.013.
- Loayza, N., and S. M. Pennings. 2020. Macroeconomic policy in the time of COVID-19: A primer for developing countries. World Bank Research and Policy Briefs, No 147291, The World Bank, Washington, DC.
- Luo, Y., and R. L. Tung. 2007. International expansion of emerging market enterprises: A springboard perspective. Journal of International Business Studies 38 (4):481–98. doi:10.1057/palgrave.jibs.8400275.
- Mazzola, F., and P. Pizzuto. 2020. Great Recession and club convergence in Europe: A cross‐country, cross-region panel analysis (2000-2015). Growth and Change 51 (2):676–711.0. doi:10.1111/grow.12369.
- Meyer, B. H., B. Prescott, and X. S. Sheng. 2022. The impact of the COVID-19 pandemic on business expectations. International Journal of Forecasting 38 (2):529–44. doi:10.1016/j.ijforecast.2021.02.009.
- Nanda, A., Y. Xu, and F. Zhang. 2021. How would the COVID-19 pandemic reshape retail real estate and high streets through acceleration of E-commerce and digitalization? Journal of Urban Management 10 (2):110–24. doi:10.1016/j.jum.2021.04.001.
- Parker, S., and B. Liddle. 2017. Economy-wide and manufacturing energy productivity transition paths and club convergence for OECD and non-OECD countries. Energy Economics 62:338–46. doi:10.1016/j.eneco.2016.07.018.
- Phillips, P. C., and D. Sul. 2007. Transition modeling and econometric convergence tests. Econometrica 75 (6):1771–855. doi:10.1111/j.1468-0262.2007.00811.x.
- Phillips, P. C., and D. Sul. 2009. Economic transition and growth. Journal of Applied Econometrics 24 (7):1153–85. doi:10.1002/jae.1080.
- Qin, M., X. Liu, and X. Zhou. 2020. Covid-19 shock and global value chains: Is there a substitute for China? Emerging Markets Finance and Trade 56 (15):3588–98. doi:10.1080/1540496X.2020.1855137.
- Rughoo, A., and N. Sarantis. 2014. The global financial crisis and integration in European retail banking. Journal of Banking & Finance 40:28–41. doi:10.1016/j.jbankfin.2013.11.017.
- Salisu, A. A., I. A. Adediran, and R. Gupta. 2022. A note on the COVID-19 shock and real GDP in emerging economies. Emerging Markets Finance and Trade 58 (1):93–101. doi:10.1080/1540496X.2021.1981854.
- Sharma, M., S. Luthra, S. Joshi, and A. Kumar. 2021. Accelerating retail supply chain performance against pandemic disruption: Adopting resilient strategies to mitigate the long-term effects. Journal of Enterprise Information Management 34 (6):1844–73. doi:10.1108/JEIM-07-2020-0286.
- Sueyoshi, T., and D. D. Wang. 2020. Rank dynamics and club convergence of sustainable development for countries around the world. Journal of Cleaner Production 250:119480. doi:10.1016/j.jclepro.2019.119480.
- United Nations Industrial Development Organization. 1999. Capacity building for private sector development in Africa private sector development branch investment promotion and institutional capacity building division. Vienna: United Nations Industrial Development Organization.
- Vidya, C. T., and K. P. Prabheesh. 2020. Implications of COVID-19 pandemic on the global trade networks. Emerging Markets Finance and Trade 56 (10):2408–21. doi:10.1080/1540496X.2020.1785426.
- Wu, W., L. Wang, Y. O. Erzurumlu, G. Gozgor, and G. Yang. 2022. Effects of country and geopolitical risks on income inequality: Evidence from emerging economies. Emerging Markets Finance and Trade 58 (15):4218–30. doi:10.1080/1540496X.2022.2070002.
- Zhang, X., G. Gozgor, Z. Lu, and J. Zhang. 2021. Employment hysteresis in the United States during the COVID-19 pandemic. Economic Research-Ekonomska Istraživanja 34 (1):3343–54. doi:10.1080/1331677X.2021.1875253.