Abstract
Exposure to tobacco smoke is an important risk factor for chronic obstructive pulmonary disease. We investigated the relationship between chronic obstructive pulmonary disease hospitalization counts (and hospitalization-related charges) in California and sociodemographic and smoking measures, employing geospatial techniques that permit more sensitive scrutiny at the zip code level while controlling for spatial confounding. We analyzed 1,707 zip code tabulation areas in California for chronic obstructive pulmonary disease hospitalization rates and related hospitalization charges (using 1999 hospital discharge data). After controlling for spatial auto-correlation, positive relationships were found for age, percentage Hispanics, number of tobacco outlets and level of smoking. Inverse relationships were found for percentage with undergraduate degrees and income level. When examining “hotspot” zip code tabulation areas (those with higher than expected model-based chronic obstructive pulmonary disease hospitalization counts), minority/immigrant status, depressed socioeconomic measures, and elevated tobacco use were clearly associated, suggesting the need for increased intervention among the poor and persons of color. Although limited by the availability of air pollution monitoring data, a preliminary descriptive analysis indicated that the numbers of particulate matter exceedances mirrored both the hotspots of the Los Angeles air basin and coldspots in the San Francisco Bay Area.
INTRODUCTION
The State of California provides an interesting context in which to study COPD. California, as the nation's most populous state, has experienced a great deal of population growth in the last 10 years and comprises approximately 10% of the U.S. population. Roughly 1.6 million people are thus afflicted with COPD within the state [Citation[1]]. California is characterized by significant cultural and economic diversity and thus provides an opportunity to consider the distribution of the disease relative to a number of sociodemographic, environmental, and behavioral (most notably smoking) characteristics. Moreover, there is a great deal of physiologic evidence for the damaging effects of air pollutants on lung function [Citation[2]], and parts of the state suffer from some of the worst air pollution in the United States. Given the fact that COPD is a very expensive disease to treat as well as costly in regard to premature morbidity and mortality, it is imperative that we develop a thorough understanding of the dimensions of this disease, both in terms of costs and prevalence. Motivated by this concern, this analysis will examine the distribution of COPD in California in 1999 relative to background demographic, environmental and behavioral characteristics.
An additional feature of this examination is its explicit geospatial methodology. Few COPD studies have included geographical information. Sobradillo and co-workers [Citation[3]] compared rural-urban differences in Spain; those in urban areas had a higher probability of a previous diagnosis of COPD compared to those in rural areas. At present there is relatively little known about the spatial distribution of COPD prevalence and disease-related hospitalization charges in California, particularly at any level lower than the county. Possible geographic differences in COPD will be obscured at this relatively large areal level. In this research, we analyze COPD hospitalization counts and hospitalization charges by zip code tabulation area (ZCTA). Spatial analysis helps to discern sociodemographic characteristics and tobacco use information across ZCTAs in ways not available with more typical non-spatial methods. In addition, this research identifies, through spatial modeling, ZCTAs with higher than expected hospitalization counts and hospitalization charges as well as comparing highest decile ZCTAs to all other areas. This approach is rarely seen in the COPD literature.
METHODS
Health data
This analysis uses 1707 zip code tabulation areas, as defined by the U.S. Census, for the entire state of California in 1999. All information used in this analysis was available at the ZCTA level, including addresses. We geo-coded addresses by ZCTAs for the 1999 data and joined them with the U.S. Census Bureau summary files 3 (SF-3) for ZCTAs. One of the benefits of using ZCTAs is that the SF-3 data contain detailed variable information.
We collected annual audited hospital discharge data (HDD) for all inpatients discharged from hospitals licensed by the State of California, as submitted to the Medical Information Reporting for California System (MIRCal) [Citation[4]]. Over 3 million patient records were available in 1999 HDD. These data contain pertinent information for diagnosis, reason for hospital stay and charges for stay. Using these records, we analyzed hospitalization counts of COPD, defined as ICD-9 codes 490-492, 494, 496. Asthma was not included in this analysis because it is not as specific to smoking as are other COPD related problems. People of all ages and for a variety of reasons can have asthma. This is not as generally true for major COPD-related illness such as emphysema and chronic bronchitis.
The main point of this analysis is to robustly describe the spatial pattern of COPD; we are not attempting to etiologically explain this distribution as much as we are attempting to give health planners better information about the geography of this illness in California. Hospitalization charge information is a basic measure of what a particular hospital has charged (guidelines for this are provided by the state of California) for a specific service or procedure. This charge is not the same as the actual cost to the hospital. Hospital costs vary by a number of different factors. For example, hospitals in dense urban areas tend to have higher costs per service/procedure than do hospitals in less dense areas. Such differences between costs and charges, for the purposes of this descriptive spatial analysis, will not significantly bias our findings because such differences are reasonably consistent across areas. We are interested in relative differences in financial burden across areas, which will track quite closely to the relative differences in costs and COPD prevalence, particularly when controlling for sociodemographic variables. It should be pointed out that neither charge nor cost represents the “true” financial story for any particular illness; both are estimates based on a large array of assumptions, such as consistency of diagnosis across region.
Since hospital admissions data do not code for readmission, readmission issues are not addressed in hospitalization charges. However, it can be assumed that biased geographic variability of readmission rates may be quite insignificant; i.e., that differences in readmission rates are randomly distributed throughout the state. Similarly, although hospitalization charges are not complete, they are assumed to be distributed in an unbiased manner throughout the state.
Hospitalization charges excluded Kaiser—approximately one-sixth of the patient population in California, and Shriner-insured patients. However these insurance plans represent urban areas in California with consistent/unbiased proportions and their absence does little to influence the geography of COPD in the state. This spatial analysis is a general characterization across the state. Possible bias introduced by some regions having more or less Kaiser and Shriner representation will do little, in the aggregate, to influence the overall geography of COPD in the state. The HDD counts data provide robust numbers for illness by ICD-9 and ICD-10 definitions, as well as information on hospitalization-related charges.
Sociodemographic variables
Age, income, education, ethnicity/race, household information, and immigrant status were obtained from 2000 United States Census data.
Smoking prevalence data
Data on smoking prevalence was obtained from the California Tobacco Survey (CTS) 1999 screening questionnaire, which surveyed approximately 126,000 people. The measure of daily smoking was used in this analysis.
Tobacco outlet information was obtained from the Tobacco Control Section (TCS) of the California Department of Health Services using California Board of Equalization (BOE) data for classification of businesses on specific codes most likely to be tobacco retailers. These data have only been made available as of 2000. The TCS also uses the list of retailers given (by law) from tobacco wholesalers. This list, however, is reported to contain a great deal of non-tobacco retailers and the BOE list is generally better. The tobacco retailer list changes yearly, but recently averages 38,000 to 47,000 actual outlets. Initially, it was reported that only about 55% of the tobacco outlet list were tobacco retailers. Although specificity is not particularly high, it is not known if geographic distribution of outlets is biased.
Air pollution data
Air pollution information was obtained from the Air Resources Board of California (ARB). ARB air monitoring stations are sited to best describe air pollution contaminants and levels in California, and as such are representative of the immediate area in which they are located. Given that air pollution information is not available for every zip code, many areas of the state are under-represented. However, multiple stations in tandem within a particular air basin can provide a descriptive picture of the overall air quality within that region. Urban areas and areas with higher levels of pollutants, such as the eastern San Joaquin Valley, are over-sampled relative to most of the state. For the purposes of this research, we chose particulate matter less than 10 microns in diameter (PM-10) as the pollutant most related to COPD [Citation[5]]. Although not a completely specific measure, PM-10 serves as a useful marker. In this regard, we descriptively examined the association of COPD hospitalization counts at each of the 151 monitoring stations located throughout the state with the number of annual exceedances of the State of California 24-hour PM-10 standard (50 μ g/m3).
Descriptive statistics
Crude data on health, sociodemographic variables, and smoking were examined using a traditional decile analysis that compared the top decile to all other deciles. Two types of deciles were defined:
The 171 ZCTAs with the highest numbers of crude hospitalization counts, and
The 171 ZCTAs with the highest total dollar amounts for hospital stay charges.
Spatial modeling
Correlated measurement error between spatial units often occurs in analyses of geographic data and can be a source of substantial bias in statistical tests. The tendency of measurement errors between adjacent units to be correlated (spatial autocorrelation or over-sampling errors) can be corrected using spatial statistical models. Generalized least squares (GLS) estimators are available for this purpose and provide unbiased estimates of effects and diagnostics for this form of correlated measurement error [Citation[6], Citation[7], Citation[8], Citation[9]].
Moran's “I” statistic (MC) is a weighted correlation coefficient used to detect departures from spatial “unbiasness.” It measures spatial autocorrelation using a non-parametric procedure [Citation[10]]. Using Moran's I statistics, it was evident that large-scale spatial autocorrelation existed if the discharge data were aggregated at the ZCTA level. The MC for COPD hospitalization charges was 0.44, while the expected value for MC was −0.00058 (or approximately the theoretical mean of 0). This relatively high level of spatial bias requires “adjustment” before regression results can be coherently assessed. Spatial regression is defined as non-linear regression that requires “weighting” to correct for autocorrelation. In this regard, using S3 (a set of analysis MathematicaTM commands developed for space-time regression models) [Citation[11]], it was possible to adjust for spatial autocorrelations. By definition S3 adjusts for autocorrelation bias.
Challenges with ecological analyses
COPD hospitalization charges were used to identify outlier ZCTAs using the generalized least squares (GLS) regression model which also controls for spatial autocorrelation. Comparing values between ZCTAs requires density adjustment to correct for variances in ZCTA population at risk. This is traditionally done by comparing rates like per capita charge or counts per 100,000 population when such linear adjustments sufficiently control for variances in area. However, in a regression model, this is achieved by including an independent variable which does not require the restrictive assumption of linearity when controlling for density. The unadjusted dependent variable (COPD hospitalization charges in a ZCTA) used to identify the outlier ZCTAs was adjusted by inclusion of the independent variable, age 45 or greater, which is assumed to provide an appropriate density correction. This approach limits the effects of over-smoothing and the linear assumption of density (which is a function of simply dividing by population) that could result when both independent and dependent density measures are created using a common population measure.
Analytic approach
This study is designed to generate information that can be of further use for research and public health/public policy needs. In this regard, mean differences across ZCTAs for sociodemographic, HDD, and smoking measures are described. Further maps showing COPD hospital admission rates (as an approximation of COPD prevalence) and cost distribution across the state are presented. Modeling serves to control for spatial autocorrelation across ZCTAs. Models are generated comparing independent sociodemographic variables, smoking prevalence, and tobacco outlet information. Using this modeling we identify ZCTAs with higher than expected COPD hospital admission rates and COPD hospitalization charges. For these “hotspots” we compare differences and similarities for sociodemographic variables, smoking prevalence, tobacco outlet measures. Further, as a result of findings during the course of this study, we compare hotspot areas in the Los Angeles and San Francisco Bay Area Metropolitan Statistical Areas (MSA). We also perform this comparison for the highest decile COPD hospital admission rates and COPD hospitalization charges compared to all other deciles.
RESULTS
Crude data
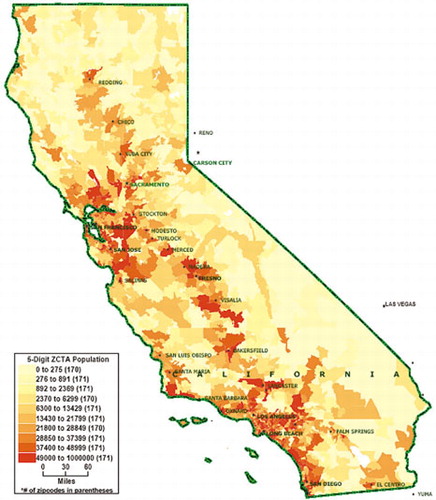
In , population density for the state is given by ZCTA in the year 2000. Although expected high population density is shown in the Los Angeles basin and the San Francisco Bay Area, there is also relatively high density in the central San Joaquin Valley which experienced rapid population growth in the previous decade.
Figure 1 California population by zip code tabulation area, 2000.
Overall for the state of California in 1999 (excluding Kaiser Hospitals, Shriners Hospitals and all records with missing charges), COPD accounted for 276,733 cases (7.3%) of a total database of 3,775,711 discharges, at a cost of $23,571.65 per COPD case. shows descriptive information for salient measures used in this analysis.
Table 1. Descriptive decile analysis of California ZCTAs, 1999
Highest decile values, defined by either total COPD hospitalization counts or charges, were compared to the values for all other deciles (). By either definition, trends were similar for the highest decile, indicating approximately three times as many tobacco outlets per ZCTA and higher percentages of daily smokers. Highest decile ZCTAs were found to have significantly lower socioeconomic status as indicated by education levels and median family income. Minority and foreign-born groups were overrepresented in the highest decile areas.
Geographic distribution of COPD
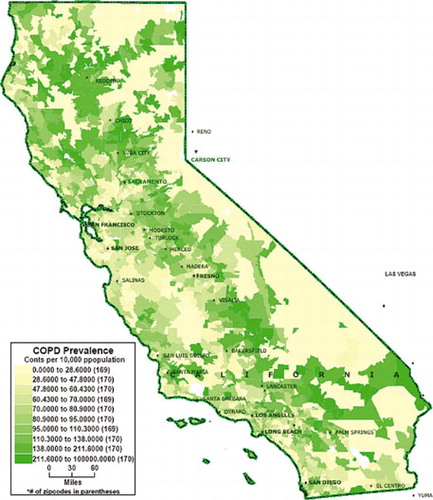
In , where a population density correction is given for COPD hospitalization rates (counts per 100,000), COPD is notably elevated in rural areas compared to urban areas. This map of ZCTAs using hospital discharge data [Citation[12]], shows that the central valley of California and the north of California reported much higher levels of COPD than coastal and large urban areas such as Los Angeles and the San Francisco Bay Area.
Figure 2 Prevalence of COPD using hospital discharge data count information.
Spatial model
Approximately 1707 ZCTAs were found to have useable data; for some analyses, there were slightly fewer ZCTAs. Correlation coefficients are shown in for a selection of variables with relatively low correlation (Pearson's R below 0.70). For highly correlated variables, one of the measures compared was selected for inclusion in further analyses. The relationship between COPD counts and a variety of sociodemographic variables, smoking and tobacco outlet information, controlling for spatial auto-correlation, is shown in , column 1. Positive relationships were found for percentage age greater than 45, percentage Hispanic and the tobacco use measures. Negative relationships were found for percentage college graduates and median family income, i.e., the socioeconomic measures. The pseudo R-square (variance reduction) was approximately 0.84 and the maximum likelihood (ML) estimate of spatial autocorrelation was a moderate 0.41.
Table 2. Correlations between selected measures
Table 3. Spatial modeling of COPD measures for California, 1999
Hotspot analysis
Residuals were identified that were more than two standard deviations from the model-based expectancy, using a Cook's distance calculation of T > = 1.65 or T < = −1.65. There were 100 “hotspots” (T > = 1.65) based on hospitalization charges and 143 derived from hospitalization counts. Smaller ZCTAs have much higher populations than do larger ZCTAs. In this regard, the physical size of a ZCTA is not representative of its possible effect, both when modeling and at the public health level. presents a comparison of model-identified hotspots across a variety of measures, similar to the decile analysis. However, contrary to the decile analysis, there are clear differences between the two types of hotspots. It appears that COPD hospitalization charges better represent the distribution of COPD disease than does the count measure. For instance, count-based hotspots, when corrected for population density, actually show lower hospitalization rates and costs. In addition, differences in minority and foreign-born percentages as well as socioeconomic levels are more striking in the charge-related hotspots. Of significant interest is the difference between the tobacco outlets measure for count-based versus charges-related hotspots. The three-fold difference in tobacco outlets for hotspots versus non-hotspots vanishes for the count-related measure.
Table 4. Analysis of model-identified hotspot ZCTAs in California, 1999
A preponderance of hotspots for COPD hospitalization charges are clustered in the Los Angeles (LA) area, in contrast to the San Francisco Bay Area (), although the two areas have quite similar urban density and population heterogeneity. There are markedly more ZCTAs in the Bay Area that have lower than expected (model-based) COPD hospitalization charges (“coldspots”), compared to the LA area. Given these large differences in COPD hospitalization charge hotspots between the Bay Area and LA, we subsequently examined differences between these regions for a variety of socioeconomic variables (). Not surprisingly, the Bay Area had a much higher median family income, and higher percentage of high school and college graduates. LA had higher percentages of Hispanic and foreign-born residents. It should also be pointed out that LA had both higher COPD measures (rates and per capita charges) and tobacco use measures.
Figure 3 ZCTA hotspots for higher than expected COPD charges, 1999.
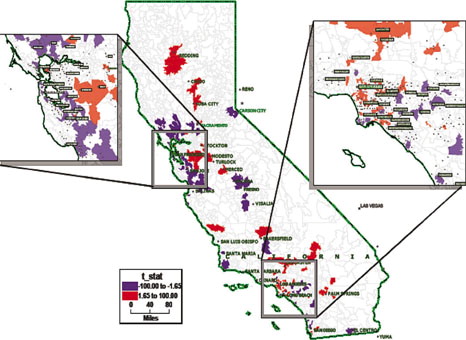
Table 5. Comparison of San Francisco Bay Area and Los Angeles Area ZCTAs, 1999
Air pollution analysis
Differences in particulate matter pollution between each region were examined descriptively. represents the varying PM-10 levels in the 151 air monitoring stations throughout the state. We investigated differences in exceedances of the State of California 24-hour PM-10 standard throughout 1999. We found 12 air monitoring stations in the San Francisco Bay Metropolitan Statistical Area averaged 19 days of exceedance, while 9 stations in the Los Angeles MSA (South Coast air district) averaged 122 days. This approximately seven-fold difference for LA is also evident with the individual stations that recorded the most 24-hour exceedances throughout the year (222 days in Los Angeles and 36 in the Bay Area). Further, the eastern side of the San Joaquin Valley, which includes the cities of Fresno and Bakersfield, also had high numbers of PM-10 standard exceedance.
Figure 4 Total particulate matter (PM-10) exceedances for California monitoring sites in 1999.
DISCUSSION
There were large differences in COPD hospitalization rates and COPD-related hospitalization charges throughout California ZCTAs in 1999. Geography matters in this analysis, both descriptively and analytically (using parametric modeling). Rural areas were much more likely to have higher levels both of COPD hospitalization rates and hospitalization charges than dense urban areas such as Los Angeles and the San Francisco Bay Area. Further, those places with higher levels of COPD were more likely to have significantly lower average incomes and percentages of college graduates. Those ZCTAs identified as higher (than model-based expectancies) for COPD hospitalization charges had significant increases in COPD measures relative to non-hotspots. The differences found across ZCTAs for hospitalization charges were also in line with significant differences in sociodemographic and smoking measures. This was true as well for descriptive analyses focusing on deciles. Given that these ZCTAs had lower education and median income, there is cause for concern regarding the excessive financial burden of COPD experienced.
Further, we found that spatial autocorrelation was important in this analysis. Moderate spatial autocorrelation, as measured by Moran's I coefficient of 0.41, indicates that a non-spatial parametric analysis would have most probably resulted in a reduced ability to identify the influence of important sociodemographic and smoking-related covariates (on COPD hospitalization counts). The fact that we found a negative/inverse relationship, when modeling, between median family income, education and COPD hospitalization counts, while identifying a positive relationship for percentage Hispanic, further points out how class and ethnicity may merit further scrutiny. The positive association found for number of tobacco outlets and percentage smoking, while in some respects expected, is also of interest because of the lag involved in COPD development. Perhaps there is some dynamic of smoking tolerance/support that exists in areas where smoking is more prevalent (in terms of tobacco outlets and percentage smoking). Outlets and smoking prevalence may also be a marker for other sociodemographic conditions associated with COPD.
When examining model-based outcomes and residual hotspots, compared to highest decile ZCTA analysis, there were marked differences and similarities. Median family income and education level were significantly lower both in hotspot areas and highest decile areas. The consistency of the income and education measures, two of the more important measures for socioeconomic status (SES), should be noted. Traditionally underserved groups were overrepresented in the charges-related hotspots and both deciles measures, but this trend was less strong for the count-based hotspots. The lack of a difference in tobacco outlets in the count-based hotspots is an artifact of the rural nature of many of these areas. Rural areas, which comprise a great many of the hotspot ZCTAs, have a markedly less dense distribution of tobacco outlets compared to urban areas. COPD count hotspots apparently fail to coherently distinguish hotspots and non-hotspots with respect to tobacco outlets. Conversely, COPD hotspots based on hospitalization charges appear to distinguish spatial differences more accurately than COPD counts. This is probably due to the fact that hospitalization charges better differentiate the range of severity of COPD, whereas counts register the occurrence independent of severity.
The differences between hotspot and decile analysis could be explained by the fact that we controlled for many variables when identifying hotspots. The decile analysis was based on simple tabular analysis that did not control for important SES, smoking and tobacco outlet information, as well as spatial autocorrelation. Thus, it is necessary to understand the limitations of the “descriptive” decile approach when assessing its relevance to the public health issue at hand.
The somewhat surprising differences in COPD hotspots found for the Los Angeles area compared to all other large urban areas of California prompted our comparison with the San Francisco Bay Area. The latter area is also a very densely populated region with approximately similar population characteristics. Nevertheless, given such crude similarity, there were many differences found between the Bay Area and Los Angeles. Median income and college education are significantly higher in the Bay Area. Differences in air contaminant levels may also help to distinguish between regions. This result is more suggestive than confirmatory, however, because air pollution information was not, due to metric differences and relatively sparse data, included in the model-based analysis. Further examination may be useful [Citation[2]] to better understand relationships between COPD, smoking, and air pollution in parts of the Los Angeles basin and the eastern side of the San Joaquin Valley in central California. These areas have elevated rates of COPD hospitalization as well as some of the worst particulate air pollution in the country. The rapidly increasing population in the San Joaquin Valley in combination with relatively high levels of COPD and high levels of particulate pollution, seen in , may be a particular area of concern in the future.
A major limitation of the present analysis requires mention. Specifically, this study relies on a cross-sectional analysis of relationships between COPD and other factors. We are thus limited in our ability to determine etiological relationships between COPD and other measures. We do not have the ability to see changes over time or to assess how exposure may result in a specific outcome. This is particularly true for diseases such as COPD that have relatively long apparent lags between exposure and disease. Given the complexity of COPD etiology this analysis should be seen as helping to direct future research that is more longitudinal in nature.
The current study suggests that geography (as evidenced here by significant spatial autocorrelation) is a factor when examining the relationship between socioeconomic/demographic measures, smoking, COPD rates and related charges. The higher levels of COPD hospitalization counts in ZCTAs with relatively lower income and education as well as higher percentages of people of color and immigrants is cause for concern.
The research presented here has implications for disease prevention. Apparent linkages between COPD and environmental factors support policy-based approaches to reduce tobacco access. From a social justice perspective, the over-concentration of hotspots in poor and minority neighborhoods is a matter of significant concern. Prevention efforts should be targeted at these impacted areas as a cost-effective means of allocating scarce resources.
ACKNOWLEDGMENTS
Research is supported by the California Tobacco Related Disease Research Program, Grant #11RT-0093. The views expressed are those of the authors and do not necessarily represent those of the Office of Environmental Health Hazard Assessment, the California Environmental Protection Agency, or the State of California.
Research is supported by the California Tobacco Related Disease Research Program, Grant #11RT-0093.
REFERENCES
- Halpern M T, Stanford R H, Borker R. The burden of COPD in the U.S.A.: results from the Confronting COPD survey. Respir Med 2003; 97: S81–S89, suppl C[CSA]
- Sunyer J. Urban air pollution and chronic obstructive pulmonary disease: a review. Eur Respir J 2001; 17: 1024–1033, [CSA]
- Sobradillo Peña V, Miravitlles M, Gabriel R, Jiménez-Ruiz C A, Villasante C, Fernándo Masa J, Viejo J L, Fernández-Fau L. Geographic variations in prevalence and underdiagnosis of COPD: results of the IBERPOC multicentre epidemiological study. Chest 2000; 118: 981–989, [CSA]
- September, 2004, http://www.oshpd.cahwnet.gov/HID/MIRCal/index.htm (accessed)
- Sunyer J, Basagana X. Particles, and not gases, are associated with the risk of death in patients with chronic obstructive pulmonary disease. Int J Epidemiol 2001; 30: 1138–1140, [CSA]
- Cliff A D, Ord J K. Spatial Processes: Models and Applications. Pion Ltd, London 1982
- Griffith D A. Advanced Spatial Statistics. Kluwer, Dordrecht 1988
- Gruenewald P J, Millar A B, Roeper P. Access to alcohol: geography and prevention for local communities. Alcohol Health Res World 1996; 20: 244–251, [CSA]
- Gruenewald P J, Stockwell T, Beel A, Dyskin E V. Beverage sales and drinking and driving: the role of on-premise drinking places. J Stud Alcohol 1999; 60: 47–53, [CSA]
- Moran P AP. The interpretation of statistical maps. JR Stat Soc B (Methodological) 1948; 10(2)243–251, [CSA]
- Ponicki W R, Gruenewald P J. S3: Spatial Statistical System (version 4.0). Prevention Research Center, Berkeley, CA 1998
- Rushton G, Lolonis P. Exploratory spatial analysis of birth defect rates in an urban area. Stat Med 1996; 15: 717–726, [CSA]