Abstract
There are currently no blood tests to identify the majority of smokers at risk for chronic obstructive pulmonary disease (COPD). We used plasma protein profiles from surface enhanced laser desorption/ionization (SELDI) time-of-flight mass spectrometry to identify a panel of protein biomarkers that can distinguish patients with COPD from closely matched controls. Plasma was obtained from 30 COPD subjects and 30 controls matched for age, sex, and smoking history. Plasma protein profiles were generated using Cum2+-immobilized metal affinity capture (IMAC) and strong anion exchanger (Q10) protein chips. Classification and regression tree (CART) analysis identified a panel of 5 biomarkers using the IMAC protein chip that could distinguish COPD patients from controls with sensitivity and specificity of 91.67% and 88.33%, respectively. The 10-fold cross-validation yielded 81.67% sensitivity and 81.67% specificity. This demonstrates the feasibility of using SELDI as a diagnostic test for COPD; however, larger cohorts will be needed to validate these biomarkers and determine their predictive value longitudinally.
Key words:
INTRODUCTION
Chronic Obstructive Pulmonary Disease (COPD) has been estimated to affect over 10 million Americans and is the fourth leading cause of death [Citation[1]]. In 1993, the direct medical costs of COPD were estimated to be 14.7 billion and the indirect costs estimated to be 9.2 billion for a total of 23.9 billion dollars [Citation[2]]. Ninety percent of COPD patients have smoked, yet, depending how COPD is defined, only 15 to 40% of smokers eventually develop COPD. The only clinically available blood test to determine whether or not a smoker is at high risk for developing COPD is the α1-antitrypsin (AAT) protein level and phenotype; however, only 3–4% of COPD patients are AAT deficient [Citation[3], Citation[4], Citation[5]]. Thus, there is currently no clinically available blood test to identify over 95% of COPD patients, and since extensive evidence suggests that COPD is a polygenic disease, all assays that determine only a single biomarker (e.g., ELISA) will have poor test characteristics (sensitivity and specificity) when applied to a heterogeneous population of COPD patients. The lack of blood tests to identify the vast majority of smokers who are at high risk for developing COPD is a major limitation to both understanding the pathogenesis of COPD and to devising clinical trials designed to modify the natural history of COPD. Thus for COPD prediction, a test consisting of multiple markers (proteins/peaks) may be advantageous because of the heterogeneous mechanisms of COPD.
In recent years there have been significant advances in both biomarker identification and bioinformatics that allow research to overcome these limitations. One of the most significant advances in biomarker identification has been mass spectrometry (MS) and proteomics. Using MS, it is now practical to simultaneously analyze hundreds of proteins from a single sample. Other proteomics approaches include: 2-dimensional gel electrophoresis (2DE), Multi-Dimensional Protein Identification Technology (MuD-PIT), matrix assisted laser desorption/ionization time of flight mass spectrometry (MALDI MS) profiling, and protein microarrays; however, many of these techniques are not well suited for identifying novel biomarkers using high throughput quantitative screening. Other new high throughput, quantitative mass spectrometry techniques include: ICAT (isotope-coded affinity tag), iTRAQ (iTracking for Relative and Absolute Protein Quantitation), and SILAC (stable isotope labeling with amino acids in cell culture); however, none of these has yet become mainstream. Recent developments in surface enhanced desorption/ionization time-of-flight mass spectrometry (SELDI-TOF-MS) have overcome some of these limitations. SELDI-TOF-MS rapidly quantifies relative amounts of hundreds of proteins in a complex biologic sample by relying on rapid separation of a complex mixture of proteins and high throughput mass spectrometry. SELDI has been successfully used to identify patients with cancers such as ovarian cancer [Citation[6], Citation[7]], prostate cancer [Citation[8]], bladder carcinoma [Citation[9]], lung cancer [Citation[10]] and nonmalignant diseases such as urolithiasis [Citation[11]] and cirrhosis [Citation[12]], but has not been used to study patients with COPD. One of the major challenges with SELDI is analyzing the hundreds to thousands of data points generated by protein profiling.
The second major area of advancement is bioinformatics and addresses the problem of interpreting the large amounts of data generated by SELDI. In particular, new methods such as classification and regression trees (CART) have been developed to identify panels of biomarkers that can be used to classify a sample into different groups. These approaches overcome the limitation of using only a single biomarker such as AAT. CART is a particularly useful method because it can produce accurate classifications based on a few simple rules. For instance, for lung volume reduction surgery, a patient with upper lobe predominant emphysema and low-exercise tolerance would be categorized as good surgical candidate, a patient with non upper lobe emphysema and high tolerance would be poor surgical candidate, and other groups would be intermediate surgical candidates [Citation[13]]. Thus, CART method can be used to produce decision trees that contain the most relevant information and are easy to interpret and implement. In the current investigation, we used a SELDI-TOF-MS approach coupled with CART analysis to identify a panel of protein markers that could distinguish smokers who developed COPD from matched smokers who did not.
MATERIAL AND METHODS
Subjects
All subjects were studied under protocols approved by the Institutional Review Board at the National Jewish Medical and Research Center with guidelines recommended by the National Institutes of Health. Signed informed consent was obtained for all subjects. Patients with COPD (n = 30) were recruited from an outpatient pulmonary clinic. The diagnosis of COPD was made using GOLD criteria [Citation[14]]. Control subjects (n = 30) were healthy volunteers with normal spirometry and were matched for age, sex, and smoking history (). The two groups were significantly different in percent-predicted forced expiratory volume at one second (FEV1) (COPD: Mean ± SD, 40.3 ± 14.5%, no COPD: 84.8 ± 25.4%, p < 0.0001). The percent predicted FEV1 represents the maximum volume of air expired one second after the onset of full expiration compared to that predicted for one's age, sex, and race.
Table 1 Demographics and lung function
Blood collection
Six ml of blood was withdrawn from the antecubital vein into a sterile 13 × 1000 mm sodium heparin Vacutainer Plus (BD, New Jersey). The sample was immediately spun at 2100 × g for 10 minutes at room temperature. One-sixth of a tablet of complete, mini, EDTA free protease inhibitor (Roche) was added to each 1 ml of plasma and then vortexed until the tablet dissolved. Plasma aliquots were then kept at −70°C for less than 1 year.
Plasma fractionation
Twenty μ l of each sample was fractionated according to the instructions using the Expression Difference Mapping Kit (Ciphergen, Freemont, California). All procedures were performed at room temperature unless indicated. Two hundred μ l of rehydration buffer (50 mM Tris-HCl, ph 9) was added to a 96-well plate of Q HyperD F beads filtration plate (Ciphergen). A vacuum was used to gently remove the buffer. Rehydration buffer was then applied three times with vacuum in between. Thirty μ l of U9 buffer (9 M urea, 2% CHAPS, 50 mM Tris-HCl, pH 9) was added to 20 μ l plasma in a standard 96-well v-bottom microplate and mixed for 20 minutes at 4°C. Subsequently there were 3 washes with U1 buffer (10 ml of U9 buffer to 80 ml rehydration buffer) on the filtration plate. Fifty μ l of the plasma/U9 solution was applied to each well of the filtration plate followed by 50 μ l of U1 buffer. The filtration plate was then mixed for 30 minutes at 4°C. Fractions 1–6 were then collected in order by adding 100 μ l of wash buffer (50 mM HEPES with 0.1% OGP) (), mixing for 10 minutes, and then placing a 96-well plate under the filtration plate and applying vacuum for each fractionation step.
Table 2 Fractionation conditions
SELDI analysis
Eight-well Q10 (strong anion exchanger) and Cu2+-IMAC30 (immobilized metal affinity capture) protein chips were prepared as recommend by the manufacturer (Ciphergen). To reduce the cost of the analysis (i.e., number of protein chips required), we limited the analysis to fraction 4, which had the many distinct peaks not present on other chips (data not shown). Thirty μ l of fraction 4 (pH 4–5) was mixed with 30 μ l of HEPES 50 mM, pH 7.0 and applied to protein chips. Each sample was applied in duplicate in a random position of the protein chip array. A Biomek2000 liquid robot (Beckman Coulter, Fullerton, California) was used for all washing steps. After air-drying samples, 1 μ l of SPA solution (sinapinic acid 5 mg with 200 μ l of 1% trifluroacetic acid and 200 μ l of acetonitrile) was applied to each spot and allowed to air dry for 5 minutes at which time a second application of SPA was made to each spot. Samples were analyzed at high and low laser intensities using a PBS IIc with autoloader (Ciphergen) using the following settings: mass optimized from 2000 Da to 20,000 Da, intensity 180 for low and 190 for high, sensitivity 9, 210 total shots. Molecular weights were calibrated externally each day using the All-In-1 Peptide Standard (Ciphergen). Spectra were normalized by total ion current with baseline subtraction via the Ciphergen ProteinChip Software v3.1 (Ciphergen). Peaks were identified using an autodetect mode with a signal/noise (first pass): 4, minimum peak threshold: 10%, mass error: 0.3%, and signal/noise (second pass): 2 for the 2–20 kd mass range and signal/noise (first pass): 5, minimum peak threshold: 10%, mass error: 0.3%, and signal/noise (second pass): 2 for the 20–100 kd mass range. After peak autodetection all spectra were subsequently inspected visually for completeness by a technician blinding to sample group. Biomarker Wizard (Ciphergen) was used to generate consistent peak sets (clusters) across multiple spectra. This cluster analysis allows all the subjects to have the same mass for each peak enabling statistical data analyses. Masses less than 20,000 Da from the low laser experiment and greater than or equal to 20,000 Da from the high laser experiment are combined to create the final joint file. The newly formed peak masses and peak intensities were exported to the Ciphergen Biomarker Patterns Software, v5.0.2 (Ciphergen) for classification and regression tree (CART) analysis.
Classification And Regression Tree (CART) analysis
The purpose of CART is to learn how one can discrimate among different “classifications” using a hierachical decision tree with “if-then” decision nodes. CART methods have several advantages including simple interpretation of decision trees, much simpler modeling, and lack of implicit assumptions regarding the relationship among predictor variables. Thus CART methods are well-suited for data mining. Disadvantages to the CART approach are that solutions are not unique (i.e., different biomarkers may be identified depending on computational strategies) and computational details to constructing such trees are quite complex. For a better understanding of computational strategies used to construct CART, the reader is referred to Brieman et al. [Citation[15]].
The target (dependent) variable was the group status (COPD or no COPD). All the peak intensities were considered as predictor (independent) variables. Since the target variable is categorical, we built classification trees. Gini is the most common splitting function in CART, but when the target variable is binary and there is no preference on even splits, Gini, Symmetric Gini, Twoing, and Ordered Twoing produce identical results. We also considered other splitting functions such as Entropy and Class Probability. For building our classification trees, we assumed equal prior on the target variable and no penalties on predictor variables. For selecting the optimal tree, we considered the tree with the minimum cost (lowest misclassification rate) and the best prediction rates (sensitivity and specificity) via 10-fold cross-validation. We built trees with all the peak intensities as predictor variables and without automatic best predictor discovery on. Subsequently, automatic best predictor discovery was on and selected different predictors based on their predictor importance. In all attempts, Gini with no preference on even splits yielded the best cost.
CART is a reiterative process in which many variations of data analysis are tried to obtain the best (low-cost) tree. In search of best candidates for predictors, i.e., biomarkers, first we tried to find differentially expressed proteins (or peptides) between the two groups using the joint data set described in the SELDI Analysis section. If there was none after applying an appropriate test and false discovery rate, then, we ran CART to each of the three data sets, low laser, high laser and the joint, separately. All the peaks were included as predictor variables. CART does an exhaustive search of all possibilities to identify best splitting variables and grade them. Each CART analysis was associated with a Receiver Operating Characteristic (ROC) curve. The ROC is a plot of sensitivity by (1 – specificity) for a binary classifier system as its discrimination threshold is varied. The ROC can also be represented equivalently by plotting the true positives vs. the false positives. ROC curves are used to evaluate the results of a prediction and the best possible prediction rule would yield a graph that was a point in the upper left corner, i.e., 100% sensitivity and 100% specificity. A completely random predictor would give a straight line at an angle of 45 degrees from the horizontal axis, from bottom left corner to the top right corner. The area under the ROC curve is a common index used to summarize the information contained in the curve, where 1 being the perfect (i.e., 100% sensitivity and 100% specificity) diagnostic test.
RESULTS
Peak quantitation
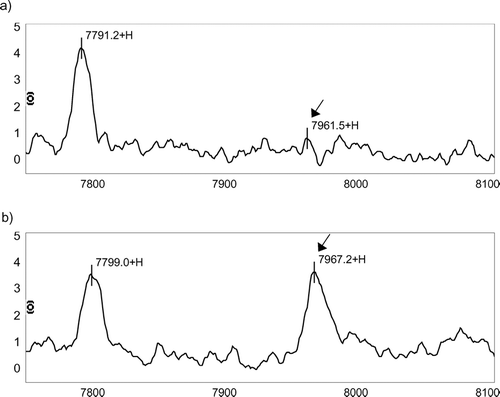
We quantified 54 peaks with masses ranging from 3,341.86 Da to 147,070 Da using the IMAC chip and 94 peaks with masses ranging from 2,745.25 Da to 154,823 Da using the q10 chip. The coefficients of variation (CV) among duplicate samples were 36.6% for IMAC chips and 68.7% for q10 chips, slightly higher than the intralaboratory coefficient of variation published by other investigators [Citation[16]]. There were noticeable differences in protein profiling between individuals (); however, there were no statistically significant individual protein expression differences between groups.
Figure 1 Differences in IMAC protein chip profile between a COPD patient and a well matched control. (a) A 52-year-old, 108 pack-year man with COPD (FEV1 = 53% predicted) and (b) a 52-year-old, 105 pack-year man with normal airflow. The arrows demonstrate that the intensity of the protein with m/z peak at 7961.19 Da is noticeably lower in the patient with COPD. There were no visible differences in other peaks such as that of 7794.57 Da. The x-axis represents the m/z ratio from 7750–8100 Da. The y-axis shows peak intensities normalized for total ion current and corrected with baseline subtraction.
CART analysis
CART decision algorithms contained both decision nodes and terminal nodes. Decision nodes were hierarchical and based on relative single peak intensities. Terminal nodes were used to determine whether a subject was in a COPD or no COPD group. Each tree has M decision nodes and M + 1 terminal nodes (). The cost of a tree was based on the accuracy of classification (COPD or no COPD) and the number of nodes. Optimal trees were those with the lowest cost and typically have 5–10 decision nodes.
Figure 2 Best classification tree using IMAC F4 data. There are 5 peaks, which were used to construct the tree (8,170.82 Da, 17,397.9 Da, 7,961.19 Da, 6,975.67 Da, and 9,446.12 Da.). There are 7 nodes because 7,961.19 Da and 6,975.67 Da have double splits. Each node is sequentially labeled and shows splitting criteria. For instance, M8170_82 ≤ 1.586 would mean that subjects with peak intensities of ≤ 1.586 at m/z ratio at 8170.82 Da would move down the left side and all other subjects would move down the right side. A misclassification is defined when after “dropping” a case down a tree (i.e. following the classification rules of a tree), the case is misclassified as COPD when it is a control or control when it is COPD. Subjects continue down the tree until they reach terminal nodes. The number of samples that are at each node is given for both COPD and control (no COPD) groups. A terminal node is classified as COPD if the majority of samples are in the terminal node are from COPD patients. Otherwise the terminal node is classified as control (no COPD). Note that all subjects had protein chips run in duplicate so that the total number of samples is 120. Validation of sensitivity and specificity of the tree is done by “dropping” unknown samples down the tree and determining the percentage that are correctly classified.
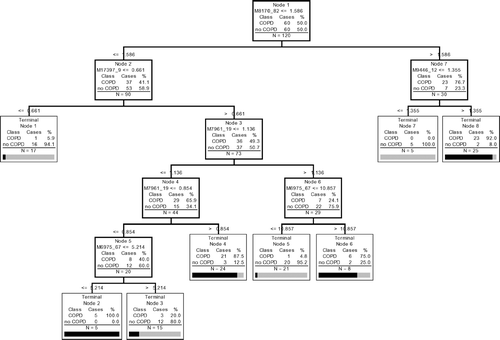
Using the IMAQ30 data sets (low laser, high laser, and combined high and low laser) we selected the best 8 peaks from each data set based on their importance scores and compared their masses. Many of the splitters were common (same or similar mass) across the three data sets yielding a manageable size of 12 peaks. These 12 peaks were chosen because they consistently were identified as biomarkers using the CART approach. We explored the 12 peaks using the joint IMAC F4 data set, and were able to find a subset, which yielded the best classification and the best prediction results via 10-fold cross validation. Using these same techniques, we were unable to identify a reproducible set of biomarkers using the Q10 data set. The lowest cost tree using the IMAC chip was 0.367 and had a panel of 5 biomarkers and 7 decision nodes (). The lowest cost tree using the q10 chips was 0.600. The sensitivity and specificity of the optimal classification tree () using the IMAC chip was 91.67% and 88.33%, respectively. Ten-fold cross-validation yielded 81.67% sensitivity and 81.67% specificity. The receiver operating characteristic (ROC) curve is presented in . Although optimal CART had good sensitivity and specificity, none of the individual biomarkers was individually statistically significant between groups (). Graphical representation of all 5 biomarkers simultaneous is impossible since this would require 5 dimensional space; however, graphical representation of branches of the tree is possible using 2-dimensional space (). contains intensity levels for peaks at 8170.82 Da and 17,397.9 Da for all the subjects and their duplicates. These are split into 3 regions according to the decision rules in Node 1 and Node 2 in . contains 73 points from Node 3 in and . These 73 points are split further into 5 regions based on their intensity levels at 7961.19 Da and 6975.67 Da. contains 30 points from Node 7 in and . They are split in 2 according to their intensity levels at 9,446.12 Da.
Figure 3 Minimum cost curves used to identify the number of nodes required to obtain a tree with the lowest cost. The x-axis represents trees with 1-11 terminal nodes and the y-axis shows relative cost assuming that there is an equal penalty for misclassifying both COPD subjects and controls.
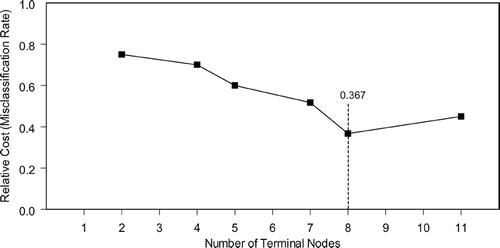
Figure 4 Receiver Operating Characteristic (ROC) curve of the tree shown in . The area under the ROC curve is 0.932.
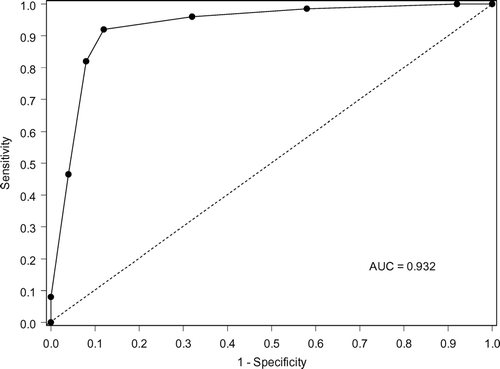
Figure 5 2-dimensional representation of the multidimensional data from CART shown in . (a) The root node, which is Node 1 in , contains all the subjects and their duplicates. They are split in two, left region (Node 2 in ) and right region (Node 7) with respect to the vertical line at intensity = 1.586 at 8170.82 Da. For the subjects in the left region, if their intensities at 17,397.9 are less than or equal to 0.661, they are classified as Terminal Node 1, no COPD. (b) If their intensities at 17,397.9 are greater than 0.661 (Node 3), they are further split in b with intensity levels at 7961.19 Da and 6975.67 Da. (c) The subjects on the right rectangle (Node 7) are further divided in two with the intensity level at 9,446.12 Da. A control subject is indicated by a cross (x) and a COPD subject indicated by a circle (o). (Continued)
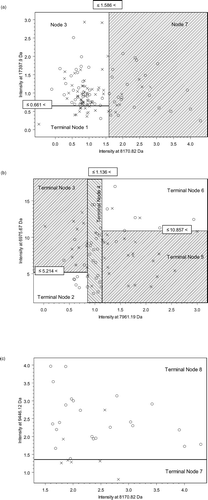
Table 3 Mean peak intensities of each member of the biomarker panel
DISCUSSION
This investigation demonstrates the feasibility of using a panel of plasma biomarkers generated by SELDI and selected by CART to distinguish a smoker with and without COPD. A distinct advantage of this approach is the sensitivity and specificity of the panel is superior to any single biomarker. The ability of a panel of protein biomarkers rather than a single biomarker to differentiate COPD patients from controls is in concordance with a preponderance of genetic studies which have shown that there are multiple genetic risk factors (polymorphisms) that contribute to the risk of COPD, yet no single gene contributes significantly more than 5% of population attributable risk [Citation[17]]. In this investigation, using only 30 subjects and 30 controls, we were able to identify 5 protein peaks from mass ranging, 6.9 kDa to 17.4 kDa, that could achieve a 92% sensitivity and 88% specificity for categorizing smokers as having COPD or no COPD; however, only one of these proteins (8170 Da) came close to approaching statistical significance at a p < 0.05 level, although, under a multiple comparison procedure, the observed p-value is meaningless. This concept represents an important paradigm shift in the approach to clinical medicine and will be particularly advantageous for studying other multifactorial lung diseases such as asthma and interstitial lung disease. A biomarker panel approach can even be used to improve the performance of good single marker diagnostic tests. For instance, even though troponin is nearly a gold-standard blood test for myocardial infarction, its sensitivity and specificity are only 94% and 81% [Citation[18]].
While several quantitative assays and statistical approaches can be used to study a complex disease such as COPD, SELDI and CART have particular advantages that make them well suited to this investigation. The major advantages to SELDI technology are that it is much faster, is high throughput, requires orders of magnitude of lower amounts of starting sample, and has a sensitivity for detecting proteins in the picomole and attamole range. Compared to SELDI, Enzyme-Linked Immunosorbent Assay (ELISA) is also high throughput technique, but only quantitates known proteins and cannot detect abnormal proteolytic processing of proteins. For instance, extensive development of SELDI has been used to detect proteolytic processing of Alzheimer related proteins [Citation[19], Citation[20], Citation[21], Citation[22], Citation[23]]. Other techniques such as 2-dimensional gel electrophoresis can provide excellent information on post-translational modifications [Citation[24]], but are expensive and not well suited to high-throughput studies.
SELDI does, however, share a technical limitation that is inherent in all proteomic approaches: the ability to only investigate a fraction of the proteome. For instance, because the complexity of unfractionated plasma (> 10, 000 proteins) will overwhelm the sensitivity of most mass spectrometry detectors, we chose to use two fractionation steps of our plasma samples. The first fractionation step used acid based chromatography to split the sample into acid, basic and organic fractions. Unfortunately economic limitations did not permit us to separately analyze all 6 fractions, thus we may have missed identifying plasma biomarkers that were not present in fraction 4. The second fractionation step used surface chromatography to select only proteins that would bind either an anion exchange or a metal binding surface. Although all the protein chip experiments were performed at the same time, we were only able to identify a panel of biomarkers using the IMAC30 chip. The higher CV for the Q10 chips may explain this difference, although the reason for the higher CV is unknown.
Other possible explanations for why no biomarkers were identified using the q10 chip include: that there are no biomarkers in this subset of proteins; there were insufficient numbers of subjects studied; or experimental error (chip manufacture, buffers, etc.). This study highlights the fact that all proteomic technologies and proteomic studies are imperfect in that they only identify a subset of proteins in the proteome. It remains to be shown whether other subsets of plasma proteins also have predictive value in distinguishing COPD from non-COPD patients. Despite questions about validity of the SELDI technique [Citation[25]], recent publications [Citation[8], Citation[16]] have shown that the relative intensities of multiple peaks along the m/z range are consistent among the spectra from multiple laboratories if sample preparation treatment protocols and analytic instrument tuning are rigorously controlled. Thus, the proteomic profiles obtained in this investigation would not be expected to be significantly different if repeated in an independent laboratory.
We chose to use CART to analyze the SELDI protein profiles because CART is a non-parametric tree-building “machine-learning” method, where results are extremely easy to interpret [Citation[15]]. For instance, using the classification tree in , a person whose blood had an protein profile with intensity < 1.586 for protein the peak with m/z ratio 8170.82 and an intensity of < 0.661 for peak at m/z 17397.9 will most likely have normal spirometry (no COPD). Other strengths of the CART approach is that it is machine based and can be used to separate individuals in a multi dimensional space despite their nonlinear relationships, which is a difficult task for a parametric method such as a logistic multiple regression analysis. Machine based learning methods are required because of the large number of possible classification trees that can be created. For instance, there are 2k – 1 different ways to select a group of peaks as predictors, where k is the total number of peaks. Thus, 54 peaks yield 18,014,398,509,482,000 possible combinations. CART analysis exhaustively searches for the best splitter, one peak at a time. This complexity still does not take into account that one can choose multiple thresholds for each peak. Thus, choosing the best set of peaks that gives good classification and validation is both computationally intensive and requires exploratory techniques such as Gini and Twoing splitting methods. Other machine learning methods such as neural networks, genetic algorithms and support vector machines may be used, but are not as easy to interpret [Citation[26], Citation[27], Citation[28], Citation[29]].
Although this pilot study demonstrates the capability of SELDI as a diagnostic test for COPD, substantial work remains before this becomes a clinical test. The next steps include validation of the SELDI protein profile in an independent laboratory and in larger populations. This approach has been successful used for detection of prostate cancer by the National Cancer Institutes Early Detection Research Network [Citation[8], Citation[30], Citation[31]]. Although it is not essential to know the identities of the protein biomarkers in order to serve as a useful clinical diagnostic tool, further identification of each protein peak will be essential in determining the biologic role of each biomarker in the COPD patient. Additionally, time will determine whether new immunodepletion techniques can improve detection of low abundance biomarkers by removing high abundance proteins such as albumin and immunoglobumin [Citation[32]]. Also, we recognize that plasma proteins may not completely reflect pathogenesis in the lungs; however, a blood test has the distinct advantage in that it is much less invasive compare to bronchoalveolar lavage or lung biopsy. Ultimately proof of the SELDI approach for diagnosing COPD will require prospective testing in a large, well-characterized cohort of healthy smokers who have been followed with periodic pulmonary function testing for years; however, this cohort does not yet exist in the United States.
ACKNOWLEDGMENTS
Supported by the Colorado Tobacco Research Program (R.P.B.) and the Flight Attendant Medical Research Institute (R.P.B.) and the Monfort Foundation (M.C.E.). We gratefully acknowledge the editorial skill of Elizabeth Regan, M.D.
REFERENCES
- Mannino D M, Homa D M, Akinbami L J, Ford E S, Redd S C. Chronic obstructive pulmonary disease surveillance–United States, 1971–2000. MMWR Surveill Summ 2002; 51(6)1–16, [CSA]
- Sullivan S D, Ramsey S D, Lee T A. The economic burden of COPD. Chest 2000; 117(2 Suppl)5S–9S, [PUBMED], [INFOTRIEVE], [CROSSREF], [CSA]
- Shigeoka J W, Hall W J, Hyde R W, Schwartz R H, Mudholkar G S, Speers D M, Lin C C. The prevalence of alpha-antitrypsin heterozygotes (Pi MZ) in patients with obstructive pulmonary disease. Am Rev Respir Dis 1976; 114(6)1077–1084, [PUBMED], [INFOTRIEVE], [CSA]
- Eriksson S. Studies in alpha 1-antitrypsin deficiency. Acta Med Scand Suppl 1965; 432: 1–85, [PUBMED], [INFOTRIEVE], [CSA]
- Lieberman J, Winter B, Sastre A. Alpha 1-antitrypsin Pi-types in 965 COPD patients. Chest 1986; 89(3)370–373, [PUBMED], [INFOTRIEVE], [CSA]
- Vlahou A, Schorge J O, Gregory B W, Coleman R L. Diagnosis of Ovarian Cancer Using Decision Tree Classification of Mass Spectral Data. J Biomed Biotechnol 2003; 2003(5)308–314, [PUBMED], [INFOTRIEVE], [CROSSREF], [CSA]
- Moshkovskii S A, Serebryakova M V, Kuteykin-Teplyakov K B, Tikhonova O V, Goufman E I, Zgoda V G, Taranets I N, Makarov O V, Archakov A I. Ovarian cancer marker of 11.7 kDa detected by proteomics is a serum amyloid A1. Proteomics, 2005
- Semmes O J, Feng Z, Adam B L, Banez L L, Bigbee W L, Campos D, Cazares L H, Chan D W, Grizzle W E, Izbicka E, Kagan J, Malik G, McLerran D, Moul J W, Partin A, Prasanna P, Rosenzweig J, Sokoll L J, Srivastava S, Srivastava S, Thompson I, Welsh M J, White N, Winget M, Yasui Y, Zhang Z, Zhu L. Evaluation of serum protein profiling by surface-enhanced laser desorption/ionization time-of-flight mass spectrometry for the detection of prostate cancer: I. Assessment of platform reproducibility. Clin Chem 2005; 51(1)102–112, [PUBMED], [INFOTRIEVE], [CROSSREF], [CSA]
- Liu W, Guan M, Wu D, Zhang Y, Wu Z, Xu M, Lu Y. Using tree analysis pattern and SELDI-TOF-MS to discriminate transitional cell carcinoma of the bladder cancer from noncancer patients. Eur Urol 2005; 47(4)456–462, [PUBMED], [INFOTRIEVE], [CROSSREF], [CSA]
- Yang S Y, Xiao X Y, Zhang W G, Zhang L J, Zhang W, Zhou B, Chen G, He D C. Application of serum SELDI proteomic patterns in diagnosis of lung cancer. BMC Cancer 2005; 5: 83, [PUBMED], [INFOTRIEVE], [CROSSREF], [CSA]
- Cadieux P A, Beiko D T, Watterson J D, Burton J P, Howard J C, Knudsen B E, Gan B S, McCormick J K, Chambers A F, Denstedt J D, Reid G. Surface-enhanced laser desorption/ionization-time of flight-mass spectrometry (SELDI-TOF-MS): a new proteomic urinary test for patients with urolithiasis. J Clin Lab Anal 2004; 18(3)170–175, [PUBMED], [INFOTRIEVE], [CROSSREF], [CSA]
- Zhu X D, Zhang W H, Li C L, Xu Y, Liang W J, Tien P. New serum biomarkers for detection of HBV-induced liver cirrhosis using SELDI protein chip technology. World J Gastroenterol 2004; 10(16)2327–2329, [PUBMED], [INFOTRIEVE], [CSA]
- Fishman A, Martinez F, Naunheim K, Piantadosi S, Wise R, Ries A, Weinmann G, Wood D E. A randomized trial comparing lung-volume-reduction surgery with medical therapy for severe emphysema. N Engl J Med 2003; 348(21)2059–2073, [PUBMED], [INFOTRIEVE], [CROSSREF], [CSA]
- Fabbri L M, Hurd S S. Global Strategy for the Diagnosis, Management and Prevention of COPD: 2003 update. Eur Respir J 2003; 22(1)1–2, [PUBMED], [INFOTRIEVE], [CROSSREF], [CSA]
- Breiman L. Classification and regression trees. The Wadsworth statistics/probability series, Wadsworth International Group, Belmont, Calif 1984
- Rai A J, Stemmer P M, Zhang Z, Adam B L, Morgan W T, Caffrey R E, Podust V N, Patel M, Lim L Y, Shipulina N V, Chan D W, Semmes O J, Leung H C. Analysis of Human Proteome Organization Plasma Proteome Project (HUPO PPP) reference specimens using surface enhanced laser desorption/ionization-time of flight (SELDI-TOF) mass spectrometry: Multi-institution correlation of spectra and identification of biomarkers. Proteomics 2005; 5(13)3467–3474, [PUBMED], [INFOTRIEVE], [CROSSREF], [CSA]
- Hersh C P, Demeo D L, Lange C, Litonjua A A, Reilly J J, Kwiatkowski D, Laird N, Sylvia J S, Sparrow D, Speizer F E, Weiss S T, Silverman E K. Attempted replication of reported chronic obstructive pulmonary disease candidate gene associations. Am J Respir Cell Mol Biol 2005; 33(1)71–78, [PUBMED], [INFOTRIEVE], [CROSSREF], [CSA]
- Ross G, Bever F N, Uddin Z, Hockman E M. Troponin I sensitivity and specificity for the diagnosis of acute myocardial infarction. J Am Osteopath Assoc 2000; 100(1)29–32, [PUBMED], [INFOTRIEVE], [CSA]
- Carrette O, Demalte I, Scherl A, Yalkinoglu O, Corthals G, Burkhard P, Hochstrasser D F, Sanchez J C. A panel of cerebrospinal fluid potential biomarkers for the diagnosis of Alzheimer's disease. Proteomics 2003; 3(8)1486–1494, [PUBMED], [INFOTRIEVE], [CROSSREF], [CSA]
- Lewczuk P, Esselmann H, Groemer T W, Bibl M, Maler J M, Steinacker P, Otto M, Kornhuber J, Wiltfang J. Amyloid beta peptides in cerebrospinal fluid as profiled with surface enhanced laser desorption/ionization time-of-flight mass spectrometry: evidence of novel biomarkers in Alzheimer's disease. Biol Psychiatry 2004; 55(5)524–530, [PUBMED], [INFOTRIEVE], [CROSSREF], [CSA]
- Vehmas A K, Borchelt D R, Price D L, McCarthy D, Wills-Karp M, Peper M J, Rudow G, Luyinbazi J, Siew L T, Troncoso J C. beta-Amyloid peptide vaccination results in marked changes in serum and brain Abeta levels in APPswe/PS1DeltaE9 mice, as detected by SELDI-TOF-based ProteinChip technology. DNA Cell Biol 2001; 20(11)713–721, [PUBMED], [INFOTRIEVE], [CROSSREF], [CSA]
- Lewczuk P, Esselmann H, Meyer M, Wollscheid V, Neumann M, Otto M, Maler J M, Ruther E, Kornhuber J, Wiltfang J. The amyloid-beta (Abeta) peptide pattern in cerebrospinal fluid in Alzheimer's disease: evidence of a novel carboxyterminally elongated Abeta peptide. Rapid Commun Mass Spectrom 2003; 17(12)1291–1296, [PUBMED], [INFOTRIEVE], [CROSSREF], [CSA]
- Davies H, Lomas L, Austen B. Profiling of amyloid beta peptide variants using SELDI Protein Chip arrays. Biotechniques 1999; 27(6)1258–1261, [PUBMED], [INFOTRIEVE], [CSA]
- Bowler R P, Duda B, Chan E D, Enghild J J, Ware L B, Matthay M A, Duncan M W. Proteomic analysis of pulmonary edema fluid and plasma in patients with acute lung injury. Am J Physiol Lung Cell Mol Physiol 2004; 286(6)L1095–1104, [PUBMED], [INFOTRIEVE], [CROSSREF], [CSA]
- Baggerly K A, Morris J S, Coombes K R. Reproducibility of SELDI-TOF protein patterns in serum: comparing datasets from different experiments. Bioinformatics 2004; 20(5)777–785, [PUBMED], [INFOTRIEVE], [CROSSREF], [CSA]
- Ripley B D. Pattern recognition and neural networks. Cambridge University Press, Cambridge; New York 1996; 403
- Hand D J, Mannila H, Smyth P. Principles of data mining. Adaptive computation and machine learning. MIT Press, Cambridge, Mass. 2001
- Cristianini N, Shawe-Taylor J. An introduction to support vector machines: and other kernel-based learning methods. New York Cambridge University Press. 2000
- Orengo C, Jones D, Thornton J M. Bioinformatics: Genes, Proteins and Computers. Oxford, Oxford New York 2003
- Verma M, Wright G L, Jr., Hanash S M, Gopal-Srivastava R, Srivastava S. Proteomic approaches within the NCI early detection research network for the discovery and identification of cancer biomarkers. Ann NY Acad Sci 2001; 945: 103–115, [PUBMED], [INFOTRIEVE], [CSA]
- Grizzle W E, Semmes O J, Basler J, Izbicka E, Feng Z, Kagan J, Adam B L, Troyer D, Srivastava S, Thornquist M, Zhang Z, Thompson I M. The early detection research network surface-enhanced laser desorption and ionization prostate cancer detection study: A study in biomarker validation in genitourinary oncology. Urol Oncol 2004; 22(4)337–343, [PUBMED], [INFOTRIEVE], [CSA]
- Zolotarjova N, Martosella J, Nicol G, Bailey J, Boyes B E, Barrett W C. Differences among techniques for high-abundant protein depletion. Proteomics 2005; 5(13)3304–3313, [PUBMED], [INFOTRIEVE], [CROSSREF], [CSA]