
 ?Mathematical formulae have been encoded as MathML and are displayed in this HTML version using MathJax in order to improve their display. Uncheck the box to turn MathJax off. This feature requires Javascript. Click on a formula to zoom.
Abstract
Oxygen uptake slow component (sc) is associated with lactate accumulation, likely a contribution of poorly oxidative muscle fibers. We aimed to test the hypothesis that higher muscle tension during slow pedaling rates would yield more prominent
sc in healthy subjects, but not in COPD patients. Eight severe COPD patients and 8 age-matched healthy individuals performed 4 rest-heavy exercise transitions at 40 and 80 RPM. Work rates at the two cadences were balanced. Venous blood was sampled for measurement of lactate concentration at rest and every 2 minutes until the end of exercise.
kinetics were analyzed utilizing nonlinear regression.
phase II amplitudes at the two cadences were similar in both groups. In healthy individuals,
sc was steeper at 40 than 80 RPM (46.6 ± 12.0 vs. 29.5 ± 11.7 mL/min2, p = 0.002) but not in COPD patients (16.2 ± 14.7 vs. 13.3 ± 7.6 mL/min2). End-exercise lactate concentration did not differ between cadences in either group. In healthy individuals, greater slow-cadence
sc seems likely related to oxidative muscle fiber recruitment at higher muscular tension. COPD patients, known to have fast-twitch fiber predominance, might be unable to recruit oxidative fibers at high muscle tension, blunting
sc response.
Introduction
The kinetics of oxygen uptake () at the onset of constant work-rate (CWR) exercise has been characterized as being composed of three phases. Phase I is considered to be the result of the immediate cardiovascular response after which
increases monoexponentially toward a steady state (variably termed the primary, fundamental, or phase II kinetics). If the CWR is in the heavy intensity domain, that is, above the lactate threshold (LT), an additional delayed “slow component” (
sc) develops (Citation1, Citation2). In healthy individuals, the
sc has been characterized by an increase in
between the 3rd and 6th minute of exercise (
(6-3)) (Citation3, Citation4). The
sc initially becomes evident after about 2–3 minutes of heavy-intensity exercise, is predominantly due to a decrease in work efficiency within the exercising muscles (Citation5, Citation6), and is associated with progressive motor unit recruitment (Citation7) and muscle fatigue (Citation8). The involvement of substrate level phosphorylation serves as a source of increased serum lactate concentration during heavy-intensity exercise (Citation3, Citation4, Citation6). Several studies have shown that there is a close correlation between the magnitude of the
sc and the change in blood lactate concentration during supra-LT exercise (Citation3, Citation9–12).
Current consensus suggests a mechanistic link of sc to the recruitment of Type II muscle fiber contraction that are apparently less efficient energetically than Type I fiber contraction, thus contributing to a higher ratio of blood [lactate] to [pyruvate] (Citation1, Citation6, Citation13). The
sc associated with muscle fatigue and increasing inefficiency in the very heavy intensity domain is logically associated with developing fatigue, exercise intolerance, and task failure. Barstow et al. showed that the magnitude of the
sc during heavy intensity CWR exercise was negatively correlated with the proportion of Type I fibers over a range of pedaling rates (Citation14). Endo et al. (Citation15), involving functional magnetic resonance imaging during heavy- and very heavy-intensity exercise in healthy individuals, demonstrated that increasing
sc magnitude was associated with a progressive heterogeneous muscle recruitment. There was a positive correlation between the magnitude of
sc and the activation of the muscles in the whole thigh, but the nature of the fibers recruited during
sc (i.e., whether type I or type II) has yet to be determined. Available evidence suggests that, for the same external power output, Type II muscle fibers may be recruited to a greater extent at low pedaling frequency (e.g., 40 RPM) (Citation16, Citation17). Since work rate is the product of torque applied to the crank of the cycle and the number of revolutions per minute, it follows that higher muscle tension is required at low-pedaling frequency for a given work rate. Thus, an additional increase of
at low pedaling frequency could be caused by recruitment of additional muscle fibers during slow movement, presumably related to higher muscle tension (Citation16, Citation18). However, in COPD patients, muscle wasting affects primarily Type I fibers and there is a relative increase in number of Type II muscle fibers (Citation19–23). We hypothesized that, if the
sc response is associated with additional fiber recruitment, then the slope of the
sc and the rate of lactate accumulation in severe COPD patients might be different from healthy individuals during heavy intensity CWR exercise at slow pedaling rates as compared to higher pedaling rates. If the
sc is associated with additional fiber recruitment, then it must involve both Type I and Type II recruitment and an increased lactate accumulation at slow pedaling rates as compared to higher pedaling rates. The aim of this study was, therefore, to examine the effect of pedaling cadence on the
sc and lactate accumulation when exercising at the same effective work rate in severe COPD compared with healthy individuals. Further, we hypothesized that the slope of the
sc in severe COPD patients might be lower than that of healthy individuals during heavy constant work-rate exercise due to the lower proportion the available Type I fibers in the COPD patients.
Material and methods
Study participants
We studied 8 clinically stable patients with severe COPD who were no more than mildly hypoxemic (i.e., oxygen saturation measured by pulse oximetry [SpO2] at rest >92%, and SpO2 during exercise >89% when respiring room air); they had no significant co-morbidity. Eight age-matched healthy individuals were also recruited. Included subjects had no significant co-morbidity. Specifically, subjects with significant cardiovascular diseases such as ischemia, congestive heart failure, or arrhythmias were excluded. The institutional review board at the Los Angeles Biomedical Research Institute at Harbor-UCLA Medical Center approved the protocol and all participants gave signed written informed consent.
Pulmonary function testing
Before exercise testing, study participants underwent pulmonary function testing for spirometry (Vmax 229, version 5-2A; SensorMedics; Yorba Linda, CA). Albuterol (200 μg) was administered to the COPD patients from a metered-dose inhaler 20 minutes before testing. Normal standards established by Hankinson et al. (Citation24) were used to generate percent predicted values. Maximal voluntary ventilation (MVV) was calculated as forced expiratory volume in one second (FEV1) times 40.
Cycle ergometer calibration
The cycle ergometer (ERGOLINE-800, Sensormedics, Yorba Linda, CA) was physically calibrated (VACUMED, Ventura, CA) and found to be accurate within between 10 and 200 W; the difference between the actual and set work rate averaged 0.55 ± 0.71 W. Based on the hyperbolic function of the ergometer, the calculated torque at 40 RPM was 1.5 times that at 60 rpm and at 80 RPM torque was 0.75 times that at 60 rpm.
Incremental exercise tests
A symptom-limited incremental exercise test was conducted on an electromagnetically braked cycle ergometer (Ergoline-800; SensorMedics) with a ramp slope of 5 or 10 W/min for the COPD patients and a ramp slope of 15 or 20 W/min for the control participants. During the incremental test, pedaling rate was kept constant at 60 RPM. Peak was determined as the average
over the last 30 seconds of exercise. Lactate threshold (LT) was estimated from gas exchange measurements by the modified V-slope method (Citation25). Seat height was recorded for the first test and reproduced for all subsequent tests. Subjects were instructed to avoid consumption of alcohol and caffeine 4 hours before each test and to avoid strenuous exercise 24 hours prior to testing.
Square-wave transitions
Each subject performed four square-wave transitions from rest to a power output calculated to require 30%Δ for each of the pedaling frequencies. The 30%Δ was calculated using the following formula: 30%Δ =LT + 0.3 × (
peak −
LT).
Since the is appreciably different between 40 and 80 RPM at the same external work rate, on the day of incremental test, each subject completed a 6 minute CWR exercise (20 W) at each pedaling rate in order to quantify the metabolic difference that is accounted for at the two pedaling rates. Assuming a 10 mL
/W increment, half of the calculated work rate difference was then added to the target work rate to be performed at 40 RPM and subtracted from the target work rate to be performed at 80 RPM. In this way, we targeted similar metabolic rates at the two pedaling cadences. The adjusted final work rates for each pedaling rate and group are presented in .
On each testing day, participants performed the transitions to each of the two cadences, separated by at least 2 hours, in a randomized order. Each square-wave transition consisted of 3 minutes of rest, an abrupt transition to 8 minutes of exercise at power output resulting in 30%Δ, and 10 minutes recovery at rest. In order to eliminate the effect of initial inertia of the ergometer, before the beginning of exercise the flywheel was manually accelerated above the speed corresponding to the desired cadence, and the exercise transition started the moment the participant started moving the legs. Fifteen minutes prior each exercise, albuterol (200 µg) was given to the COPD patients to achieve a stable state of bronchodilation.
Measurement of pulmonary gas exchange
Pulmonary gas exchange ( and
) and minute ventilation (
) were measured breath-by-breath (Vmax Spectra, V 12-2, SensorMedics, Yorba Linda, CA). The mass flow sensor and the gas analyzers were calibrated immediately before each exercise test. In order to assess reproducibility, a metabolic simulator (Metabolic Calibration Kit No.17051 Vacumed, Ventura, CA) was used before each test to simulate predefined levels of
,
, and
(Citation26) at four respiratory rates (20, 30, 45, and 55 breaths per minute). The coefficient of variations for
,
, and
from the metabolic simulator were 2.4, 2.0, and 5.2% in the tests corresponding to the tests at 40 RPM (62 tests), and 2.9, 2.3, and 5.3% in the tests corresponding to the tests at 80 RPM (61 tests). In addition, we used a biologic control participant for system validation in a two-level subthreshold CWR (20 W and 70 W at 60 RPM for 6 minutes each) on a weekly basis to assess the coefficient of variation of
(Citation27). The mean (±SD) of
for CWR at 20 W was 0.705 (±0.054) L/min and at 70 W was 1.272 (±0.054) L/min with the coefficient of variations being 7.6% and 4.2%, respectively (calculated from 8 tests). This coefficient of variation was similar to what has been found previously in this laboratory (Citation27).
Heart rate (HR) and oxygen saturation (SpO2) were recorded with continuous ECG (Cardiosoft; SensorMedics) and pulse oximetry (N-200 pulse oximeter; Nellcor; Hayward, CA). On one of the test days, before the CWR exercise was performed, a 21–gauge catheter was placed in a dorsal hand vein. An infrared bulb was used to warm the hand, thereby arterializing the venous samples. This procedure has been found to yield pCO2, pH, and lactate levels that approximate arterial values (Citation28). Samples were taken within 60 seconds before the onset, and at 2, 4, 6, and 8 minutes after the onset of exercise. Blood samples were taken in heparinized syringes and were placed in iced water immediately. Each sample was analyzed within 30 minutes after blood sampling for pH and standard bicarbonate (model 1640; Instrumentation Laboratories; Lexington, MA). A portion of each blood sample was centrifuged to obtain plasma for lactate measurement using ion chromatography (Metrohm-Peak, Inc., Houston, TX).
Lactate measurement
Whole blood samples of 1.5 mL each were centrifuged immediately after the test and the plasma was frozen at −80 °C and stored. Lactate concentration was measured using 0.2 mL of plasma diluted in absolute alcohol by a factor of 10 in order to precipitate plasma proteins. The supernatant was evaporated in nitrogen stream and was reconstituted in 2 mL of deionized water. Samples were then filtered using 25 µm syringe filter (Fisherbrand). Ion chromatography (Metrohm 761 ion chromatograph with anion suppression, Metrosep A, Supp 5 250 mm column with a 0.02 mL volume loop; eluent: flow =7 mL/min, 3.2 mM Na2CO3, 1.0 mM NaHCO3) was used. One milliliter of the prepared solution was loaded onto a 0.02 mL loop and run in the anion suppression column for 30 minutes. The difference between end exercise lactate and the resting lactate concentration for each pedaling rate was expressed as a delta value (ΔLAC) in mmol/liter (mM).
Data analysis
Breath-by-breath data for each step-transition was linearly interpolated at 1 second intervals, time aligned to the onset of exercise and bin-averaged for 5 second intervals to provide on- and off-transitions for each exercise test. The four repetitions were then ensemble averaged to improve the signal to noise ratio of the underlying physiological response. The time course of was described in terms of exponential function that was fit to the data using nonlinear regression technique by the Marquardt-Levenberg algorithm (SigmaPlot 10.0 Systat Software, Inc., San Jose, CA).
Time course of the gas exchange response
The mathematical model for the response was based on a two exponential function with 1 time delay and fitted to the averaged response for each subject starting at the visually selected beginning of phase II response (Citation29) as follows:
(1)
(1)
where A1×[1 − e(−t/τ1)] denotes phase II (i.e., primary component) and A2×[1 − e(−(t-TD2)/τ2)] denotes the slow component phase, y(b) is the
value at the end of phase I; A1 and A2 are the asymptotic values for the exponential terms; τ1 and τ2 are the time constants, and TD2 is the time delay identified at the start of the
sc. In this model, phase II continues beyond the start of the
sc; therefore, at the end-exercise (tlim), the total amplitude was set equal to baseline + A1' + A2'. Further, phase II
amplitude was calculated at the start of phase III (at TD2) as A1″ in the form:
(2)
(2)
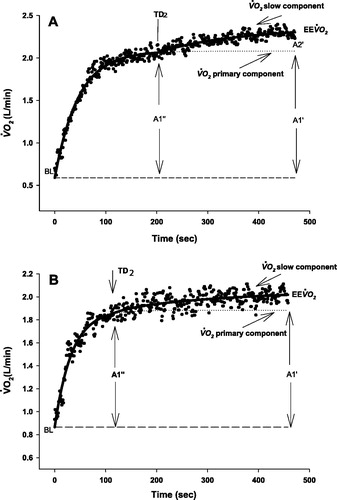
These components of the nonlinear function are depicted in a control participant at 40 RPM () and 80 RPM ().
Figure 1. Schematic showing the two-exponential model used to describe responses of during exercise in a healthy subject (a) and in a COPD patient (b) at 40 RPM (a), 80 RPM (b). Parameters correspond to those in Eq. 1. BL, baseline; EE
,
at end exercise; A1′: amplitude of primary component of
at end of exercise; A1′: amplitude of primary component of
at time TD2 (time delay); A2': amplitude of the slow component
.
If the response was fundamentally monoexponential, the second exponential term in EquationEq. 1(1)
(1) was dropped out when F-tests confirmed that the root mean square (RMS) was not significantly reduced using the more complex model (Citation30). The amplitude of the
sc relative to the end-exercise
was calculated as A2′/EE
(where EE
is the
at end exercise). The
sc slope was calculated A2'/EE
divided by 8 minutes minus TD2.
Statistical analyses
Results are presented as mean ± SD unless stated otherwise. Comparisons between responses at different pedaling cadences for both controls and COPD patients were made using a two-way repeated measures ANOVA with post hoc Holm-Sidak paired t-tests. The difference in sc slope between 40 and 80 RPM (ΔSlope40–80) and the difference of lactate concentration (end-exercise − resting) between 40 and 80 RPM (ΔLAC40–80) in the two subject groups were compared using unpaired t-test or Mann-Whitney U test where appropriate. Statistical significance was accepted at p < 0.05. The coefficient of variation, expressed as a percentage, was used as a measure of variation in repeated measurements of
,
, and
in physiologic and metabolic pump calibrations.
Results
shows participant characteristics and pulmonary function tests at rest and during exercise in both COPD patients and healthy individuals. The anthropometric values of the age-matched healthy group were not different from COPD patients ().
Table 1. Participant characteristics, lung function and responses to incremental exercise.
Table 2. kinetic parameters in COPD and healthy subjects during heavy-intensity cycle ergometry at 40 and 80 RPM.
Incremental exercise test
The COPD patients had severe obstruction as measured by low FEV1 (35 ± 10% predicted) and FEV1/FVC ratio (40 ± 8%) (). Accordingly, their severely decreased exercise capacity was due to ventilatory limitation as approached maximum voluntary ventilation (MVV) (98 ± 25%), while healthy subjects had appreciable ventilatory reserve at peak exercise (
/MVV =52 ± 13%). The low LT in COPD occurred at the same percentage of
peak as healthy individuals (67 ± 15% and 67 ± 6%, respectively) ().
 response kinetics to square-wave work rate transitions
shows the group average kinetic response to heavy intensity exercise at 40 and 80 RPM cadence in healthy subjects () and COPD patients (). shows the
kinetic parameters for the square-wave transitions to heavy intensity exercise at each pedaling cadence. The phase II response amplitude of
at 40 and 80 RPM did not differ in either group (1.46 ± 0.29 vs. 1.43 ± 0.24 L/min in healthy subjects and 1.04 ± 0.21 vs. 1.07 ± 0.23 L/min in COPD patients). Thus, we were successful in accounting for the difference in the oxygen cost of internal work due under the different cadence conditions. The ratio of A1'/EE
was 78.9 ± 7.6% at 40 RPM and 82.1 ± 8.7% at 80 RPM in healthy subjects, and 87.4 ± 8.9% at 40 RPM and 88.1 ± 7.5% at 80 RPM in COPD patients. COPD patients were ventilatory limited in both cadences as end exercise
approached their MVV at the end of heavy intensity CWR exercise at both pedaling rates (EE
/MVV 96 ± 20% and 92 ± 21% at 40 RPM and 80 RPM, respectively). The EE
in the healthy group was 97 ± 6.8% of
peak at 40 RPM and 92 ± 7.6% of the
peak at 80 RPM. The EE
in COPD group was 98 ± 11% of
peak at 40 RPM and 98 ± 12% of
peak at 80 RPM. Furthermore, the average slope of
of the slow component was steeper at 40 RPM than at 80 RPM in the healthy group (46.6 ± 12 vs. 29.5 ± 11.7 mL/min2, p = 0.002) but that of COPD patients was not different (16.2 ± 14.7 vs. 13.3 ± 7.6 mL/min2, p = 0.53). Importantly, the
sc slope was significantly steeper in healthy group than in COPD patients at both pedaling frequencies (p = 0.0001 and p = 0.01 at 40 RPM and 80 RPM, respectively).
Figure 2. Group averaged response kinetics to heavy intensity exercise in healthy subjects (a) at 40 RPM (solid triangle) and 80 RPM (open triangle) and in COPD patients (b) at 40 RPM (solid circle) and 80 RPM (open circle). Point interval =10 seconds. Dotted lines (- - - - -) show the average peak
from the incremental test in each group. In the ensemble averages, time zero represents the start of Phase II and the vertical lines represent start of phase II and end of exercise.
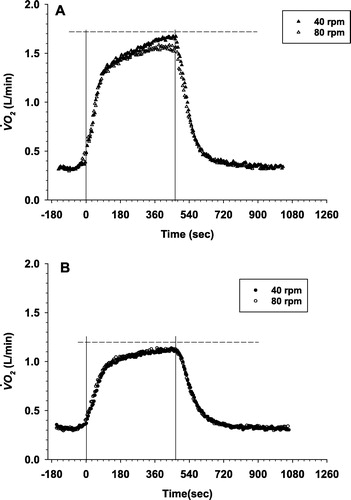
The time constant of the phase II responses was not different between 40 RPM and 80 RPM (42 ± 12 seconds vs. 41 ± 11 seconds, respectively, p = 0.95) in healthy subjects. In COPD, the
time constant was appreciably, but not significantly, longer than in healthy subjects (49 ± 17 seconds for 40 RPM vs. 53 ± 9 seconds for 80 RPM, p = 0.51, see ).
Lactate and pH responses to square wave work rate transitions
During the 8 minutes of constant work rate exercise the lactate concentration increased in a linear fashion such that at 40 RPM the LAC increase was somewhat steeper in the healthy group than at 80 RPM, this difference, however did not reach statistical significance. In the COPD group, the lactate concentrations were virtually identical at each time point on both pedaling frequencies (). This resulted in no significant difference in ΔLAC between pedaling rates in either group (5.5 ± 2.1 mM vs. 4.3 ± 2.2 mM at 40 and 80 RPM in healthy group (p = 0.35), and 3.3 ± 1.9 mM vs. 3.0 ± 1.3 mM at 40 and 80 RPM in COPD patients (p = 0.69).
Figure 3. Group averaged blood lactate concentration over time during heavy-intensity exercise in healthy subjects and COPD patients during cycling at 40 RPM and 80 RPM. Mean and SE are shown, as well as mean regression between 2 and 8 minutes of exercise to illustrate the difference in trends.
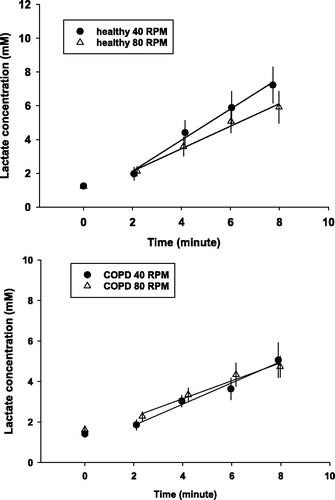
The average decline in end-exercise blood pH from rest at 40 RPM did not differ significantly from that of 80 RPM in either group (−0.07 ± 0.03 vs. −0.04 ± 0.03 in healthy individuals and −0.04 ± 0.03 vs. −0.03 ± 0.03 in COPD patients). Moreover, there was no difference in change of standard bicarbonate (SBC) from baseline between 40 and 80 RPM in either group (−2.2 ± 0.85 vs. −2.2 ± 3.35 mEq/L in healthy subjects and −2.3 ± 1.8 vs. −2.1 ± 4.5 mEq/L in COPD patients).
Relationships between the sc slope and ΔLAC
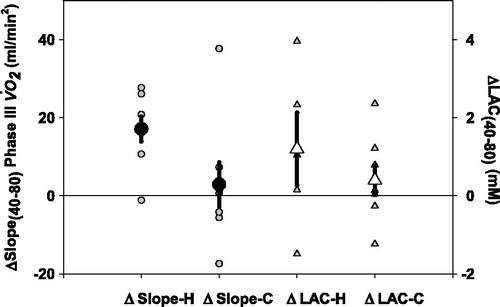
The slope differences between 40 and 80 RPM are shown on . It is apparent, that the ΔSlope40–80 was greater in healthy subjects than in COPD patients (17.1 ± 9.1 mL/min2, 2.9 ± 15.9 mL/min2, respectively, p = 0.046). The end exercise ΔLAC40–80 tended to be higher in the healthy group, but there was essentially no difference in the COPD group. ().
Figure 4. The difference in Phase III slope between 40 and 80 RPM (ΔSlope 40–80 RPM phase III
) (circle) and the difference of lactate concentration (end exercise – resting) between 40 and 80 RPM (ΔLAC40–80 RPM) (triangle) for each healthy subject (H) and each COPD patient (C). *p < 0.05 ΔSlope 40–80 RPM phase III
in healthy subjects versus ΔSlope40–80 RPM phase III
in COPD patients. Individual data points, means, and SE are shown.
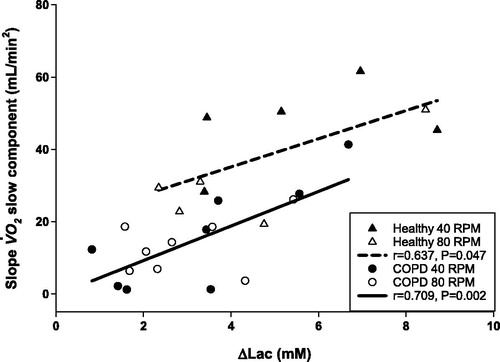
Importantly, however, there was a strong positive correlation between sc with ΔLAC in both healthy (r = 0.637, p = 0.047) and COPD patients (r = 0.709, p = 0.002) with near-identical slopes (4.31 mL O2/min2/mM for the pooled data), whereas the intercept was significantly higher in the healthy versus the COPD group (19.6 ± 9.0 vs. −0.32 ± 4.5 mL/min2, respectively; mean ± SEM) ().
Figure 5. Correlation between the slopes of sc and the change in lactate concentration between end exercise lactate and the resting (ΔLAC) at 40 and 80 RPM in the healthy group (triangles) and in the COPD group (circles). The slopes are not different (p = 0.6678), but the intercepts are significantly different (19.5 ± 9.02 vs. −0.32 ± 4.51, p = 0.0008).
Discussion
The main finding of this study is that in the group of patients with COPD the slopes of the sc were virtually identical at low (40 RPM) and high (80 RPM) pedaling rates, while in the healthy group the slope was significantly steeper at low pedaling rate than that of at high pedaling rate. Thus, there is a distinct difference in the response pattern of
between healthy subjects and COPD patients in the heavy exercise domain depending on the cycling cadence. These findings are consistent with our primary hypothesis.
Method comparison
In this study, we successfully compensated for the internal work rate associated with the pedaling rate by adjusting the work rates assuming a 10 mL/W increase in . Thus, the amplitude of the primary Phase II component of
was not influenced by pedaling rate either in the healthy group or in COPD patients. However, these amplitudes were larger in healthy subjects than in COPD patients because the work rate equivalent to 30% delta was higher in healthy group. We believe that the precisely matched metabolic rate for the two different pedaling rates in each of the two groups serves a reasonable platform for comparing the slow component kinetic responses in the heavy intensity domain.
The time constant of Phase II response was the same with different pedaling rates, but in the COPD group, the
time constant tended to be longer than in healthy group (though this difference did not achieve statistical significance []). It has been shown that the time constant of the main component is independent of the actual work rate domain (Citation31). However, the amplitudes of the response pattern (Phase II and slow component) are highly dependent on the metabolic requirements of the given work rate. This was the reason why we attempted to adjust the work rate such that we achieve similar metabolic rates in our study in order to have a solid basis of kinetic analysis in which the different primary amplitudes at different cadences were not factors to consider.
In this study, the subjects performed four individual transitions with the expectation that, with averaging, the breath-by-breath noise would be roughly halved (Citation32). Using nonlinear regression analysis, we achieved a high confidence in model parameter values partially because we started the exponential function at the start of Phase II, thus eliminating the need to identify additional parameters related to Phase I, and partially because of the good signal-to-noise ratio achieved by averaging several transitions (Citation32).
Previous studies of oxygen uptake kinetics (Citation14, Citation33) employed a contiguous model involving 3 exponential components corresponding to all three phases. In our studies, exercise started with pre-spun flywheel and the work rate was applied as soon as the subject started to pedal. This helped us to isolate Phase I and start the kinetic analysis from the beginning of Phase II. This practice helped effectively eliminating the need to identify two additional parameters in the model (i.e., the time constant for Phase I and the primary time delay [TD1]). Furthermore, characterizing slow component with a third time constant in the model inherently assumes that all units contributing to the slow component kinetics are ‘turned on’ at the same time (i.e., at time of TD2). However, the same response profile can potentially be described without presuming that the slow component is a distinct component caused by well-characterized functional and structural contributors. Theoretically, it is possible to construct a model that would consider newly, but asynchronously recruited units characteristically with the same time constant as Phase II (Citation34). We acknowledge that our modeling strategy did not attempt to model units asynchronously joining to perform the external work.
Role of pedaling cadence on oxygen uptake kinetics during heavy-intensity exercise
Other investigators have studied the influence of pedaling rate on oxygen uptake kinetics. Barstow et al. reported that changing the pedaling rate between 45 and 90 RPM had no effect on the amplitude of the sc (Citation14). Pringle et al. demonstrated that the amplitude of the
sc was greater at higher pedal rate (115 RPM) but there was no difference in amplitude of
sc with pedaling rates between 75 and 35 RPM (Citation35). In contrast, in the present study, we have shown opposite results in that we found a steeper slope of the
sc in healthy individuals at slow pedaling rate and no difference in COPD patients between low and high pedaling rates. We see two potential reasons to explain this difference: first, we successfully adjusted for the internal work difference imposed by the two pedaling rates. In the study of Pringle et al. (Citation35), however, the Phase II
component averaged 1.47 ± 0.13 L/min at 35 RPM and 1.54 ± 0.15 L/min at 75 RPM which, though not a significant difference, suggests that the actual work rate was lower at the lower pedaling rate, perhaps affecting their results. Second, recruiting additional oxidative fibers can cause an additional rise of
at low pedaling rates that is presumably related to higher muscle tension (Citation2, Citation16, Citation18, Citation36). Each recruited fiber initially needs energy to overcome internal friction and to stretch before delivering external work (Citation18). Sargeant et al. has demonstrated in healthy individuals that Type I fibers have lower power-generating capability compared to Type II fibers. However, Type II fibers are fatigue sensitive fibers and are recruited at a higher fraction of maximum power after type I fibers have already been fully recruited (Citation17). Indeed, it has been suggested that the more fatigue sensitive Type II fibers are recruited earlier than would be expected (Citation7, Citation37–39). Using functional magnetic resonance, Endo et al. (Citation15) recently demonstrated that increasing
sc magnitude was associated with a progressive heterogeneous recruitment of muscle fibers. It is further suggested that progressive recruitment of muscle fibers yields a poor ratio of force production to
and leads to an elevated O2 cost at high external power output resulting in appearance of
sc. The influence of changes in pedaling rate on the
response to heavy intensity exercise in subjects with differences in muscle fiber type distribution, however, is not known. The reported effect of pedaling rate on muscle activation is conflicting in the available literature. In healthy individuals, Barstow et al. (Citation14) did not find any interactions between muscle fiber type and changes in pedaling rate.
One might argue that the different absolute work rate between the two subject groups might be responsible for the differences in slow component amplitude. The lower the absolute work rate, the less is the slow component amplitude, so is the lactate concentration. However, we found that the at end exercise normalized to the individual peak
was higher in the COPD group (143 ± 17% at 40 RPM and 145 ± 19% at 80 RPM in COPD vs. 133 ± 13% at 40 RPM and 128 ± 14% at 80 RPM in healthy subjects). Hence the relative work rate was—if anything—higher in the COPD group than in the healthy subjects, hence encroaching more the heavy-very heavy work rate domain, which in turn should have contributed to a more pronounced slow component in the COPD group. In fact, referring to the significant difference in the intercepts of
sc versus ΔLAC on , one might conclude that it is the absolute and not the relative work rate that is associated with lactate production, although the question why similar lactate production results in much different
sc still remains unanswered.
Individuals with severe COPD who have muscle wasting have extremes of muscle fiber type distribution (Citation19, Citation22) and might have homogeneous pattern of distribution; they therefore might respond differently to changes in pedaling rate. This might also mean occurrence of additional fiber recruitment at higher muscle tension that might manifest at slow pedaling rates. This might also explain why the slow component oxygen uptake response is steeper in control participants because Type II fiber predominance has been seen even in COPD patients without clear signs of weight loss or muscle wasting. This is supported by the comparable ΔLAC levels in the two groups. Several other studies have demonstrated significant correlation between % Type II muscle fibers and the relative amplitude of the sc (Citation14, Citation33). However, no direct evidence exists that the mechanism responsible for the
sc is the progressive recruitment of Type II fibers.
An alternative hypothesis to explain the sc is that fatigue in the Type II fiber pool as exercise proceeds necessitates an increased activity of Type I fibers (Citation35, Citation40), which have been reported to be relatively less efficient at higher force requirements (Citation41, Citation42); therefore, a higher oxygen requirement would be expected for the same rate of tension generation. This was supported by the study of Cannon et al. (Citation8) that showed that muscle fatigue measured by a reduction in force output occurs in healthy subjects performing heavy- and very heavy-intensity exercise and initiates the rise in the O2 cost of exercise where the
sc is present, the amplitude of which was independent of pedaling rates (60, 90, and 120 RPM). It is worth noting, however that in this experiment the fatigue-related reduction of velocity-specific peak power was greatest at 120 RPM, three times as much as at 60 RPM. The reduction of peak power would have been less at different cadence, had they applied the work rate adjustment technique to balance the effect of cadence-dependent pedal force. Nevertheless, these results cannot readily be extrapolated to the lower cadence rate of 40 RPM. We are not aware of any data to support this notion in COPD.
Our results were consistent with other previous studies that have demonstrated a correlation between the slope of sc and lactate concentration increase during heavy intensity exercise (Citation3, Citation9–11). However, some studies suggested that pathway of hepatic glycogen resynthesis could only contribute minimally to the additional
(Citation2, Citation43). The intercept of the relationship between
sc slope and lactate increase was higher in control participants than COPD patients. COPD patients, because of their known fast-twitch fiber predominance, might be unable to recruit oxidative fibers at high muscle tension, blunting
sc response.
Clinical implications
Muscle dysfunction has been found to be prevalent in the COPD population. This contributes to exercise intolerance, which is often the chief complaint of these patients. To some extent, this reflects deconditioning related to a sedentary lifestyle. However, as shown in the differences in response to alteration of pedaling rate between COPD and age-matched healthy subjects study, fundamental differences in physiological responses to exercise exist that seem unlikely to be solely by deconditioning.
Limitations
We acknowledge a series of limitations in that we did not employ fiber typing; there was no fatigue assessment or EMG analysis. Furthermore, there was no assessment of blood flow through the working muscles, which has been shown to affect muscle oxygen uptake and the heterogeneity of the blood flow could contribute to the dynamics of oxygen uptake (for detailed review of this topic the reader is referred to an in-depth review of the heterogeneity of intramuscular blood flow by Koga et al. (Citation44)). Optimally, all of the above factors could be considered if one intends to attempt addressing the long-debated question of the mechanism of sc. Future studies might incorporate muscle biopsy so that differences in muscle characteristics between COPD and healthy subjects could be more definitively assessed. Finally, our results are specific to the case in which alterations in pedaling rate were made under iso-metabolic conditions (sum of external and internal work rate was constant). Studies in which changes in pedaling rate are made with external work rate was held constant might yield different results.
Conclusion
All of these should help to gain deeper insight of the mechanisms behind the major findings, that (Citation1) sc is larger at slow cadence in healthy subjects, (Citation2)
sc is shallower in COPD, and (Citation3) there is no difference in
sc at 40 RPM and 80 RPM in patients with COPD.
Declaration of Interest
All authors declare no conflicts of interest.
| Abbreviations | ||
| ΔLAC | = | Difference between end exercise lactate and resting lactate concentration |
| ΔLAC40-80 | = | Difference of lactate concentration (end-exercise − resting) between 40 and 80 RPM |
| ΔSlope40-80 | = | Difference in |
| ANOVA | = | Analysis pf variance |
| COPD | = | Chronic obstructive pulmonary disease |
| CWR | = | Constant work-rate |
| EE | = | Minute ventilation at end exercise |
| EE | = | Oxygen uptake at end exercise |
| FEV1 | = | Forced expiratory volume in 1 second |
| FVC | = | Forced vital capacity |
| LT | = | Lactate threshold |
| MVV | = | Maximal voluntary ventilation; |
| = | Carbon dioxide output; | |
| = | Oxygen uptake slow component | |
Additional information
Funding
References
- Poole DC, Barstow TJ, Gaesser GA, Willis WT, Whipp BJ. VO2 slow component: physiological and functional significance. Med Sci Sports Exerc. 1994;26(11):1354–1358.
- Whipp BJ. The slow component of O2 uptake kinetics during heavy exercise. Med Sci Sports Exerc. 1994;26(11):1319–1326.
- Roston WL, Whipp BJ, Davis JA, Cunningham DA, Effros RM, Wasserman K. Oxygen uptake kinetics and lactate concentration during exercise in humans. Am Rev Respir Dis. 1987;135(5):1080–1804.
- Whipp BJ, Wasserman K. Oxygen uptake kinetics for various intensities of constant-load work. J Appl Physiol. 1972;33(3):351–356.
- Krustrup P, Jones AM, Wilkerson DP, Calbet JA, Bangsbo J. Muscular and pulmonary O2 uptake kinetics during moderate- and high-intensity sub-maximal knee-extensor exercise in humans. J Physiol. 2009;587(Pt 8):1843–1856.
- Poole DC, Schaffartzik W, Knight DR, Derion T, Kennedy B, Guy HJ, Prediletto R, Wagner PD. Contribution of exercising legs to the slow component of oxygen uptake kinetics in humans. J Appl Physiol. 1991;71(4):1245–1260.
- Krustrup P, Soderlund K, Mohr M, Bangsbo J. The slow component of oxygen uptake during intense, sub-maximal exercise in man is associated with additional fibre recruitment. Pflugers Arch. 2004;447(6):855–866.
- Cannon DT, White AC, Andriano MF, Kolkhorst FW, Rossiter HB. Skeletal muscle fatigue precedes the slow component of oxygen uptake kinetics during exercise in humans. J Physiol. 2011;589(Pt 3):727–739.
- Barstow TJ, Casaburi R, Wasserman K. O2 uptake kinetics and the O2 deficit as related to exercise intensity and blood lactate. J Appl Physiol. 1993;75(2):755–762.
- Casaburi R, Storer TW, Ben-Dov I, Wasserman K. Effect of endurance training on possible determinants of VO2 during heavy exercise. J Appl Physiol. 1987;62(1):199–207.
- Poole DC, Ward SA, Gardner GW, Whipp BJ. Metabolic and respiratory profile of the upper limit for prolonged exercise in man. Ergonomics. 1988;31(9):1265–1279.
- Zoladz JA, Korzeniewski B. Physiological background of the change point in VO2 and the slow component of oxygen uptake kinetics. J Physiol Pharmacol. 2001;52(2):167–184.
- Jones AM, Grassi B, Christensen PM, Krustrup P, Bangsbo J, Poole DC. Slow component of VO2 kinetics: mechanistic bases and practical applications. Med Sci Sports Exerc. 2011;43(11):2046–2462.
- Barstow TJ, Jones AM, Nguyen PH, Casaburi R. Influence of muscle fiber type and pedal frequency on oxygen uptake kinetics of heavy exercise. J Appl Physiol. 1996;81(4):1642–1650.
- Endo MY, Kobayakawa M, Kinugasa R, Kuno S, Akima H, Rossiter HB, Miura A, Fukuba Y. Thigh muscle activation distribution and pulmonary VO2 kinetics during moderate, heavy, and very heavy intensity cycling exercise in humans. Am J Physiol Regul Integr Comp Physiol. 2007;293(2):R812–R820.
- Ahlquist LE, Bassett DR, Jr., Sufit R, Nagle FJ, Thomas DP. The effect of pedaling frequency on glycogen depletion rates in type I and type II quadriceps muscle fibers during submaximal cycling exercise. Eur J Appl Physiol Occup Physiol. 1992;65(4):360–364.
- Sargeant AJ. Human power output and muscle fatigue. Int J Sports Med. 1994;15(3):116–121.
- Böning D, Gonen Y, Maassen N. Relationship between work load, pedal frequency, and physical fitness. Int J Sports Med. 1984;5(2):92–97.
- Gosker HR, van Mameren H, van Dijk PJ, Engelen MP, van der Vusse GJ, Wouters EF, Schols AM. Skeletal muscle fibre-type shifting and metabolic profile in patients with chronic obstructive pulmonary disease. Eur Respir J. 2002;19(4):617–625.
- Jobin J, Maltais F, Doyon JF, LeBlanc P, Simard PM, Simard AA, Simard C. Chronic obstructive pulmonary disease: capillarity and fiber-type characteristics of skeletal muscle. J Cardiopulm Rehabil. 1998;18(6):432–437.
- Mador MJ, Bozkanat E. Skeletal muscle dysfunction in chronic obstructive pulmonary disease. Respir Res. 2001;2(4):216–224.
- Maltais F, LeBlanc P, Whittom F, Simard C, Marquis K, Belanger M, Breton MJ, Jobin J. Oxidative enzyme activities of the vastus lateralis muscle and the functional status in patients with COPD. Thorax. 2000;55(10):848–853.
- Saey D, Michaud A, Couillard A, Cote CH, Mador MJ, LeBlanc P, Jobin J, Maltais F. Contractile fatigue, muscle morphometry, and blood lactate in chronic obstructive pulmonary disease. Am J Respir Crit Care Med. 2005;171(10):1109–1115.
- Hankinson JL, Odencrantz JR, Fedan KB. Spirometric reference values from a sample of the general U.S. population. Am J Respir Crit Care Med. 1999;159(1):179–187.
- Sue DY, Wasserman K, Moricca RB, Casaburi R. Metabolic acidosis during exercise in patients with chronic obstructive pulmonary disease. Use of the V-slope method for anaerobic threshold determination. Chest. 1988;94(5):931–938.
- Huszczuk A, Whipp BJ, Wasserman K. A respiratory gas exchange simulator for routine calibration in metabolic studies. Eur Respir J. 1990;3(4):465–468.
- Porszasz J, Woodhouse L, Casaburi R, Nguyen A, Tsurugaya H, Whipp BJ. Use of physiological calibration to validate gas exchange measurements during exercise. Med Sci Sports Exerc. 2004;36(5):S27.
- McLoughlin P, Popham P, Linton RA, Bruce RC, Band DM. Use of arterialized venous blood sampling during incremental exercise tests. J Appl Physiol. 1992;73(3):937–940.
- Whipp BJ, Ward SA, Lamarra N, Davis JA, Wasserman K. Parameters of ventilatory and gas exchange dynamics during exercise. J Appl Physiol Respir Environ Exerc Physiol. 1982;52(6):1506–1513.
- Motulsky HJ, Ransnas LA. Fitting curves to data using nonlinear regression: a practical and nonmathematical review. FASEB J. 1987;1(5):365–374.
- Ozyener F, Rossiter HB, Ward SA, Whipp BJ. Influence of exercise intensity on the on- and off-transient kinetics of pulmonary oxygen uptake in humans. J Physiol. 2001;533(Pt 3):891–902.
- Lamarra N, Whipp BJ, Ward SA, Wasserman K. Effect of interbreath fluctuations on characterizing exercise gas exchange kinetics. J Appl Physiol. 1987;62(5):2003–2012.
- Pringle JS, Doust JH, Carter H, Tolfrey K, Campbell IT, Sakkas GK, Jones AM. Oxygen uptake kinetics during moderate, heavy and severe intensity ″submaximal″ exercise in humans: the influence of muscle fibre type and capillarisation. Eur J Appl Physiol. 2003;89(3–4):289–300.
- Whipp BJ, Rossiter HB, Ward SA. Exertional oxygen uptake kinetics: a stamen of stamina? Biochem Soc Trans. 2002;30(2):237–247.
- Pringle JS, Doust JH, Carter H, Tolfrey K, Jones AM. Effect of pedal rate on primary and slow-component oxygen uptake responses during heavy-cycle exercise. J Appl Physiol. 2003;94(4):1501–1507.
- Hirai DM, Roseguini BT, Diefenthaeler F, Carpes FP, Vaz MA, Ferlin EL, Ribeiro JP, Nakamura FY. Effects of altering pedal frequency on the slow component of pulmonary VO2 kinetics and EMG activity. Int J Sports Med. 2010;31(8):529–536.
- Crow MT, Kushmerick MJ. Chemical energetics of slow- and fast-twitch muscles of the mouse. J Gen Physiol. 1982;79(1):147–166.
- Han YS, Geiger PC, Cody MJ, Macken RL, Sieck GC. ATP consumption rate per cross bridge depends on myosin heavy chain isoform. J Appl Physiol. 2003;94(6):2188–2196.
- Hunter GR, Newcomer BR, Larson-Meyer DE, Bamman MM, Weinsier RL. Muscle metabolic economy is inversely related to exercise intensity and type II myofiber distribution. Muscle Nerve. 2001;24(5):654–661.
- Krustrup P, Soderlund K, Mohr M, Bangsbo J. Slow-twitch fiber glycogen depletion elevates moderate-exercise fast-twitch fiber activity and O2 uptake. Med Sci Sports Exerc. 2004;36(6):973–982.
- Beelen A, Sargeant AJ. Effect of fatigue on maximal power output at different contraction velocities in humans. J Appl Physiol. 1991;71(6):2332–2337.
- He ZH, Bottinelli R, Pellegrino MA, Ferenczi MA, Reggiani C. ATP consumption and efficiency of human single muscle fibers with different myosin isoform composition. Biophys J. 2000;79(2):945–961.
- Barstow TJ, Mole PA. Linear and nonlinear characteristics of oxygen uptake kinetics during heavy exercise. J Appl Physiol. 1991;71(6):2099–2106.
- Koga S, Rossiter HB, Heinonen I, Musch TI, Poole DC. Dynamic heterogeneity of exercising muscle blood flow and O2 utilization. Med Sci Sports Exerc. 2014;46(5):860–876.