
Abstract
Mucus hydration is important in mucus clearance and lung health. This study sought to test the relative utility of spontaneous sputum (SS) versus the reasonably noninvasive induced sputum (IS) samples for measurement of mucus hydration. SS and IS samples were collected over a 2-day study interval. Sputum was induced with escalating inhaled nebulized 3–5% hypertonic saline. Viscous portions of the samples (“plugs”) were utilized for percent solids and total mucin analyses. Cytokines, nucleotides/nucleosides and cell differentials were measured in plugs diluted into 0.1% Sputolysin. Overall, 61.5% of chronic bronchitis (CB) subjects produced a SS sample and 95.2% an IS sample. Total expectorate sample weights were less for the SS (0.94 ± 0.98 g) than the IS (2.67 ± 2.33 g) samples. Percent solids for the SS samples (3.56% ± 1.95; n = 162) were significantly greater than the IS samples (3.08% ± 1.81; n = 121), p = 0.133. Total mucin concentrations also exhibited a dilution of the IS samples: SS = 4.15 ± 3.23 mg/ml (n = 62) versus IS= 3.34 ± 2.55 mg/ml (n = 71) (p = 0.371). Total mucins (combined SS and IS) but not percent solids, were inversely associated with FEV1 percent predicted (p = 0.052) and FEV1,/FVC % (p = 0.035). There were no significant differences between sample types in cytokine or differential cell counts. The probability of sample collections was less for SS than IS samples. Measurements of hydration revealed modest dilution of the IS samples compared to SS. Thus for measurements of mucus hydration, both SS and IS samples appear to be largely interchangeable.
Introduction
We have recently demonstrated that mucus hydration may prove to be a useful biomarker for diagnosing chronic bronchitis (CB) and identifying Chronic Obstructive Pulmonary Disease (COPD) subtypes (Citation1–3). Sputum has been a useful biomarker for assessment of the inflammation and microbiologic status of COPD subjects, suggesting it may be useful for measurement of mucus hydration. Not all COPD patients, however, consistently produce a spontaneous sputum (SS) sample. Accordingly, hypertonic saline (HS) inhalation has been used to induce sputum production in subjects with muco-obstructive lung diseases, including asthma (Citation4, Citation5) and COPD (Citation6, Citation7).
There are similarities and differences in SS versus IS samples. Both SS and IS are likely derived from large airways that develop high flow velocities during cough, producing a sample from a common site (Citation8, Citation9). SS samples are less perturbed by intervention than IS samples, but as noted above, SS often cannot be consistently obtained at a visit in CB patients. Conversely, time and personnel availability limit access to IS samples. Previous comparisons of biomarkers in SS versus IS in COPD subjects have suggested that the two sputum sample types produce similar information but these analyses have generally focused on evaluations of inflammatory markers, e.g. cytokines and differential cell counts (Citation10–12).
This study was designed to assess sample types suitable for measures of mucus concentration (hydration) and mediators that regulate mucus hydration (nucleotides) in subjects with CB. Such a comparison is particularly relevant to IS measures of mucus hydration because of the possibility that HS inhalation will hydrate (dilute) endogenous mucus. Accordingly, we compared the SS versus IS sampling techniques utilizing measures of sputum hydration, including percent solids, mucin concentration and nucleotide and nucleoside levels as our primary aim, in a cohort of well-defined CB subjects.
Methods
This study captured stable baseline periods from a CB cohort (n = 69) who fit criteria for GOLD Stages 0–III with three substudies: (1) a cross-sectional, single baseline sub-study of CB subjects (n = 47); (2) a longitudinal exacerbation sub-study with two sequential baseline periods (n = 30) and (3) a baseline period from an interventional substudy (n = 15) (Clinicaltrials.gov NCT00903955). Each baseline period encompassed visits on two successive days (Supplementary Figure 1A). Twenty-three subjects participated in more than one substudy.
CB was defined as chronic mucus production and cough for at least 3 months per year for two successive years. Inclusion and exclusion criteria were previously described (Citation1). Patients had not received oral steroids or antibiotics for >4 weeks prior to baseline visits and sample collection. All subjects withheld bronchodilators (short- or long-acting) for the morning of the visits. The study was approved by the University of North Carolina Institutional Review Board, and all subjects provided written informed consent.
Sputum collection and processing
On day one of each baseline period, SS samples as available, a physical exam, vital signs, oxygen saturation and spirometry pre- and post-albuterol were obtained. On day two of each baseline period, a SS sample was collected if available and clinical assessments repeated. Sputum was then induced with escalating concentrations of nebulized 3–5% hypertonic saline (DeVilbiss UltraNeb 2000 Ultrasonic nebulizer) (Citation8). Induction was terminated if >200 mg of selected plug material was obtained, or if >200 mg was not obtained after the 5% HS challenge. For each baseline period, it was possible to obtain three sputum samples: two SS samples (days 1 and 2) and one IS sample on day 2.
Sputum samples were delivered to the UNC Sputum Core Lab within 15 minutes of collection. The mucus gel “plug” selection approach was utilized (Citation4) and samples prioritized for analysis, as determined by sample weight (Supplementary Figure 1B). Purulent sputum (strong yellow–green in color), was not processed due to suspicion of active infection. For the determination of percent solids, “plug” samples were selected, weighed, and then dried overnight at 65 °C. Wet to dry ratios were calculated and reported as percent solids (Citation13). The sample was then examined, the remaining mucus gel “plugs” selected, weighed, and placed in a pre-weighed container (Citation8). A portion (100–500 mg) of the mucus gel plugs were diluted with guanidine reduction buffer (0.5%) for mucin analysis by size exclusion chromatography combined with differential refractometry (Citation14). The remaining mucus gel plugs were diluted into a solution of dithiothreitol (0.1%) in EDTA (1 mM) for analyses of: (1) sputum adenosine (ADO) and adenine nucleotides (ATP, ADP and AMP), ethenoderivatized and quantified by HPLC analysis (Citation15); and (2) total cell counts and differentials (Hema-Stain-3; Fisher Scientific, Hampton, NH). Cytokines were measured as previously described (Citation16). Cytokine measures are only reported for values that are within the limits of detection. Sputum quality was assessed by percent squamous epithelial cells (SEC) as a marker of salivary contamination and visual inspection (Citation17).
Statistical analysis
Statistical analyses were conducted using SAS and SAS JMP Pro 12 (Cary, NC, USA). All results are reported as means ± SD, and n as indicated. Values were log transformed to correct for normality when necessary. Correlations were determined by Spearman’s or Pearson’s correlations as appropriate. A logistic regression model was fit to determine the odds of producing SS, adjusting for disease severity as determined by FEV1 percent predicted and FEV1/FVC percent, current smoking status, age, sex, pack-years, race and the use of inhaled steroids (ICS). Effects of HS concentration, visit number and SS–IS differences for percent solids and total mucin were analyzed with a mixed-model regression using sample type as fixed and subject number as random effects. Age, race, sex, current smoking status, pack-years, FEV1 percent predicted, month of visit and inhaled corticosteroid use were evaluated as covariates. All subjects had complete data for each covariate. Only significant covariates are reported. Paired analyses on the same day of the first baseline visit utilized a paired t-test. All tests were two-sided with a 0.05 significance level. Data are presented as outlier box plots which show all data points with the box representing the 25 and 75% quartile, the horizontal red line as the median, and the “whiskers” drawn to the furthest point within 1.5 times the interquartile range.
Results
Demographics
Subject demographics are listed in . The subjects, age 31–80, were primarily white males, with a post-bronchodilator FEV1 percent predicted of 63.4 ± 20.5% and an FEV1/FVC % of 56.7 ± 15.5%. Subjects were classified by Gold Stage severity, as GOLD 0 (n = 15), GOLD 1 (n = 3), GOLD 2 (n = 28) and GOLD 3 (n = 22); there were no GOLD 4 subjects (Citation18). Current smokers were equally distributed between men and women, were 9 years younger (54 versus 63 years, p = 0.0003), and had a higher FEV1 percent predicted than former smokers (67.8 versus 59.8, p = 0.130). Subject deposition for each of the three substudies utilized in the analyses is presented in Supplementary Figure 1A.
Table 1. Screening demographics of patients with stable chronic bronchitis.
Subject sputum production and quality
Sixty-nine subjects participated in the study. Twenty-three subjects participated in more than one substudy. The total sputum samples and percent possible sputum samples obtained at each substudy baseline visit are presented in Supplementary Table 1. The likelihood of obtaining an SS sample at a study visit was 61.5% whereas the likelihood of obtaining an IS sample was 95.2%. Sex (p = 0.110) or current smoking status (p = 0.115) were not significant factors associated with the ability to produce an SS sample. Increasing age (p = 0.022) was associated with increased likelihood of producing an SS sample. FEV1 percent predicted (p = 0.026) and FEV1/FVC% (p = 0.036) were inversely associated with SS sample production. Similarly, we found an increased likelihood of producing an SS sample as subjects progressed from GOLD stage 1 to GOLD stage 4 (67–86%). Sixty-four percent of SS producers were male and fifty percent of non-producers. In four of one hundred and twenty-six IS visits (3.2%), the IS procedure was stopped for anxiety (n = 1) or declining FEV1 (n = 3).
The mean ± SD of the % SECs for the SS and IS samples for which differential cell counts were determined, is 20.4 ± 28.3% (n = 46) and 17.9 ± 22.9% (n = 81), respectively. Sixty-seven percent of the SS samples and sixty-five percent of the IS samples had less than 20% SECs. We did observe a significant inverse correlation between percent SECs and percent solids (r = −0.43, p = 0.002) for the SS samples and for the IS samples (r = −0.38, p = 0.006). There were no significant correlations of total mucin and percent SECs for either the SS or IS samples.
SS versus IS samples weights
A total of 162 SS and 121 IS samples were obtained across all baseline visits. The total expectorated sample weight for the SS samples was 0.94 ± 0.98 and 2.67 ± 2.33 g for the IS samples (Supplementary Figure 1C). Using a mixed model analysis, there were no differences in IS sample weights across the three HS concentrations; 3% = 2.35 ± 1.19 g, 4% = 2.59 ± 2.13 g and 5% = 3.16 ± 3.41 g (p = 0.209). Sample weights decreased with ICS use (p = 0.036) and increased as post-bronchodilator FEV1 percent predicted declined (p = 0.025) in the model. Age, race, sex, current smoking status, pack-years or month of visit were not significantly associated with sample weights.
Percent solids
Percent solids for each of the HS induction strengths are presented in . No significant differences in percent solids as a function of HS induction concentration were observed (p = 0.740). Therefore, percent solids measurements across all HS concentrations were used for the designated comparisons. No between-visit differences in sputum percent solids for the SS samples (p = 0.352) or the IS samples (p = 0.127) were detected (Supplementary Figures 2A and B). The percent solids measurements for all SS (n = 162) and IS (n = 121) samples is illustrated in . Mean values for the SS samples were 3.56 ± 1.95%, and the IS samples 3.08 ± 1.81%. Using a mixed model regression model (see methods), no significant difference between the SS and IS percent solids was found (p = 0.133). The covariates age, race, sex, current smoking status, pack-years, FEV1 percent predicted, month of visit and inhaled corticosteroid use were not significant in the model. Individual p values for each covariate for percent solids and total mucin are listed in Supplementary .
Figure 1. Effect of hypertonic saline concentration on induced sputum percent solids. The mean ± SD percent solids for the HS concentrations of 3, 4 and 5% are 3.13 ± 1.49 (n = 35), 3.18 ± 2.12 (n = 54) and 2.87 ± 1.59 (n = 31), respectively. There was no significant difference between the HS concentrations (p = 0.740).
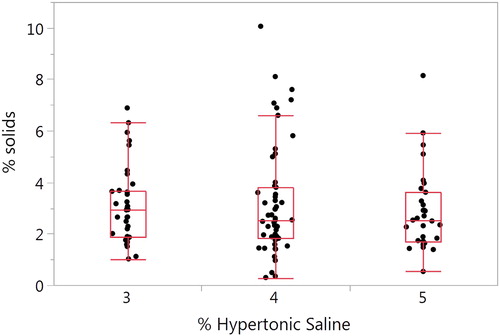
Figure 2. Comparison of SS and IS percent solids. (A) The SS mean ± SD is 3.56 ± 1.95% (n = 162) and 3.08 ± 1.81% for the IS samples (n = 121) (p = 0.133). (B) Bland–Altman plot of paired samples collected on the same visit. The SS mean ± SD is 3.46 ± 2.05 and 3.23 ± 1.76 for the IS samples (p = 0.937; n = 46). The red solid line is the mean SS–IS difference, the red dotted line ± SE and the red dashed line ± SD.
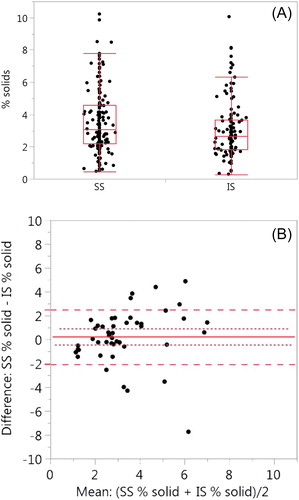
Table 2. Nucleotide concentrations in SS and IS samplesa.
We also compared the SS and IS percent solids for 46 paired samples collected on the same day. Only one pair of SS–IS samples were used per subject. SS samples was obtained prior to the IS induction (). There was no significant difference (p = 0.937) between the SS samples (3.46 ± 2.05) and the IS samples (3.23 ± 1.76).
Total mucin
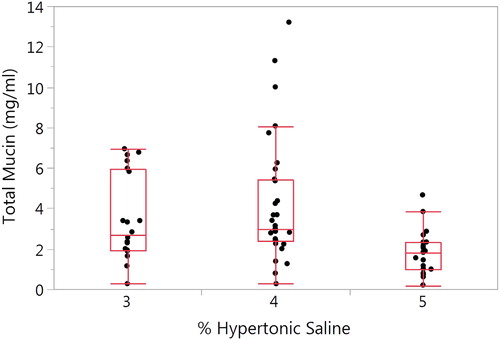
A significant overall difference (p = 0.009) in total mucin as a function of HS induction concentration was observed (). Mean ± SD values for the 3, 4, and 5% HS concentrations is 3.49 ± 2.11, 4.21 ± 3.06 and 1.85 ± 1.10, respectively (p = 0.003). No covariates were significant in the model. Total mucin concentrations for the SS and IS samples per baseline visit are presented in Supplementary Figures 3A and B. There were no significant differences between visits for either the SS (p = 0.417) or the IS samples (p = 0.749).
Figure 3. Effect of hypertonic saline concentration on induced sputum total mucin. The mean ± SD total mucin for the HS concentrations of 3%, 4 and 5% are 3.49 ± 2.11 (n = 20), 4.21 ± 3.06 (n = 31) and 1.85 ± 1.10 (n = 20), respectively. There was a significant difference between the HS concentrations (p = 0.003).
The total mucin measurements for the SS (n = 62) and IS (n = 71) samples were illustrated in . A similar trend in mucin dilution of the IS samples as with percent solids was observed. Mean values for the SS samples was 4.15 ± 3.23 mg/ml, and the IS samples 3.34 ± 2.55 mg/ml. Using the mixed model analysis described in methods, no significant difference between the SS and IS percent solids was found (p = 0.371). The covariates age, race, sex, current smoking status, pack-years, FEV1 percent predicted, month of visit and inhaled corticosteroid use were not significant.
Figure 4. Comparison of SS and IS total mucin. (A) SS mean ± SD is 4.15 ± 3.23 (n = 62) and 3.34 ± 2.55 (n = 71, p = 0.371). (B) Bland–Altman plot of paired samples collected on the same visit. The SS mean ± SD is 4.13 ± 3.02 and 4.01 ± 2.76 for the IS samples (p = 0.898; n = 18). The red solid line is the mean SS–IS difference, the red dotted line ± SE and the red dashed line ± SD.
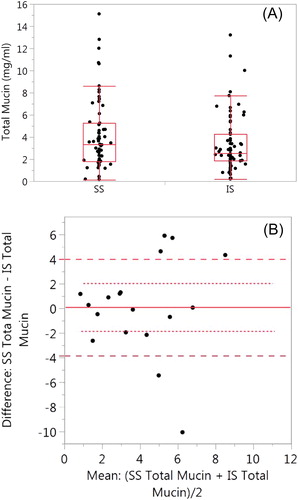
Only eighteen paired SS and IS mucin samples were collected (). Only one paired SS–IS mucin sample was used per subject. There was no significant difference (p = 0.898) between the SS samples (4.13 ± 3.02) and the IS samples (4.01 ± 2.76).
Mucus hydration and pulmonary function
The association between percent solids and FEV1 percent predicted was evaluated by mixed model analysis. Age, sex and race were not included in the model since FEV1 percent predicted includes these corrections. The association between FEV1 and percent solids was not significant (p = 0.114). Sample type (p = 0.015) and ICS use (p = 0.002) were significant in the model. Running the model separately for SS and IS or ICS use did not improve the association. Correlations of FVC percent predicted, FEV1/FVC percent and FEF25–75 percent predicted with percent solids were also evaluated (p = 0.052, p = 0.196 and p = 0.688, respectively). Sample type and ICS use were significant in each of the analyses.
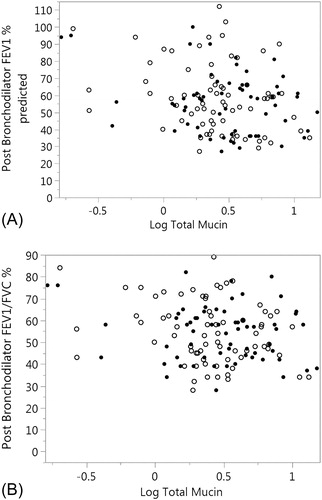
The same mixed model was used to evaluate the association between total mucin and pulmonary function (FVC percent predicted, FEV1 percent predicted, FEV1/FVC percent and FEF25-75 percent predicted). There was a trend of an inverse association between total mucin and FEV1 percent predicted (p = 0.052) and with FEF25-75 percent predicted (p = 0.068). FEV1/FVC was inversely associated with total mucin (p = 0.035) (). There were no significant covariates including ICS use and sample type. Removing the covariates from the model improved the association of total mucin with FEV1 (p = 0.015), FEV1/FVC percent (p = 0.022) and FEF25–75 (p = 0.023).
Figure 5. Association of FEV1 percent predicted and FEV1/FVC % with total mucin. (A) FEV1% predicted is plotted against log total mucin (p = 0.052). SS samples are represented by the solid circles and IS as open circles. Sample type was not significant in the model (p = 0.333). (B) FEV1/FVC % is plotted against log total mucin (p = 0.035). SS samples are represented by the solid circles and IS as open circles Sample type was not significant in the model (p = 0.275). Significances for figures A and B are computed using mixed models.
Nucleotides/nucleosides, cell counts and cytokines
Baseline ATP and metabolites are presented by sample type in . Total adenine nucleotides/nucleosides (ATP + ADP + AMP + ADO) trended higher in the SS samples, 3814.7 ± 3263.0 nM (n = 51) than the IS samples, 2904.3 ± 3050.6 nM (n = 76), but the difference was not significant (p = 0.085). There were no significant differences observed between the SS and IS samples for ATP or its metabolites.
The mean ± SD baseline differential cell counts are presented in . In general, counts as indexed by cells/mg trended lower in the IS samples, but no significant differences were detected. The percentage of each cell type was similar across SS versus IS samples. The effect of increasing HS induction concentrations on differential cell counts in the IS samples was also analyzed. Twenty-eight subjects produced sufficient sample at 3% HS, 39 at 4% HS and 19 subjects required 5% HS induction. Total cell counts (cells/mg of sputum) were not significantly different between HS induction concentrations; 2838 ± 6118 (n = 29) cells/mg at 3% HS; 4006 ± 1011 (n = 40) cells/mg at 4% and 2410 ± 1466 (n = 19) cells/mg at 5% (p = 0.607). The percent of bronchial epithelial cells progressively decreased with increasing HS concentrations from 2.8 ± (n = 26) at 3% HS to 0.8 ± 1.0 (n = 18)% at 5% HS. The percent of SECs, a possible marker of salivary contamination, was 25.3% ± 26.3 (n = 27), 13.4% ± 21.9 (n = 36) and 16.0% ± 17.2 (n = 18) for 3, 4 and 5% HS, respectively (p = 0.115).
Table 3. Differential cell counts.
A panel of cytokines was measured in a small number of SS and IS samples (). There were not enough samples to analyze differences in pairs from the same subject. Overall cytokine concentrations were not significantly different between the SS and IS samples. MIP-1α exhibited the strongest trend for SS values being higher than IS (p = 0.052). Large SD values are noted for some cytokines, e.g. IL-3.
Table 4. Baseline means of inflammatory markers.
Discussion
The hydration state of mucus is a key variable that determines the efficiency of mucus clearance in health versus disease, and is a major research focus of our group across several muco-obstructive diseases. Previous studies have related mucus hydration as measured by transbronchoscopic sampling to mucociliary clearance and FEV1 in CB subjects, suggesting mucus hydration may be a CB biomarker (Citation1). Both SS and IS offer the opportunity to non-invasively measure mucus hydration in clinical and clinical research settings. The primary purpose of this study was to compare SS and IS for the assessment of mucus hydration. Both methods of sample acquisition have limitations in that SS is often not available especially in studies of early or mild disease and IS may not be appropriate for subjects with poor pulmonary function or during exacerbations.
The data describing the probability of obtaining a SS versus IS sample in this study mirrors previous reports (Citation19, Citation20). Namely, even though all study subjects met the classical definition of CB, the probability of producing an SS sample was only 60.9% at a single visit and was not predictable based on current smoking status or sex. Although our CB subjects included some GOLD stage 0, the majority of our samples from CB subjects were classified as GOLD stages 2 and 3, most likely enhancing the ability to obtain an SS sample, but may limit the interpretation of results to early and later stage disease. The observed association of an increased likelihood of producing an SS sample with increasing age and decreasing pulmonary function probably reflects a progression to more severe disease resulting in more mucus production. Thus, for research or clinical assessments, sputum induction with hypertonic saline is reliable for obtaining samples across disease severity (Citation21).
There were significant differences in IS versus SS sample size that may be pertinent to clinical/research needs. Measuring percent solids as an index of hydration requires 0.2–0.5 g of sputum and similar sample weights are required for total mucin measurements. Measurements of cell counts and soluble inflammatory mediators require an additional 0.2–0.5 g of sample. The sample weight of an SS sample, which was virtually all usable “plug” material, was 0.9 g, at the margin of providing sufficient material for all analyses. Plug selection minimizes the selection/inclusion of saliva, which reduces squamous cell contamination and reduces the effect of dilution, which improves the quality of the sample. Approximately 50% of an IS sample is plug material (Citation22). Thus, with ∼50% of the ∼ 2.7 g IS sample weight useable by the plug selection technique, IS samples routinely provided sufficient material for all analyses.
However, there were differences in the two sample types in measures of sputum hydration. Age, sex, race, current smoking status or ICS use were not significant factors in assessing SS versus IS measures of percent solids or total mucin. From analyses of sputum percent solids content of all obtained samples, HS induction yielded IS samples that were significantly less concentrated (∼13%) compared to SS samples. Utilizing analyses of SS vs. IS sample pairs obtained at the same baseline visit, the SS sample percent solids were ∼ 11% higher than the SS samples, but not statistically significant. A similar trend was observed for total mucin concentration, with the SS samples exhibiting on average ∼ 11% higher total mucin concentrations than the IS samples. It was notable, however, that a larger dilution was observed for 5% HS induction (36%) versus 3% (27%) or 4% (14%) HS induction. Collectively, there was evidence for a modest dilution of sputum following HS induction that may be dealt with in hydration analyses, if necessary, via correction factors.
HS induction likely produces the dilution of sputum via its osmotic actions to draw water onto airway surfaces (Citation23). Indeed, recent reports have demonstrated HS induces expansion of the mucus layer as well as total airway surface liquid compartment, consistent with increased mucus hydration (dilution) of the mucus plugs selected as part of this protocol (Citation24). However, we cannot rule out that hydration was also perturbed by other mechanisms, e.g. HS-induced axonal reflexes and/or extracellular ATP release, that regulate mucus hydration (Citation25, Citation26). Finally, it is also possible that HS-induced sputum dilution reflects a broad sampling of the lung that is not a feature of SS. Specifically, CB is a heterogeneous disease with areas of marked disease (Citation27, Citation28), likely producing hyperconcentrated, abnormal mucus, in parallel with areas of normal lung with normally hydrated mucus. It is, therefore, possible IS may sample mucus from both compartments, with the mucus “added” from normal areas to mucus from diseased areas, effectively diluting the composite sample.
We do not know whether the mucoid “plug” selection technique is optimal for sputum hydration analyses. In part, this uncertainty reflects the fact that it is not known whether mucus is inherently lumpy or smooth in vivo in health or disease (Citation29, Citation30). If mucus is inherently lumpy in vivo, plug selection may only sample one component of mucus. In this context, it was striking that the sputum weight of IS samples was much larger (∼300% greater) than the SS samples, whereas the effects on plug dilution (percent solids and total mucin) was much smaller (∼13% and 11%, respectively). It is unclear whether the larger IS total weight reflects: (1) HS-mediated rehydration of abnormal mucus and restoration of clearance or (2) addition of relatively well-hydrated mucus from normal areas to mucus from diseased areas (see above). With respect to the modest dilution of selected plugs, recent data suggest that mucus gels from subjects with muco-inflammatory diseases may be cross-linked, which limits solvent-induced swelling and produces gels (plugs) with constant (“permanent”) concentrations (Citation31). The plug assessment technique, which selects “permanent” gels/plugs, may accurately detect the limited “swellability” of abnormal mucus but underestimate the effects of HS to dilute swellable (normal) mucus on the entire lung surface. Studies that directly compare the effects of dilution of the entire versus plug-selected SS versus SS samples will be required to comprehensively characterize the effects of HS induction on mucus/mucin concentration.
HS-induced inflammation, via increased inflammatory cell numbers, theoretically could also perturb sputum percent solids measurements. For example, it has been reported that HS challenge results in increased sputum neutrophils at 8 and 24 hours post-HS challenge in healthy and asthmatic subjects (Citation32, Citation33). However, an increase in neutrophils was not observed during the HS challenge period (Citation34). Regardless, to avoid inflammation-induced artifacts in our study, no IS samples were collected on successive days, and the SS samples were collected prior to IS samples. Notably, absolute neutrophil counts trended lower in the IS samples, whereas percent neutrophil values were unchanged. Collectively, these data suggest that neutrophilic inflammation was not acutely induced in our study, there was a modest dilution of neutrophil numbers by HS, and neutrophil numbers likely did not perturb percent solids measurements.
The concentration of adenine nucleotides/sides is tightly regulated in airway surface liquids to maintain normal mucus hydration (Citation15). Nucleotide release from airway epithelia is very sensitive to mechanical or osmotic stresses and inflammation. Our data did not support an accelerated release of ATP from airway epithelia in response to HS induction, either directly from the epithelium or via an ingress of neutrophils. Indeed, total nucleotides and individual adenine nucleotide/nucleoside molecules, if anything, appeared modestly diluted by HS induction.
In contrast to our previous results (Citation1), we found no relationship between percent solids of either the SS or IS sample types and pulmonary function. We attribute this to differences between bronchoscopic and SS or IS sampling, the former representative of a more distal airway sample which may correlate better with FEV1. Supporting this concept is the finding that approximately 33% of the SS and IS samples contained greater than 20% SECs suggesting significant salivary dilution. Squamous cells are one marker of potential sample dilution. Other methods of assessing dilution may need to be evaluated to assess the dilutional effect of sputum induction with HS.
Plug selection of IS samples may also reflect a composite of diseased and normal airway surfaces adding variability to the correlation with FEV1. In contrast, total mucin concentrations were inversely related to FEV1. A similar result was observed in a larger population utilizing IS and GOLD stage in subjects with CB (Citation3). The tighter association between mucins versus percent solids and muco-obstruction in CB may reflect the fact that mucins dominate the mucus layer osmotic pressures and, hence, mucus clearance. Mucins comprise ∼15% of percent solids, suggesting the percent solids measurement may contain more “noise”. The association between total mucin and FEV1 was stronger in the IS samples possibly because the IS samples and pulmonary function both represent diseased and non-diseased areas of the lung (Citation3).
Strengths of this study are that SS and IS are collected from the same subject, utilizing the same clinical research staff and a single processing center. Samples were delivered to the lab within 15 minutes of collection and processed immediately. This minimizes variability and strengthens the power to detect significant differences even with a relatively small number of subjects. Our sputum induction and sample processing procedures differ from other reported methods so the results may not apply to other techniques. For example, we stopped induction at the lowest concentration of HS that produced a usable sample (generally at least 1 g), as opposed to continuing induction through the 5 percent HS. Second we utilized the plug selection technique rather than the entire expectorated sample, which yields a smaller sample volume thus limiting the number of analyses that can be done. This is evident in the number of cytokine measures that was a lower priority for analysis when sputum volume was low. Because SS availability is not predictable and the study was not biased towards subjects that produced both sample types, paired comparisons become limiting, potentially decreasing the power to detect significant differences. A mixed model analysis optimized sample pairs adjusting for multiple samples obtained from the same subject.
Finally, both SS and IS sampling protocols should be suitable for repeat visit protocols. An analysis of percent solids for the SS and IS samples across serial baseline visits demonstrated no significance difference between visits. Collecting an SS sample at the beginning of the visit at which an IS sample was collected did not perturb the IS value as compared to IS samples collected without an antecedent SS sample (data not shown).
Conclusion
Utilizing the plug selection technique, both SS and IS samples are useful for assessing mucus hydration especially for mucin. Sputum induction with HS produces samples more reliably and in greater quantity that allows for more measurements to be completed. However, sample dilution in IS needs to be accounted for if SS and IS samples are interchangeably used in analyses. Additional studies are needed to assess the utility of non-plug selected sputum processing.
Disclosure of interest
The authors have no conflicts of interest to declare.
Notation of prior abstract publication/presentation
A portion of this data was presented at ATS: Henderson AG, Fuller F, Anderson WH, et al. Differences between spontaneous and induced sputum in Chronic Obstructive Pulmonary Disease (COPD). Am J Resp Crit Care Med 2015;191:A2914.
Ethics approval and consent to participate
This study was approved by the University Of North Carolina at Chapel Hill IRB (study # 05-2876), and all subjects provided written informed consent.
Acknowledgments
The authors would like to thank Catharina van Heusden for technical help with the HPLC-based nucleotide measurements and Eric Roe for his assistance in the manuscript preparation.
Additional information
Funding
Notes on contributors
Ashley G. Henderson
Concept, design and acquisition of data: RCB, AGH, RDC, BB, NEA, ERL, FF, MA, MR, MK. Analysis and interpretation: WHA, AC, BQ, AGH, RCB. Drafting and revising: WHA, RCB, AC, NEA. Review, comments and approval: All authors.
Wayne H. Anderson
Concept, design and acquisition of data: RCB, AGH, RDC, BB, NEA, ERL, FF, MA, MR, MK. Analysis and interpretation: WHA, AC, BQ, AGH, RCB. Drafting and revising: WHA, RCB, AC, NEA. Review, comments and approval: All authors.
Agathe Ceppe
Concept, design and acquisition of data: RCB, AGH, RDC, BB, NEA, ERL, FF, MA, MR, MK. Analysis and interpretation: WHA, AC, BQ, AGH, RCB. Drafting and revising: WHA, RCB, AC, NEA. Review, comments and approval: All authors.
Raymond D. Coakley
Concept, design and acquisition of data: RCB, AGH, RDC, BB, NEA, ERL, FF, MA, MR, MK. Analysis and interpretation: WHA, AC, BQ, AGH, RCB. Drafting and revising: WHA, RCB, AC, NEA. Review, comments and approval: All authors.
Brian Button
Concept, design and acquisition of data: RCB, AGH, RDC, BB, NEA, ERL, FF, MA, MR, MK. Analysis and interpretation: WHA, AC, BQ, AGH, RCB. Drafting and revising: WHA, RCB, AC, NEA. Review, comments and approval: All authors.
Neil E. Alexis
Concept, design and acquisition of data: RCB, AGH, RDC, BB, NEA, ERL, FF, MA, MR, MK. Analysis and interpretation: WHA, AC, BQ, AGH, RCB. Drafting and revising: WHA, RCB, AC, NEA. Review, comments and approval: All authors.
David B. Peden
Concept, design and acquisition of data: RCB, AGH, RDC, BB, NEA, ERL, FF, MA, MR, MK. Analysis and interpretation: WHA, AC, BQ, AGH, RCB. Drafting and revising: WHA, RCB, AC, NEA. Review, comments and approval: All authors.
Eduardo R. Lazarowski
Concept, design and acquisition of data: RCB, AGH, RDC, BB, NEA, ERL, FF, MA, MR, MK. Analysis and interpretation: WHA, AC, BQ, AGH, RCB. Drafting and revising: WHA, RCB, AC, NEA. Review, comments and approval: All authors.
C. W. Davis
Concept, design and acquisition of data: RCB, AGH, RDC, BB, NEA, ERL, FF, MA, MR, MK. Analysis and interpretation: WHA, AC, BQ, AGH, RCB. Drafting and revising: WHA, RCB, AC, NEA. Review, comments and approval: All authors.
Fred Fuller
Concept, design and acquisition of data: RCB, AGH, RDC, BB, NEA, ERL, FF, MA, MR, MK. Analysis and interpretation: WHA, AC, BQ, AGH, RCB. Drafting and revising: WHA, RCB, AC, NEA. Review, comments and approval: All authors.
Martha Almond
Concept, design and acquisition of data: RCB, AGH, RDC, BB, NEA, ERL, FF, MA, MR, MK. Analysis and interpretation: WHA, AC, BQ, AGH, RCB. Drafting and revising: WHA, RCB, AC, NEA. Review, comments and approval: All authors.
Bahjat Qaqish
Concept, design and acquisition of data: RCB, AGH, RDC, BB, NEA, ERL, FF, MA, MR, MK. Analysis and interpretation: WHA, AC, BQ, AGH, RCB. Drafting and revising: WHA, RCB, AC, NEA. Review, comments and approval: All authors.
Mehmet Kesimer
Concept, design and acquisition of data: RCB, AGH, RDC, BB, NEA, ERL, FF, MA, MR, MK. Analysis and interpretation: WHA, AC, BQ, AGH, RCB. Drafting and revising: WHA, RCB, AC, NEA. Review, comments and approval: All authors.
Richard C. Boucher
Concept, design and acquisition of data: RCB, AGH, RDC, BB, NEA, ERL, FF, MA, MR, MK. Analysis and interpretation: WHA, AC, BQ, AGH, RCB. Drafting and revising: WHA, RCB, AC, NEA. Review, comments and approval: All authors.
References
- Anderson WH, Coakley RD, Button B, Henderson AG, Zeman KL, Alexis NE, Peden DB, Lazarowski ER, Davis CW, Bailey S, et al. The relationship of mucus concentration (hydration) to mucus osmotic pressure and transport in chronic bronchitis. Am J Respir Crit Care Med. 2015;192(2):182–90. doi:10.1164/rccm.201412-2230OC.
- Button B, Anderson WH, Boucher RC. Mucus hyperconcentration as a unifying aspect of the chronic bronchitic phenotype. Ann Am Thorac Soc. 2016;13(suppl 2):S156–S162.
- Kesimer M, Ford AA, Ceppe A, Radicioni G, Cao R, Davis CW, Doerschuk CM, Alexis NE, Anderson WH, Henderson AG, et al. Airway mucin concentration as a marker of chronic bronchitis. N Engl J Med. 2017;377(10):911–22. doi:10.1056/NEJMoa1701632.
- Pizzichini E, Pizzichini MM, Efthimiadis A, Evans S, Morris MM, Squillace D, Gleich GJ, Dolovich J, Hargreave FE. Indices of airway inflammation in induced sputum: reproducibility and validity of cell and fluid-phase measurements. Am J Respir Crit Care Med. 1996;154(2 Pt 1):308–17. doi:10.1164/ajrccm.154.2.8756799.
- Holz O, Jorres RA, Koschyk S, Speckin P, Welker L, Magnussen H. Changes in sputum composition during sputum induction in healthy and asthmatic subjects. Clin Exp Allergy 1998;28(3):284–92.
- Fujimoto K, Yasuo M, Urushibata K, Hanaoka M, Koizumi T, Kubo K. Airway inflammation during stable and acutely exacerbated chronic obstructive pulmonary disease. Eur Respir J. 2005;25(4):640–6. doi:10.1183/09031936.05.00047504.
- Bhowmik A, Seemungal TAR, Sapsford RJ, Wedzicha JA. Relation of sputum inflammatory markers to symptoms and lung function changes in COPD exacerbations. Thorax 2000;55(2):114–20. doi:10.1136/thorax.55.2.114.
- Alexis NE, Hu SC, Zeman K, Alter T, Bennett WD. Induced sputum derives from the central airways: confirmation using a radiolabeled aerosol bolus delivery technique. Am J Respir Crit Care Med 2001;164(10 Pt 1):1964–70. doi:10.1164/ajrccm.164.10.2104051.
- Chang AB. The physiology of cough. Paediatr Respir Rev. 2006;7(1):2–8. doi:10.1016/j.prrv.2005.11.009.
- Tangedal S, Aanerud M, Persson LJ, Brokstad KA, Bakke PS, Eagan TM. Comparison of inflammatory markers in induced and spontaneous sputum in a cohort of COPD patients. Respir Res. 2014;15:138.
- Bhowmik A, Seemungal TA, Sapsford RJ, Devalia JL, Wedzicha JA. Comparison of spontaneous and induced sputum for investigation of airway inflammation in chronic obstructive pulmonary disease. Thorax 1998;53(11):953–6.
- Sethi S, Muscarella K, Evans N, Klingman KL, Grant BJ, Murphy TF. Airway inflammation and etiology of acute exacerbations of chronic bronchitis. Chest 2000;118(6):1557–65.
- Knowles MR, Robinson JM, Wood RE, Pue CA, Mentz WM, Wager GC, Gatzy JT, Boucher RC. Ion composition of airway surface liquid of patients with cystic fibrosis as compared with normal and disease-control subjects. J Clin Invest. 1997;100(10):2588–95. doi:10.1172/JCI119802.
- Henderson AG, Ehre C, Button B, Abdullah LH, Cai LH, Leigh MW, DeMaria GC, Matsui H, Donaldson SH, Davis CW, et al. Cystic fibrosis airway secretions exhibit mucin hyperconcentration and increased osmotic pressure. J Clin Invest. 2014;124(7):3047–60. doi:10.1172/JCI73469.
- Lazarowski ER, Tarran R, Grubb BR, van Heusden CA, Okada S, Boucher RC. Nucleotide release provides a mechanism for airway surface liquid homeostasis. J Biol Chem. 2004;279(35):36855–64. doi:10.1074/jbc.M405367200.
- Fry RC, Rager JE, Zhou H, Zou B, Brickey JW, Ting J, Lay JC, Peden DB, Alexis NE. Individuals with increased inflammatory response to ozone demonstrate muted signaling of immune cell trafficking pathways. Respir Res. 2012;13:89. doi:10.1186/1465-9921-13-89.
- Weiszhar Z, Horvath I. Induced sputum analysis: step by step. Breathe 2013;9(4):300–6. doi:10.1183/20734735.042912.
- Vogelmeier CF, Criner GJ, Martinez FJ, Anzueto A, Barnes PJ, Bourbeau J, Celli BR, Chen R, Decramer M, Fabbri LM, et al. Global strategy for the diagnosis, management, and prevention of chronic obstructive lung disease 2017 report. GOLD Executive Summary. Am J Respir Crit Care Med 2017;195(5):557–82. doi:10.1164/rccm.201701-0218PP.
- Tsoumakidou M, Tzanakis N, Siafakas NM. Induced sputum in the investigation of airway inflammation of COPD. Respir Med. 2003;97(8):863–71. doi:10.1016/S0954-6111(03)00035-0.
- Parr DG, White AJ, Bayley DL, Guest PJ, Stockley RA. Inflammation in sputum relates to progression of disease in subjects with COPD: a prospective descriptive study. Respir Res. 2006;7(1):136.
- Pavord ID, Pizzichini MM, Pizzichini E, Hargreave FE. The use of induced sputum to investigate airway inflammation. Thorax 1997;52(6):498–501.
- Alexis NE, Wells H, Siperly E, Goldstein B, Henderson AG, Peden DB. Baseline sputum parameters in normals, asthmatics, COPD, atopics, smokers and ex-smokers. J Allergy Clin Immunol. 2016;137(2):AB208. doi:10.1016/j.jaci.2015.12.1121.
- Goralski JL, Boucher RC, Button B. Osmolytes and ion transport modulators: new strategies for airway surface rehydration. Curr Opin Pharmacol 2010;10(3):294–9. doi:10.1016/j.coph.2010.04.003.
- Goralski JL, Wu D, Thelin WR, Boucher RC, Button B. The in vitro effect of nebulised hypertonic saline on human bronchial epithelium. Eur Respir J. 2018;51(5):1702652 [https://doi.org/10.1183/13993003.02652-2017].
- Jongejan RC, De Jongste JC, Raatgeep RC, Bonta IL, Kerrebijn KF. Effects of changes in osmolarity on isolated human airways. J Appl Physiol. 1990;68(4):1568–75.
- Baraniuk JN. Neural regulation of mucosal function. Pulm Pharmacol Ther. 2008;21(3):442–8. doi:10.1016/j.pupt.2007.06.006.
- Ley-Zaporozhan J, Ley S, Kauczor H-U. Morphological and functional imaging in COPD with CT and MRI: present and future. Eur Radiol. 2008;18(3):510–21. doi:10.1007/s00330-007-0772-1.
- Sheikh K, Coxson HO, Parraga G. This is what COPD looks like. Respirology 2016;21(2):224–36. doi:10.1111/resp.12611.
- Van As A, Webster I. The morphology of mucus in mammalian pulmonary airways. Environ Res. 1974;7(1):1–12. doi:10.1016/0013-9351(74)90071-1.
- Sturgess JM. The mucous lining of major bronchi in the rabbit lung. Am Rev Respir Dis. 1977;115(5):819–27.
- Yuan S, Hollinger M, Lachowicz-Scroggins ME, Kerr SC, Dunican EM, Daniel BM, Ghosh S, Erzurum SC, Willard B, Hazen SL, et al. Oxidation increases mucin polymer cross-links to stiffen airway mucus gels. Sci Transl Med. 2015;7(276):276ra27. doi:10.1126/scitranslmed.3010525.
- Nightingale JA, Rogers DF, Barnes PJ. Effect of repeated sputum induction on cell counts in normal volunteers. Thorax 1998;53(2):87–90. doi:10.1136/thx.53.2.87.
- Holz O, Richter K, Jorres RA, Speckin P, Mucke M, Magnussen H. Changes in sputum composition between two inductions performed on consecutive days. Thorax 1998;53(2):83–6.
- Moodley YP, Krishnan V, Lalloo UG. Neutrophils in induced sputum arise from central airways. Eur Respir J. 2000;15(1):36–40.