
Abstract
The relationship of body mass index (BMI) with lung function and COPD has been previously described in several high-income settings. However, few studies have examined this relationship in resource-limited settings where being underweight is more common. We evaluated the association between BMI and lung function outcomes across 14 diverse low- and middle-income countries. We included data from 12,396 participants aged 35–95 years and used multivariable regressions to assess the relationship between BMI with either COPD and lung function while adjusting for known risk factors. An inflection point was observed at a BMI of 19.8 kg/m2. Participants with BMI < 19.8 kg/m2 had a 2.28 greater odds (95% CI 1.83–2.86) of having COPD and had a 0.21 (0.13–0.30) lower FEV1 and 0.34 (0.27–0.41) lower FEV1/FVC z-score compared to those with BMI ≥ 19.8 kg/m2. The association with lung function remained even after excluding participants with COPD. Individuals with lower BMI were more likely to have COPD and had lower lung function compared to those in higher BMI. The association with lung function remained positive even after excluding participants with COPD, suggesting that being underweight may also play a role in having worse lung function.
Introduction
COPD is a chronic respiratory disease marked by fixed, nonreversible airflow obstruction and is the third leading cause of death globally (Citation1–3). The vast majority of morbidity and mortality related to COPD occurs in low- and middle-income countries (LMICs) where the burden of disease is expected to rise over the next decade (Citation3). COPD is a largely heterogeneous disease with different phenotypic expression and outcomes. While the phenotypes and risk factors for COPD have been well described in high-income settings, less is known about risk factors for COPD and phenotypes in LMICs where other more prevalent exposures, such as biomass fuel smoke, that can predispose individuals to COPD (Citation4).
Body mass index (BMI) is associated with COPD, FEV1 decline and mortality in high-income countries (HIC) (Citation1,Citation5,Citation6). BMI is an important component in prognostic tools for COPD-related mortality such as the Body mass index, airflow Obstruction, Dyspnea and Exercise capacity (BODE) or Age, Dyspnea and airflow Obstruction (ADO) indexes in high income settings (Citation1,Citation7). Previous studies in HICs have demonstrated the risk of COPD is associated with BMI, and COPD severity is higher in lower BMI categories (Citation8). In contrast, the relationship between BMI and COPD in LMIC settings, where being underweight is more common, is not as well defined (Citation4). Individuals in LMICs have unique nutrition-related risk factors, which predispose to poor lung health over the course of the lifespan. Maternal malnutrition and micronutrient deficiencies in childhood have been associated with lower levels of lung function in and higher rates of COPD in adulthood (Citation9).
In this study, we sought to describe the relationship between BMI and lung function outcomes among fourteen low- and middle-income settings in Argentina, Bangladesh, Chile, Peru, Uganda, and Uruguay. Our sample encompassed sites with a diversity of geographies, ethnicities, variations in altitude, and degrees of urbanization.
Methods
Study setting
This study utilized pooled data from multiple population-based studies spanning six countries and thirteen cities in Latin America, Africa and Asia (Citation10–13). The Pulmonary Risk in South America (PRISA) study was conducted by the Institute for Clinical Effectiveness and Health Policy, the CRONICAS (Spanish for chronic) study was conducted by the CRONICAS Center of Excellence for Chronic Diseases at Universidad Peruana Cayetano Heredia, the Bangladesh study was conducted by the Center for Control of Chronic Diseases (CCD) at icddrb, the Lung Function in Nakaseke and Kampala (LiNK) study was conducted by the Johns Hopkins University and Makerere University, and the FRESH AIR study was conducted by the University of Groningen and Makerere University (Citation10–13). Further details about the study populations can be found in previous publications and in (Citation10–15). All countries included were low- to middle-income countries at the date of data collection (PRISA: Argentina, Chile, Uruguay; CRONICAS: Peru; CCD study: Bangladesh; LiNK: Uganda; FRESH AIR: Uganda). Specifically, data from Argentina, Chile, and Uruguay were collected in 2011 when these countries were considered middle-income by World Bank classification.
Table 1: Sociodemographic characteristics stratified by site.
Study design
Both the PRISA and CRONICAS studies used age- and sex-stratified random sampling while the Bangladesh study used simple random sampling of available census data at each site. The LiNK study used a sampling technique outlined by the WHO Expandable Program on Immunization, while the FRESH AIR study used a multi-level sampling approach (Citation10–14,Citation16,Citation17). Adults between the ages of 35 to 95 years were included for analysis due to restrictions of reference equations for adults beyond 95 years (Citation18). All studies obtained informed consent and required confidentiality training for field workers (Citation10–14).
Spirometry
Spirometry was conducted using American Thoracic Society and European Respiratory Society guidelines (Citation19). PRISA, CRONICAS, LiNK, and the Bangladesh utilized Easy-On PC (ndd), while the FRESH AIR study used Pneumotrac (Vitalograph) spirometers (Citation10–13). Post-bronchodilator readings were taken on all individuals in PRISA and CRONICAS studies, while FRESH AIR and LiNK conducted post-bronchodilator spirometry on those who screened positive for obstruction on pre-bronchodilator spirometry (FEV1/FVC ≤ 0.7 in FRESH AIR and the Bangladesh studies, and FEV1/FVC ≤ lower limit of normal in LiNK).
Definitions
We used the Global Lung Function Initiative 2012 (GLI2012) mixed ethnic reference population to calculate z-scores for lung function (Citation18). We refer to forced expiratory volume at 1 second (FEV1) or forced vital capacity (FVC) as forced expiratory volumes (FEVs). For this analysis, COPD was defined as having a post-bronchodilator FEV1/FVC that was 1.64 SDs below the mean (i.e., z-score < −1.64). BMI was defined as weight/height2 (kg/m2). Underweight, normal, overweight, and obese individuals were classified as having a BMI between 0–18.5, 18.5–24.9, 25–29.9, and ≥30 kg/m2, respectively (Citation20). COPD severity was stratified into mild, moderate, severe, and very severe using percent predicted FEV1 values based on GOLD criteria (Citation2). Participants were also considered to have symptomatic COPD if they had wheeze, cough, or phlegm currently or in the last 12 months. Daily smoking was defined as having one or more cigarette/day, biomass use was defined as using biomass fuel as the primary source for cooking, and education was defined as having completed secondary education or higher.
Biostatistical methods
The main objectives of this study were to analyze associations between BMI and lung function outcomes, including COPD as defined by post-bronchodilator spirometry and pre-bronchodilator FEVs. We limited our analysis to pre-bronchodilator FEVs because two of the study sites (Bangladesh and Uganda) only administered a bronchodilator to individuals who demonstrated obstruction on screening (Citation12,Citation13). We also conducted secondary analyses to assess the association between BMI and other COPD outcomes, namely severity and the presence of concomitant respiratory symptoms, and pre-bronchodilator FEVs.
We used alternating logistic regression (ALR) models to model the odds of COPD and linear mixed-effects (LME) models to model lung function as function of BMI. All models adjusted for age, sex, daily smoking, self-reported biomass fuel use, education level, and history of tuberculosis (Citation21,Citation22). We chose ALR and LME models because they allowed us to address the potential of having non-independence due to intra-site correlation (Citation21,Citation22). In our study, we used ALR to model the intra-site correlation with pairwise odds ratios and to model heterogeneity among sites with a random intercept and random slopes. We used natural cubic splines of BMI to investigate the potential non-linear relationships with either COPD or lung function (Citation23). We also investigated potential effect modification by sex, age (≥55 or <55 years), self-reported biomass fuel smoke exposure, self-reported daily cigarette smoking, and having secondary education.
We used area under the receiver operating curve (AUC) estimates from multivariable logistic regressions for varying BMI cutoffs to help choose a BMI cutoff that most accurately represents the underlying associations (Citation24). Similarly, we plotted normalized mean squared error (nMSE) estimates for varying FEV1/FVC cutoffs to assess consistency with logistic regression models (Citation25). For secondary analyses, we used multivariable random effects ordinal logistic regressions to examine the association between BMI and COPD severity (none, mild, moderate, or severe/very severe COPD) or symptomatic COPD (none, asymptomatic COPD, and symptomatic COPD) adjusted for confounders.
Sensitivity analyse were performed by: using the GLI2012 Caucasian reference values; performing leave-one-out analysis by site, analyzing BMI broken down by WHO categories with normal weight as reference; excluding COPD positive individuals from pre-bronchodilator FEVs regression models to avoid the possibility of reverse causality; limiting analyses to people without severe or very-severe COPD; and, using logistic mixed effects models to check for robustness of our model selection when analyzing odds of COPD. Analyses were performed in R version 3.4.4 (www.r-project.org) using the lme4, alr, ggplot2, and gmodels packages (Citation26).
Results
Population characteristics
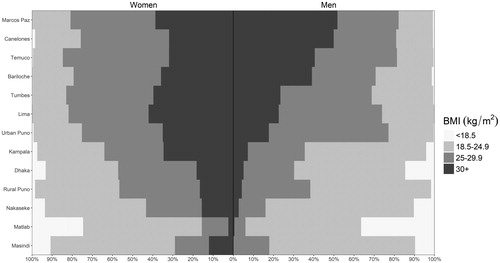
A total of 13,023 participants had data available, however, 12,396 met eligibility criteria and were included for analysis. Data were collected across five countries spanning Latin America, Southeast Asia, and Sub-Saharan Africa. People in this study had an average age of 54.9 years (range of mean age across settings 44.2–59.6 years), were 48.5% women (range of proportions across settings 38.3%–54.5%), and 38.3% completed secondary education or higher (range of proportions across settings 7.1%–71.0%). Among our study sample, 7.2% of participants were underweight, 36.0% were normal weight, 32.6% were overweight, and 24.2% were obese; however, there was also heterogeneity across sites and sex (). Average BMI was 26.4 kg/m2, ranging from 20.6 kg/m2 in Matlab to 30.1 kg/m2 in Marcos Paz. There was no difference in prevalence of COPD (p = 0.97) between those who are included or excluded from our analyses; however, participants included in this analysis were younger on average (46.0 years vs. 54.9 years, p < 0.001), had fewer men (48.5% vs. 54.9%; p = 0.002), and had lower BMI on average (25.3 kg/m2 vs. 26.4 kg/m2, p < 0.001) than those who were excluded from the analysis.
Figure 1. Sex-, site- and category-stratified prevelances of Body Mass Index (BMI). The prevalence of BMI was stratified by sex (women on the left, men on the right) and WHO classification for underweight, normal, overweight, and obese individuals (BMI between 0–18.5, 18.5–25, 25–30, and over 30 kg/m2, respectively) across the 13 LMIC sites. Sites were ordered according to the overall prevalence of Obesity in Men from highest (top) to lowest (bottom).
Body mass index and COPD outcomes
The overall prevalence of COPD was 8.8%, ranging from 1.7% in Kampala, Uganda to 15.5% in Masindi, Uganda. Among the 1,091 COPD positive participants, 394 (36.1%) were mild, 524 (48.0%) were moderate, 143 (13.1%) were severe, and 30 (2.7%) were very severe. Prevalence of COPD was highest among those with BMI <18.5 kg/m2 and was progressively lower as with higher BMI (Supplementary material ). It was also apparent that among the lowest BMI category in Supplementary material , men had a higher prevalence of COPD than women (31.3% vs 14.8%, respectively, p < 0.001).
We observed an inflection point for BMI at 19.8 kg/m2, such that the probability of having COPD increased at a faster pace at lower BMIs prior to this threshold in both single variable and multivariable logistic regression analysis (). We found complimentary results when using multivariable logistic regression and the AUC as a measure for the area under the Receiver Operating Characteristic curve, with highest predictive accuracy occurring around the 19.5–20.0 kg/m2 (Supplementary material ). In multivariable regression analysis, participants with BMI <19.8 kg/m2 were 2.28 times (95% CI 1.83–2.86) more likely to have COPD compared to those with BMI ≥ 19.8 kg/m2. We plotted interaction effects between BMI and potential effect modifiers on the odds of having COPD (). We found that the association between having a BMI < 19.8 kg/m, and COPD was greater among those with primary education or less (OR = 2.47, 1.97–3.11) vs. secondary education or higher (OR = 1.69, 1.25–2.27) when compared to those with BMI ≥ 19.8 kg/m2. Additionally, participants with BMI <19.8 kg/m2 had higher odds of having more severe COPD (adjusted OR = 2.30, 95% CI 1.92–2.77) or having more symptoms (adjusted OR = 2.27, 1.89–2.72) when compared to those with BMI ≥ 19.8 kg/m2.
Figure 2. Body mass index vs. the probability of having COPD in our sample. We plotted probabilities from a multivariable adjusted model (solid line), single-variable non-adjusted model (broken line), and binned probabilities with corresponding 95% confidence intervals. The multivariable model was adjusted for age, sex, daily cigarette smoking, level of education completed, and post-treatment pulmonary tuberculosis.
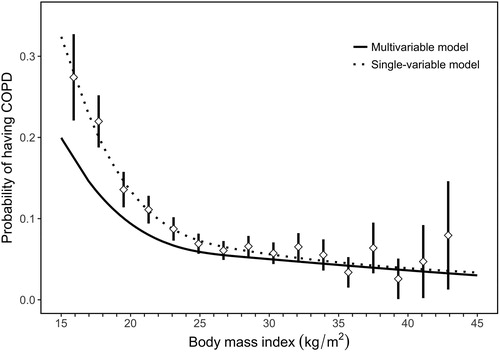
Figure 3. Associations between low body mass index (BMI < 19.8 kg/m2) and COPD outcomes obtained from multivariable regression models, and interaction effects with sex, smoking status, biomass use, age, and educational attainment. Panel A shows estimates using data from all sites, while panel B shows site-specific estimates. In panel A, odds ratios and the corresponding 95% confidence intervals are represented by diamonds and lines, respectively. We also tabulated numerical values for the odds ratios and the corresponding 95% confidence intervals. In panel B, site-specific odds ratios are presented by triangles. In the overall model, we evaluated the association between having a BMI < 19.8 kg/m2 and COPD prevalence adjusted for age, sex, biomass use, daily cigarette smoking, previous pulmonary tuberculosis, and secondary education. We then assessed for interaction effects between having a BMI < 19.8 kg/m2 and either sex, smoking status, biomass use, age, or educational attainment on COPD outcomes. Models stratified by sex were adjusted for age, daily cigarette smoking, biomass, previous pulmonary tuberculosis, and secondary education. Models stratified by smoking status were adjusted for age, sex, biomass, previous pulmonary tuberculosis, and secondary education. Models stratified by biomass use were adjusted for sex, daily cigarette smoking, previous pulmonary tuberculosis, and secondary education. Models stratified by age were adjusted for sex, daily cigarette smoking, biomass, previous pulmonary tuberculosis, and secondary education. Models stratified by educational attainment were adjusted for age, sex, daily cigarette smoking, biomass, and previous pulmonary tuberculosis. Models with severity and symptom status of COPD as outcomes were adjusted for age, sex, daily cigarette smoking, biomass, previous pulmonary tuberculosis, and secondary education.
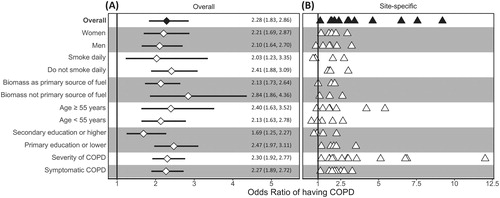
In sensitivity analyses, we found that using the GLI2012 Caucasian reference population did not affect the direction of reported exposure-outcome associations (Supplementary material Tables E1 and E2). Using the WHO BMI categories with normal weight as reference revealed consistent results, with underweight participants having increased odds of COPD and overweight or obese participants having decreased odds of COPD (Supplementary material Table E3). Leave-one-site-out analysis revealed that no single site influenced the association between having a BMI < 19.8 kg/m2 and COPD compared with other sites (Supplementary material Table E4). Moreover, for each site we found that having BMI < 19.8 kg/m2 was consistently associated with increased odds of COPD when compared to those with BMI ≥ 19.8 kg/m2 ( and Supplementary material Table E5).
Body mass index and lung function
We plotted BMI (kg/m2) vs. pre-bronchodilator FEV1/FVC z-scores with individual boxplots per each unit of BMI (), and found that participants with lower BMI also had lower FEV1/FVC z-scores. This finding was consistent in multivariable analysis ( and Supplementary material ). On average, participants with more extreme values of BMI, i.e., underweight or obese, had lower pre-bronchodilator FEV1 and FVC (). When using multivariable linear regression and the plotting the nMSE estimates at varying BMI cutoffs (Supplementary material ), we observed the highest predictive accuracy around 19.5–20.0 kg/m2. This range shifted to around 22.0–22.5 kg/m2 when COPD positive participant were removed from analysis (Supplementary material ). In multivariable adjusted analysis, we found that participants with BMI < 19.8 kg/m2 had 0.21 (95% CI 0.13–0.30) lower FEV1 z-scores and 0.34 (95% CI 0.27–0.41) lower FEV1/FVC z-scores compared to those with BMI ≥19.8 kg/m2. We observed no difference in pre-bronchodilator z-scores for FVC (−0.04, 95% CI −0.13 to 0.04). These effects remained significant but were slightly lower in magnitude when participants with COPD positive excluded from analyses. Specifically, we found that participants with BMI < 19.8 kg/m2 had 0.09 (95% CI 0.01–0.18) lower FEV1 z-scores and 0.08 (95% CI 0.02–0.14) lower FEV1/FVC z-scores compared to those with BMI ≥ 19.8 kg/m2, with no observable difference in FVC z-scores (−0.07; 95% CI −0.16 to 0.02).
Figure 4. Body mass index vs. pre-bronchodilator FEV1/FVC z-scores. Crude lung function values were plotted behind boxplots. Each boxplot encompasses values within one-unit of BMI (i.e., 1 kg/m2). We included a broken red line at a pre-bronchodilator FEV1/FVC z-score of −1.64 to help visualize which values are below the lower limit of normal (bottom 5th percentile).
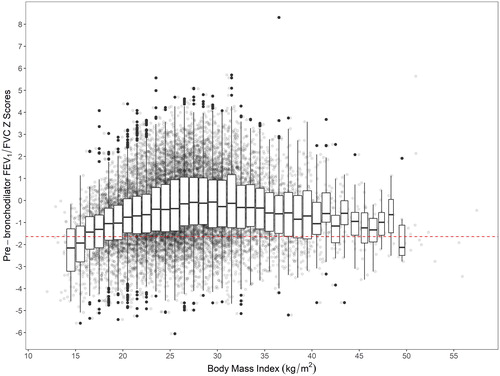
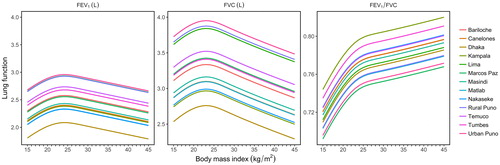
Figure 5. Body mass index vs. fitted values for FEV1, FVC, and FEV1/FVC, stratified by site. All models were adjusted for age, sex, daily cigarette smoking, level of education completed, and previous pulmonary tuberculosis. We used linear mixed-effects models with random intercepts by site.
Discussion
In this multi-country population-based study, we found that individuals who were both underweight and overweight had worse lung function outcomes. Although low BMI may be the result of cachexia secondary to COPD as demonstrated in high-income settings, we conducted sensitivity analysis by excluding individuals with COPD and found a similar relationship between lung function and low BMI across the sites (Citation27). We examined the relationship between BMI and lung function continuously, demonstrating an inflection point at which this change occurs. A similar inflection point but with a parabolic curve occurred for lung function as measured by FEV1 and FVC suggesting that both under- and over-nutrition have deleterious effects of lung function. These models were adjusted for environmental, lifestyle, and socioeconomic variables, suggesting that this non-linear association between BMI and lung function was present above and beyond a priori risk factors. While tobacco smoking is a major risk factor for COPD and lung function decline in high income settings, having low BMI (i.e., underweight or <19.8 kg/m2) may be a potential risk factor for both poor lung function and COPD in LMIC settings.
The prevalence of obesity in our LMIC settings is comparable to that of high-income settings. We found that 56.8% of our sample was overweight or obese with a BMI ≥ 25 kg/m2 (ranging from 11.2% in Matlab to 82.9% in Temuco) compared to 70.7% in the US, reflecting the nutritional transition occurring in many LMICs (Citation28). The Latin American Project for the Investigation of Obstructive Lung Disease (PLATINO) investigators found higher rates of obesity among the South American population studied than the present analysis, possibly reflecting the urban settings where PLATINO was conducted (Citation29). The percentage of underweight individuals is higher in the sampled LMIC settings. 7.2% of individuals in our sample were underweight with a BMI < 18.5 kg/m2 compared to a rate of 1.7% in the US. We found similar rates of underweight individuals in the overall population when compared to other studies in LMICs (Citation29,Citation30). Although the PLATINO investigators demonstrated an association between low BMI and COPD, BMI was analyzed as a categorical variable (Citation29). This study utilizes BMI as a continuous variable, gaining valuable information (inflection at specific BMI) that could potentially influence medical interventions by targeting individuals among more specific BMI ranges.
Few studies in high-income settings and none in low-income settings have analyzed BMI and lung function as continuous values at a population-level. The CARDIA study examined lung function longitudinally over a 10-year period and found FEV1 to decrease with increasing weight across BMI categories (Citation31). Although lung function in high-income settings appears to worsen with increasing BMI, the opposite is true of COPD-related mortality, probably a result of cachexia from advanced disease. The Copenhagen City Heart Study showed that among COPD positive individuals, relative risk of COPD-related mortality was greatest among those in the lowest BMI category (<20.0 kg/m2) (Citation8). Relative risk seemed to plateau after individuals reached the next BMI category (20.0–24.9 kg/m2), with small to no change in relative risk with increasing BMI after this point (Citation8). The results of the Copenhagen City Heart Study informed the development of the BODE index which included a cutoff of ≤21.0 kg/m2 for increased risk of death among those with COPD (Citation27). Our results demonstrated a similar inflection at 19.8 kg/m2.
Nutritional status and socioeconomic status have been proposed as important risk factors alongside household and ambient air pollution in LMICs (Citation32). While a lower BMI may be protective for declined lung function in high-income populations, we found the opposite to be true among populations in low- and middle-income countries (Citation31). Compared to HICs, lower BMI in LMICs is more likely to represent poorer overall nutritional status and micronutrient deficiencies. Nutrition across the lifespan has been linked to FEV1 (Citation9). Antenatal and childhood micronutrient supplementation with Vitamin A, D, and E have all been studied in relationship to subsequent childhood lung function, albeit with mixed results (Citation33,Citation34). While Vitamin A is thought to play a role in fetal lung development, Vitamin E and C are thought to provide antioxidant functions which decrease inflammatory state leading to lung function decline (Citation35). Cross-sectional studies have demonstrated lower levels of lung function among individuals with reduced Vitamin C and E intake (Citation35).
In high-income populations, obesity has been associated with faster lung function decline when compared with underweight individuals (Citation31). Higher BMI has been known to reduce both FEV1 and FVC due to decreasing lung wall compliance, though elevated BMI has mixed effects with the FEV1/FVC ratio (Citation31). As people grow older, decreased lung elasticity results in lower FEV1/FVC ratio. However, among those with an elevated BMI, the FEV1/FVC ratio may be higher due to greater effects of obesity on FVC than FEV1. Additionally, obesity has been linked to a range of cytokines including increased levels of TNF-alpha, IL-6 and decreased levels of adiponectin which result in a proinflammatory state (Citation31,Citation36,Citation37). Similarly, lower levels of cytokines and baseline inflammation among those with lower BMI in high income settings has been postulated as protective for future lung function decline (Citation31).
There were several limitations in our study. First, we were limited in our adjustment of SES, a known independent risk factor for COPD and lung function which is also associated with BMI (Citation14). Second, the Global Lung Function Initiative mixed ethnic lung reference population used for diagnosis of COPD may not accurately represent all individuals in our study. Because of this, we performed sensitivity analysis using GLI Caucasian reference population which showed results consistent with that of the GLI mixed ethnic population. Third, understanding a causal relationship between BMI and COPD is limited by the cross-sectional nature of our sample. Also, severe COPD is known to result in poor nutritional status and lower BMI. Due to this, we performed sensitivity analysis by removing individuals with COPD, again showing results consistent with our main analysis. Fourth, we do not have information about early life exposures in our study participants which may affect lung function trajectories. Early life exposures—such as in utero and childhood exposures including micronutrient deficiencies, air pollution, cigarette smoking, and childhood pneumonia—play a critical role in lung function development and may be as important as exposures experienced during adulthood in the development of COPD.
Our study also had some strengths. While the association between COPD and BMI has been previously described, we provide new insights using statistical methods that capture a non-linear relationship between BMI and either the odds of COPD or lung function. Furthermore, this study utilized a large and diverse sample with properly harmonized variables, allowing for the adjustment of a priori risk factors for COPD (e.g., smoking and using biomass fuels). Also, we used the most current, more accurate definition for COPD diagnosis (FEV1/FVC ≤ lower limit of normal) instead of the fixed-cutoff method (Citation38).
Conclusions
The results of this large, multi-country analysis further characterizes the association between body mass index and lung function outcomes. Underweight individuals had lower lung function compared to those with higher BMI ranges, even after excluding participants with COPD from the analysis. While COPD is well known to be a systemic disease that leads to cachexia, our data also suggests that low body mass index is independently associated with lower lung function. Specifically, undernutrition as measured by a low body mass index may be associated with worse lung function outcomes in adults living in low- and middle-income country settings.
Declaration of interest
Dr. Jones reports grants, personal fees and non-financial support from Astra Zeneca, personal fees from Boehringher Ingelheim, personal fees from Chiesi, personal fees and non-financial support from GSK, personal fees from Novartis, personal fees from Pfizer, personal fees from Nutricia, outside the submitted work. All other authors report no conflicts of interest.
Supplemental Material
Download PDF (4 MB)Additional information
Funding
References
- Celli BR, Cote CG, Marin JM, et al. The body-mass index, airflow obstruction, dyspnea, and exercise capacity index in chronic obstructive pulmonary disease. N Engl J Med. 2004;350:1005–1012. doi: 10.1056/NEJMoa021322.
- Vestbo J, Hurd SS, Agusti AG, et al. Global strategy for the diagnosis, management, and prevention of chronic obstructive pulmonary disease: GOLD executive summary. Am J Respir Crit Care Med. 2003;187:347–365. doi: 10.1164/rccm.201204-0596PP.
- Vos T, Flaxman AD, Naghavi M, et al. Years lived with disability (YLDs) for 1160 sequelae of 289 diseases and injuries 1990-2010: a systematic analysis for the Global Burden of Disease Study 2010. Lancet 2012;380:2163–2196. doi: 10.1016/S0140-6736(12)61729-2.
- Burney P, Jarvis D, Perez-Padilla R. The global burden of chronic respiratory disease in adults. Int J Tuberc Lung Dis. 2015;19:10–20. doi: 10.5588/ijtld.14.0446.
- Garcia-Aymerich J, Gómez FP, Benet M, et al; PAC-COPD Study Group. Identification and prospective validation of clinically relevant chronic obstructive pulmonary disease (COPD) subtypes. Thorax 2011;66:430–437. doi: 10.1136/thx.2010.154484.
- Harik-Khan RI, Fleg JL, Wise RA. Body mass index and the risk of COPD. Chest 2002;121:370–376.
- Puhan MA, Hansel NN, Sobradillo P, et al; International COPD Cohorts Collaboration Working Group. Large-scale international validation of the ADO index in subjects with COPD: an individual subject data analysis of 10 cohorts. BMJ Open 2012;2:e002152. doi: 10.1136/bmjopen-2012-002152.
- Landbo C, Prescott E, Lange P, et al. Prognostic value of nutritional status in chronic obstructive pulmonary disease. Am J Respir Crit Care Med. 1999;160:1856–1861. doi: 10.1164/ajrccm.160.6.9902115.
- Checkley W, Pollard SL, Siddharthan T, et al. Managing threats to respiratory health in urban slums. Lancet Respir Med. 2016;4:852–854. doi: 10.1016/S2213-2600(16)30245-4.
- Jaganath D, Miranda JJ, Gilman RH, et al; CRONICAS Cohort Study Group. Prevalence of chronic obstructive pulmonary disease and variation in risk factors across four geographically diverse resource-limited settings in Peru. Respir Res. 2015;16:40.
- Rubinstein AL, Irazola VE, Bazzano LA, et al. Detection and follow-up of chronic obstructive pulmonary disease (COPD) and risk factors in the Southern Cone of Latin America: the pulmonary risk in South America (PRISA) study. BMC Pulm Med. 2011;11:34.
- van Gemert F, Kirenga B, Chavannes N, et al. Prevalence of chronic obstructive pulmonary disease and associated risk factors in Uganda (FRESH AIR Uganda): a prospective cross-sectional observational study. Lancet Glob Health 2015;3:e44–e51. doi: 10.1016/S2214-109X(14)70337-7.
- Alam DS, Chowdhury MA, Siddiquee AT, et al. Prevalence and determinants of chronic obstructive pulmonary disease (COPD) in Bangladesh. COPD 2015;12:658–667. doi: 10.3109/15412555.2015.1041101.
- Grigsby M, Siddharthan T, Chowdhury MA, et al. Socioeconomic status and COPD among low- and middle-income countries. Int J Chron Obstruct Pulm Dis. 2016;11:2497–2507. doi: 10.2147/COPD.S111145.
- Siddharthan T, Grigsby MR, Goodman D, et al. Association between household air pollution exposure and chronic obstructive pulmonary disease outcomes in 13 low- and middle-income country settings. Am J Respir Crit Care Med. 2018;197:611–620. doi: 10.1164/rccm.201709-1861OC.
- Bostoen K, Chalabi Z. Optimization of household survey sampling without sample frames. Int J Epidemiol. 2006;35:751–755. doi: 10.1093/ije/dyl019.
- Chao LW, Szrek H, Peltzer K, et al. A comparison of EPI sampling, probability sampling, and compact segment sampling methods for micro and small enterprises. J Dev Econ. 2012;98:94–107. doi: 10.1016/j.jdeveco.2011.08.007.
- Quanjer PH, Stanojevic S, Cole TJ, et al; ERS Global Lung Function Initiative. Multi-ethnic reference values for spirometry for the 3-95-yr age range: the global lung function 2012 equations. Eur Respir J. 2012;40:1324–1343. doi: 10.1183/09031936.00080312.
- Miller MR, Hankinson J, Brusasco V, et al. Standardisation of spirometry. Eur Respir J. 2005;26:319–338. doi: 10.1183/09031936.05.00034805.
- World Health Organization. Physical status: the use of and interpretation of anthropometry, Report of a WHO Expert Committee. Geneva: WHO; 1995. (Technical Report Series 854).
- Carey V, Zeger SL, Diggle P. Modelling multivariate binary data with alternating logistic regressions. Biometrika 1993;80:517–526. doi: 10.1093/biomet/80.3.517.
- Laird NM, Ware JH. Random-effects models for longitudinal data. Biometrics 1982;38:963–974.
- Hastie TJ. Generalized additive models. In: Chambers JM, Hastie TJ, editors. Statistical models in S. Bota Raton (FL): CRC Press; 1982. p. 249–304.
- Breiman L. Classification and regression trees. Bota Raton (FL): Chapman & Hall/CRC Press; 1984.
- Grigsby MR, Di J, Leroux A, et al. Novel metrics for growth model selection. Emerg Themes Epidemiol. 2018;15:4. doi: 10.1186/s12982-018-0072-z.
- R Core Team. R: a language and environment for statistical computing. Vienna (Austria): R Foundation for Statistical Computing; 2017.
- Celli BR, Cote CG, Marin JM, et al. The body-mass index, airflow obstruction, dyspnea, and exercise capacity index in chronic obstructive pulmonary disease. N Eng J Med. 2004;350:1005–1012. doi: 10.1056/NEJMoa021322.
- National Center for Health Statistics. Health, United States, 2016: with chartbook on long-term trends in health. Hyattsville (MD): National Center for Health Statistics; 2017.
- Montes de Oca M, Tálamo C, Perez-Padilla R, et al; PLATINO Team. Chronic obstructive pulmonary disease and body mass index in five Latin America cities: the PLATINO study. Respir Med. 2008;102:642–650. doi: 10.1016/j.rmed.2007.12.025.
- Yang L, Zhou M, Smith M, et al. Body mass index and chronic obstructive pulmonary disease-related mortality: a nationally representative prospective study of 220,000 men in China. Int J Epidemiol. 2010;39:1027–1036. doi: 10.1093/ije/dyq051.
- Thyagarajan B, Jacobs DR Jr, Apostol GG, et al. Longitudinal association of body mass index with lung function: the CARDIA study. Respir Res. 2008;9:31. doi: 10.1186/1465-9921-9-31.
- Checkley W, Ghannem H, Irazola V, et al; GRAND South Network, UnitedHealth Group/National Heart, Lung, and Blood Institute Centers of Excellence. Management of NCD in low-and middle-income countries. Glob Heart 2014;9:431–443. doi: 10.1016/j.gheart.2014.11.003.
- Devakumar D, Stocks J, Ayres JG, et al. Effects of antenatal multiple micronutrient supplementation on lung function in mid-childhood: follow-up of a double-blind randomised controlled trial in Nepal. Eur Respir J. 2015;45:1566–1575. doi: 10.1183/09031936.00188914.
- Checkley W, West KP Jr, Wise RA, et al. Maternal vitamin A supplementation and lung function in offspring. N Engl J Med. 2010;362:1784–1794. doi: 10.1056/NEJMoa0907441.
- Gilliland FD, Berhane KT, Li Y-F, et al. Children's lung function and antioxidant vitamin, fruit, juice, and vegetable intake. Am J Epidemiol. 158:576–584.
- Cancello R, Tounian A, Poitou C, et al. Adiposity signals, genetic and body weight regulation in humans. Diabetes Metab. 2003;30:215–227.
- Steffes MW, Gross MD, Schreiner PJ, et al. Serum adiponectin in young adults—interactions with central adiposity, circulating levels of glucose, and insulin resistance: the CARDIA study. Ann Epidemiol. 2004;14:492–498. doi: 10.1016/j.annepidem.2003.10.006.
- Swanney MP, Ruppel G, Enright PL, et al. Using the lower limit of normal for the FEV1/FVC ratio reduces the misclassification of airway obstruction. Thorax 2008;63:1046–1051. doi: 10.1136/thx.2008.098483.