
Abstract
Many patients with chronic obstructive lung disease (COPD) experience exacerbations. The diagnosis of an exacerbation is solely based on symptoms. We hypothesized that exhaled breath profiles, measured by Gas Chromatography-Mass Spectrometry (GC-MS) or electronic nose (eNose), are different between stable disease and exacerbations and may have the potential to serve as biomarkers for COPD exacerbations. In this prospective follow-up study, breath samples were taken during stable COPD, during a subsequent exacerbation and after recovery. Samples were analyzed by GC-MS and eNose. CCQ symptom scores were associated with univariate outcomes of GC-MS and eNose using analysis of covariance (ANCOVA). After multivariate modeling by Principal Component Analysis (PCA), paired student t-tests were performed. Sixty-eight patients were included, 31 had an exacerbation and 16 patients had breath sampled at all three time points. Significant differences were found in breathprints taken during exacerbation as compared to baseline and recovery for both GC-MS and eNose. Breath profiles obtained by GC-MS as well as by eNose showed a correct classification of 71% (10/14) for baseline vs exacerbation and of 78% (11/14) for exacerbation vs recovery. These results provide proof of principle that exhaled breath can serve as a noninvasive biomarker for the diagnosis of COPD exacerbations.
Introduction
Chronic obstructive pulmonary disease (COPD) is a prevalent lung disease, characterized by non-fully reversible airflow limitation [Citation1]. Most patients with COPD experience exacerbations defined as an acute increase in respiratory symptoms [Citation1, Citation2]. Exacerbations are mostly driven by viral or bacterial airway infection [Citation1, Citation2], have a negative impact on patients’ quality of life [Citation3], accelerate lung function decline [Citation4], increase mortality [Citation5] and are representing a huge economic burden to society [Citation6]. Despite having those major negative consequences, at least half of the exacerbations are not reported [Citation7–9]. Objective assessment of an exacerbation might allow for early intervention, thereby improving patient related outcomes and reducing costs [Citation10].
At this moment, there is no diagnostic test or biomarker to confirm the presence of an exacerbation of COPD. The diagnosis of an exacerbation is based on the patient’s history and clinical findings, such as increased dyspnea, cough, sputum volume, and sputum purulence [Citation1]. However, these symptoms are nonspecific and may lead to the wrong treatment, over-treatment or non-treatment. A biomarker that identifies exacerbations of COPD would be useful for diagnosis and monitoring of individual patients, whilst representing an objective endpoint in clinical trials. The need for a biomarker for COPD exacerbations is endorsed by the Global Initiative of Chronic Obstructive Lung Disease (GOLD) and the American Thoracic Society (ATS) and European Respiratory Society (ERS) [Citation11–13].
Volatile organic compounds (VOCs) in exhaled air may be used as noninvasive biomarkers in the diagnosis and phenotyping of lung diseases [Citation14]. Measuring these metabolites in breath can in general be carried out by analytical chemistry methods such as gas chromatography-mass spectrometry (GC-MS) or by cross-reactive gas-sensor technology also called electronic nose or eNose. GC-MS allows identification of exhaled molecular compounds [Citation15], which contributes by unraveling pathophysiology mechanisms. A recent cross-sectional pilot study showed that VOCs captured by GC-MS can accurately discriminate stable COPD patients from those with exacerbations [Citation16]. However, GC-MS analyses requires specialized laboratories and are therefore not suitable as a rapid point of care test.
Alternatively, eNose technology allows pattern recognition of entire mixtures of VOCs [Citation15]. This provides a real-time breathprint and can potentially be used as a point of care test. Two recent studies have shown that eNose technology is able to discriminate COPD patients with and without airway infection with moderate good accuracy [Citation17, Citation18]. This suggests that eNose technology may also be able to identify the presence of an exacerbation as such.
GC-MS and eNose techniques are both needed to make biomarker identification based on exhaled VOCs suitable for clinical practice, as eNose sensor arrays can then specifically be tailored for exacerbations by using metabolite-specific sensor arrays derived from GC-MS data. This requires longitudinal studies using both technologies similar to those performed in asthma, in which GC-MS and eNose signals appeared to be discriminative when measured before, during and after recovery of an exacerbation [Citation19].
We performed a prospective, observational follow-up study alongside a published randomized controlled trial on the treatment of COPD exacerbations in an outpatient setting [Citation20]. We hypothesized that exhaled breath metabolomics by GC-MS and eNose differ between stable disease and exacerbations, and we therefore compared exhaled breath profiles before, during and after recovery from an exacerbation in patients with COPD.
Methods
Trial design
This prospective, observational study was performed in a unselected subgroup of patients participating in the randomized controlled trial on the treatment of COPD exacerbations [Citation20] from December 2011 until December 2014. In the present study, exhaled breath samples were obtained before, during and after an exacerbation of COPD. An exacerbation was defined as an event characterized by a change in patients' baseline dyspnea, cough, or sputum beyond day-to-day variability, sufficient to warrant a change in management other than optimizing bronchodilator therapy [Citation2, Citation13]. Respiratory symptoms originating from an evidently non-pulmonary cause were not considered an exacerbation.
Participants
Participants were recruited from the Isala Clinics, Zwolle and the Amsterdam UMC, Amsterdam, two teaching hospitals in the Netherlands. Inclusion criteria were an age of 45 years or older, a clinical diagnosis of mild-to-severe COPD, defined as a post-bronchodilator forced expiratory volume in 1 second (FEV1) to forced vital capacity (FVC) ratio ≤ 0·7 and a post-bronchodilator FEV1 ≥ 30%, according to GOLD and ATS/ERS criteria [Citation2, Citation13], a smoking history of at least 10 pack-years and one or more exacerbations during the previous three years, with the limitation that the last exacerbation ended more than 4 weeks before recruitment and symptoms had returned to baseline level [Citation20]. Patients were not eligible if they did not speak Dutch, had poor cognitive abilities, or had a life expectancy shorter than one month. The study was carried out in accordance with the Declaration of Helsinki. All patients gave written informed consent. The trial protocol was approved by the ethics committee of the Amsterdam UMC at the University of Amsterdam.
Procedures
All participants fulfilling inclusion criteria entered a prospective cohort. At baseline, breath samples were collected and characteristics, including demographics, lung function data, smoking history and medication were recorded in a standardized electronic case record form (eCRF, Oracle Clinical). Patients were instructed to contact their treating physician (general practitioner or pulmonologist) if they experienced an increase in respiratory symptoms. When the diagnosis of an exacerbation was confirmed, as part of the main project, the patient was randomly assigned to a 7-day course of oral doxycycline or placebo [Citation20]. Patients in both arms received a 10-day course of oral corticosteroids (OCS).
Next, within 48 h after the diagnosis of an exacerbation, breath samples were taken for the exacerbation visit and data concerning respiratory symptoms, fever, use of antibiotics, steroids and inhalation medication were recorded. After 12 weeks, when symptoms had returned to baseline level, this procedure was repeated for breath sampling at the recovery visit.
Clinical control was measured by the symptom score of the Clinical COPD Questionnaire (CCQ) [Citation21]. The CCQ is a self-administered questionnaire that consists of 10 questions in 3 domains (symptoms, functional state, and mental state). Scores for each of the questions and the total score range from 0 (very good control) to 6 (extremely poor control), with a minimal clinically important difference of 0.4 [Citation22]. The symptom score is calculated by adding up the scores of questions 1, 2, 5, and 6 and dividing the total score by 4. The CCQ was administered at baseline, during exacerbation and 12 weeks after the exacerbation.
Exhaled breath sampling
All participants were instructed to refrain from smoking, eating and drinking at least 2 h prior to breath sampling to minimize the influence of exogenous compounds. Exhaled breath was collected as previously described [Citation19]. First, patients breathed for 5 min at tidal volume through a two-way non-rebreathing valve and an inspiratory carbon VOC-filter (A2, North Safety, Middelburg, NL) to clean the inspired air. Second, the subject exhaled a single vital capacity volume into a 10 liter Tedlar bag (SKC Inc, Eighty Four, PA, USA). Within 30 min after breath collection, two thermal desorption tubes (Tenax GR SS 6 mm × 7”, Gerstel, DaVinci BV, Rotterdam, NL) were connected to the Tedlar bag for collection, transportation and storage of the expired VOCs. Each tube was sampled with 500 mL exhaled air at a flow of 250 mL/min using a peristaltic pump. VOCs present in exhaled breath were thereby captured onto the Tenax GR sorbent mesh in the tubes. Tubes were send to Philips Research (Eindhoven, the Netherlands) for GC-MS analysis and to the Amsterdam UMC, location AMC, University of Amsterdam (Amsterdam, the Netherlands) for analysis by the electronic eNose platform [Citation23]. This eNose platform has been validated [Citation24] and was used in two recently published clinical studies [Citation19, Citation25].
Breath sample measurement by GC-MS
For desorption, the Tenax tubes containing the VOCs were heated using a Gerstel TDS3 desorption oven (Gerstel, Mülheim an der Ruhr, Germany) with helium as carrier gas. Next, the sample was transmitted to a packed liner, heated to 225 °C for 3 min and transferred to a Tenax TA cold trap at 150 °C, which was heated after 2 min to 280 °C at 20 °C/s and splitless injected onto the chromatographic column. Subsequently, VOCs were separated by capillary gas-chromatography with helium as a carrier gas at 1.2 mL/min (7890 N GC, Agilent, Santa Clara, CA, USA) on a VF1-MS column (30 m, diameter 0.25 mm, film thickness 1 µm, 100% dimethylpolysiloxane, Varian Chrompack, Middelburg, the Netherlands). The column oven temperature was programed as follows: isothermal at 40 °C for 5 min, increased until 300 °C with 25 °C/min and held isothermal for 2 min. Finally, a Time of Flight mass spectrometer (Pegasus 4 D system, LECO, St. Joseph, MI, USA), in electron impact ionization mode at 70 eV, was used for charging the compounds and detection of resulting individual ions (ranging from 29 to 400 Dalton).
Breath sample measurement by eNose platform
VOCs were released from the tubes through thermal desorption in a Gerstel TDS3 desorption oven, using nitrogen as carrier gas and subsequently captured in a Tedlar bag. Obtained samples were used for further analysis by the eNose platform [Citation23], which consists of four instruments, all using unique sensor technologies: Common Invent eNose (metal oxide semiconductor sensors; 8 sensors) [Citation26], Owlstone Lonestar (FAIMS, Field Assymetric Ion Mobility Spectrometry; 110 data points [Citation27], Cyranose C320 (carbon black-polymer sensors; 32 sensors) [Citation28] and Tor Vergata eNose (quartz crystal microbalances covered with metalloporphyrins; 8 sensors) [Citation29].
Data processing and statistical analysis
R version 3.1.2 through the R studio interface was used for data processing and statistical analyses. Both were extensively described in a recent publication [Citation19]. In summary, GC-MS data processing, consisting of denoising, peak detection and alignment, was performed using the XCMS package [Citation30] (Scripps Center for Metabolomics, La Jolla, CA). The derived ion fragment peak table served as source for further analysis. Next, fragments were transformed into compounds by running a principal component analysis (PCA) on all fragments within a retention time frame of 5 seconds. Finally, the data of the individual eNose sensors and the GC-MS compounds were normalized by adjusting their average values and standard deviations to, respectively, 0 and 1.
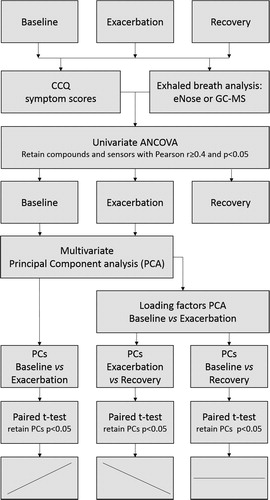
As exacerbations of COPD are solely defined by symptoms, the CCQ symptom scores at baseline, exacerbation and recovery visits were associated with univariate outcomes of eNose (sensor level) and GC-MS (compound level) using analysis of covariance (ANCOVA). eNose sensors or GC-MS compounds with a Pearson r ≥ 0.4 and p < .05 were retained. During the next step, PCA was performed using baseline and exacerbation visit data to merge the remaining variables into two multivariate datasets. Subsequently, Principal Components (PCs) for exacerbation + recovery visit and baseline + recovery visit data sets were calculated based on the loading factors of the baseline + exacerbation PCA. Next, paired student t-tests on the obtained PCs were performed to compare the means between the repeated measures: baseline vs exacerbation, exacerbation vs recovery and baseline vs recovery. p-values <.05 were considered significant (). To validate the results, leave-one-out cross validation was performed using the jackknife leave-one-out strategy from the r package bootstrap. Logistic regression analysis were done to derive details on sensitivity and specificity. Spectra of GC-MS compounds retaining after univariate analysis were identified based on NIST-library (v.2.0a) matching.
Figure 1. Statistical analysis.
Results
In the 2 participating hospitals, 84 patients were invited to participate. 68 patients gave informed consent and entered the prospective cohort. Of these patients, 31 reported exacerbations and 18 exacerbations fulfilled the pre-defined criteria (). From 18 patients breath samples were successfully captured during exacerbation and from 16 patients after recovery. 14 participants had complete data for GC-MS analysis, and 14 had complete date for eNose analysis; of these, 12 had complete data for both analyses. Four patients could not be sampled for both methods because of logistic reasons. After 12 weeks, in all but one patient, symptoms had returned to baseline level and 15 follow-up breath samples were taken. One patient had multiple exacerbations and was completely recovered in week 25 at which moment breath samples were collected. Baseline characteristics are shown in .
Figure 2. Study profile.
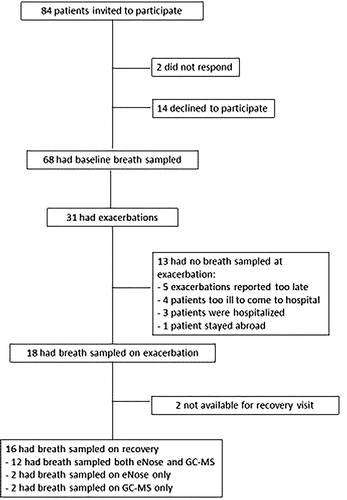
Table 1. Baseline characteristics.
All but one patient reported the use of the same inhalation medication in the same dosage at baseline, exacerbation and recovery; one patient used formoterol/budesonide within 2 h before sampling. One patient started OCS the day before sampling, both during an exacerbation. All other patients started treatment with OCS and/or study medication after breath sampling. No patient used antibiotics at time of sampling.
Six (37.5%) of the exacerbations were type 1 exacerbations (all 3 Anthonisen criteria present: increased dyspnea, increased sputum, and sputum purulence). All exacerbations were treated ambulatory. CCQ symptom scores were significantly different between baseline and exacerbation (2.57 vs 3.65, p .001) and between exacerbation and recovery (3.65 vs 2.57, p < .001), but not between baseline and recovery (2.57 vs 2.57, p = 1).
GC-MS
Forty-two breath samples were analyzed by GC-MS and 5214 ion fragments were identified. These ion fragments corresponded with 276 volatile organic compounds. After optimization of data distribution and normalization, univariate ANCOVA between CCQ symptom scores and VOCs identified ten compounds of interest. These included: acetone, 1,2-pentadiene, toluene, butyrolactone, ethylbenzene, (Z)-2-decenal, limonene, 4,7-dimethyl-undecane, eicosane and 1-undecanol. PCA modeling resulted in four PCs with an eigenvalue >1. For PC 2, 3, and 4, there were no significant differences between the visits.
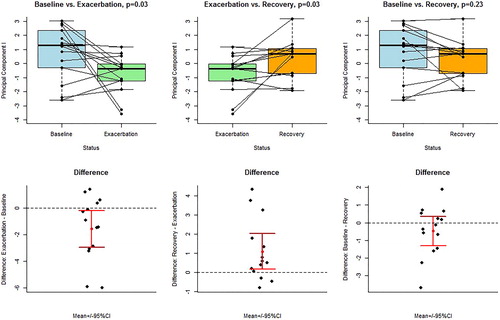
PC 1 of the identified VOCs was significantly different between baseline vs exacerbation (p = .03), exacerbation vs recovery (p = 0.03) but not between baseline vs recovery (p = .23). Accuracies based on differences resulted in a 71% (10/14) correct classification for baseline vs exacerbation and 78% (11/14) for exacerbation vs recovery, respectively (). Leave-one-out cross validation had the following results: baseline vs exacerbation: p = .04, 95% confidence interval (CI) ± 0.01, exacerbation vs follow-up: p = .03, 95% CI ± 0.01 and baseline vs follow-up: p = .26, 95% CI ± 0.05.
Figure 3. Exhaled breath profiles (principal components) obtained by GC-MS with mutual comparisons between baseline, exacerbation and recovery. Upper panel: boxplots of paired t-tests. Lower panel: difference plots, including means and 95% confidence intervals for the means.
Logistic regression for baseline vs exacerbation resulted in an accuracy of 0.71, with a sensitivity and specificity of 0.71. For exacerbation vs follow up, accuracy was 0.75, with a sensitivity of 0.92 and a specificity of 0.57. For baseline vs follow-up, accuracy was 0.57, with a sensitivity of 0.64 and a specificity of 0.5.
eNose platform
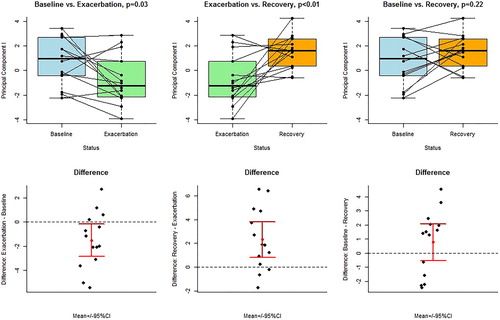
After pre-processing, fourteen eNose sensors retained ANCOVA. This resulted in five PCs with an eigenvalue >1. For PC 2, 3, 4, and 5, there were no significant differences between the visits. For PC 1, there were significant differences: baseline vs exacerbation (p = .03) and exacerbation vs recovery (p < .001), but not baseline vs recovery (p = .22). Accuracies for eNose analysis resulted in 71% (10/14) and 78% (11/14) correct classification for baseline vs exacerbation and exacerbation vs recovery (). The instrument that most prominently drove the discriminative eNose signal with regard to exacerbation was the ion mobility spectrometer (with eleven out of fourteen retaining eNose variables).
Figure 4. Exhaled breath profiles (principal components) obtained by eNose with mutual comparisons between baseline, exacerbation and recovery. Upper panel: boxplots of paired t-tests. Lower panel: difference plots, including means and 95% confidence intervals for the means.
Leave-one-out cross validation had the following results: baseline vs exacerbation: p = .04, 95% confidence interval (CI) ± 0.01, exacerbation vs follow-up: p = .01, 95% CI ± 0.00 and baseline vs follow-up: p = .25, 95% CI ± 0.05. Logistic regression for baseline vs exacerbation and for exacerbation vs follow-up, resulted in an accuracy of 0.75, with a sensitivity 0.79 of and a specificity of 0.71. For baseline vs follow-up, accuracy was 0.61, with a sensitivity of 0.57 and a specificity of 0.64.
Discussion
When monitoring COPD patients with ambulatory treated exacerbations of COPD, exhaled breath metabolomic profiles as measured by GC-MS and eNose were different during an exacerbation as compared to baseline and recovery. Therefore, exhaled breath has the potential to serve as a noninvasive biomarker for COPD-exacerbations.
To our knowledge, this is the first prospective follow-up study comparing VOCs, captured by both GC-MS and e-Nose before, during and after naturally occurring exacerbations in patients with COPD. These data confirm and extend similar longitudinal data in asthma, in which the exacerbation visit also could be distinguished from baseline and recovery [Citation19]. For COPD mostly cross-sectional studies were reported, comparing exhaled breath VOCs during exacerbations and stable episodes. Using GC-MS, Pizzini et al. [Citation16] compared breathprints from patients with stable COPD with those having an exacerbation. Exacerbated and stable COPD could be discriminated by 4 VOCs (n-butane, 2-pentanone, cyclohexanone and 4-heptanone). The recent data by Gaugg et al. [Citation31] showed that metabolites identified by a real-time breath analyzer (secondary electrospray ionization- high resolution mass spectrometry) differ during clinically stable episodes between COPD patients with frequent and non-frequent exacerbations. This suggests that not only the exacerbations themselves, but also the phenotype of frequent exacerbations is associated with distinguishable exhaled metabolomic profiles.
Thus far the only longitudinal VOC analysis during and after COPD exacerbations was published by Shafiek et al. [Citation17]. Comparing eNose-derived breathprints of patients (n = 93) hospitalized for an exacerbation of COPD with breathprints of the same patients after recovery (n = 61) showed a trend towards distinguishing the exacerbation of COPD from its recovery, with an accuracy of 70%, sensitivity of 72% and specificity of 67% (p = .068) [Citation17]. In our study the latter comparison reached statistical significance with similar accuracies, even though we included milder exacerbations treated in an outpatient setting. This suggests that the observed accuracies are consistent over a broad range of exacerbation severities in COPD.
Our study has a few strengths. First, by combining GC-MS and eNose technologies, we are taking a necessary next step towards developing a noninvasive biomarker suitable for clinical practice. GC-MS and eNose both have their strengths and limitations. On the one hand, currently available GC-MS technology as the analytical chemistry standard is not suitable for clinical practice, as GC-MS does not allow real-time analysis, requires specialized laboratories and is expensive. Yet, GC-MS can identify individual compounds that are needed for the development of VOC-specific sensors in eNose-technology. On the other hand, eNose technology cannot identify individual VOCs, merely producing (powerful) pattern recognition of VOC-mixtures. Notably, in the present study GC-MS and eNose provided highly similar accuracies, which represents an internal validation. Second, the longitudinal study design allowed for follow-up of a well-defined cohort of patients with spirometry-confirmed COPD. Furthermore, as more than 80% of COPD exacerbations is treated ambulatory [Citation1], our cohort is representative for COPD patients in daily clinical practice. Finally, the GC-MS and eNose measurements were unlikely to be influenced by medication, as patients continued to use the same medication during this trial and all but one exacerbation samples were taken before the start of OCS and/or antibiotics.
Nevertheless, the study has limitations. First, the sample size was relatively small. This was due to the complexity of recruiting patients and capturing their breath samples during the acute clinical event of a COPD exacerbation. By including 68 patients with stable COPD and an estimated exacerbation rate of 0.5/patient/year we aimed to include 30 patients with an exacerbation. Indeed, 31 exacerbations occurred in this group, but 13 exacerbations were either missed or not suitable for adequate breath sampling (). Still we observed significant differences in GC-MS and eNose signals over the course of the exacerbations that were statistically validated using the jackknife leave-one out strategy. Hence, limited statistical power does not seem to be a major restriction of the present study. Nevertheless, the present data should be considered as proof of principle. Second, the present study did not include an independent replication cohort. Hence, our findings need to be clinically validated in another cohort of COPD patients before VOCs can be used as a clinical tool for diagnosing COPD exacerbations. Finally, even though we identified 10 VOCs by GC-MS that were associated with CCQ scores during the course of follow-up, we could not identify individual components that were significantly different before, during and after an exacerbation. Such significant differences were shown for PC 1, that combined information by GC-MS of multiple VOCs rather than relying on a single component. We believe that this finding is not unexpected given the biological complexity and clinical heterogeneity of COPD exacerbations.
Four of the compounds that were identified in the current study were previously reported in exhaled air in the literature [Citation32–34], even though we are the first to show an association with COPD exacerbations. Acetone is common in exhaled air but is also associated with pathogenic bacteria [Citation32]; 1,2-pentadiene is also common in exhaled air [Citation34], whilst toluene is a potential marker for bacterial presence, being associated with Pseudomonas species and Haemophilus influenzae [Citation32, Citation33]. Limonene is also a potential marker for bacterial presence [Citation32], but can also be related to food ingestion. These findings suggest that bacterial infection is involved in providing at least part of the VOC signal during exacerbations of COPD. However, the presently observed VOCs do not correspond with those published in the cross-sectional studies by Pizzini et al. [Citation16] and Gaugg et al. [Citation31]. This is not surprising as there are important differences between the studies, including study design, data analysis and study populations (such as severity of COPD and severity of exacerbations). These differences between studies underline the call for standardization of methodologies in breath studies, which is currently ongoing [Citation14].
Conclusions
Our proof of principle data show that exhaled breath analysis by eNose as well as by GC-MS can distinguish an exacerbation from stable disease during follow-up of patients with COPD. Notably, breathprints at baseline and after clinical recovery did not differ, suggesting that there is complete recovery of metabolic activity as captured in exhaled air. Therefore, exhaled breath tests may qualify as a noninvasive biomarker of the acute episode of COPD exacerbations. If the present data can be replicated in a large COPD cohort, VOC analysis can be made applicable for the monitoring of patients with COPD. This has the potential of early intervention, leading to less symptoms, fewer hospitalizations and reduced costs [Citation10].
Author contributions
PV is the guarantor of this work. PV, PB, RL, JP, and PS designed the study. PV, RJ, and JvdB collected data. PV, PB, and HK analyzed data. PV, PB, JP, and PS interpreted data. PV, PB, JP, and PS wrote the manuscript. HK, RJ, JvdB, and RL reviewed the manuscript. All authors approved the final manuscript.
Disclosure of interest
PS is scientific advisor and has an inconsiderable interest in Breathomix BV. PB, HK, JvdB, RJ, and RL report no conflict of interest.
Additional information
Funding
References
- Global Initiative for Chronic Obstructive Lung Disease (GOLD). Global Strategy for the Diagnosis, Management and Prevention of COPD (2017 Report) 2017. [cited 2019 May 3]. Available from: http://goldcopd.org/gold-2017-global-strategy-diagnosis-management-prevention-copd/
- American Thoracic Society/European Respiratory Society Task Force. Standards for the Diagnosis and Management of Patients with COPD. 2004. [cited 2019 May 3]. Available from: http://www.ers-education.org/lrmedia/2004/pdf/44027.pdf
- Miravitlles M, Ferrer M, Pont A, et al. Effect of exacerbations on quality of life in patients with chronic obstructive pulmonary disease: a 2 year follow up study. Thorax. 2004;59(5):387–395. doi:10.1136/thx.2003.008730.
- Donaldson GC, Seemungal TA, Bhowmik A, et al. Relationship between exacerbation frequency and lung function decline in chronic obstructive pulmonary disease. Thorax. 2002;57(10):847–852. doi:10.1136/thorax.57.10.847.
- Soler-Cataluna JJ, Martinez-Garcia MA, Roman Sanchez P, et al. Severe acute exacerbations and mortality in patients with chronic obstructive pulmonary disease. Thorax. 2005;60(11):925–931. doi:10.1136/thx.2005.040527.
- Toy EL, Gallagher KF, Stanley EL, et al. The economic impact of exacerbations of chronic obstructive pulmonary disease and exacerbation definition: a review. COPD. 2010;7(3):214–228. doi:10.3109/15412555.2010.481697.
- Xu W, Collet JP, Shapiro S, et al. Negative impacts of unreported COPD exacerbations on health-related quality of life at 1 year. Eur Respir J. 2010;35(5):1022–1030. doi:10.1183/09031936.00079409.
- Langsetmo L, Platt RW, Ernst P, et al. Underreporting exacerbation of chronic obstructive pulmonary disease in a longitudinal cohort. Am J Respir Crit Care Med. 2008;177(4):396–401. doi:10.1164/rccm.200708-1290OC.
- Jones PW, Lamarca R, Chuecos F, et al. Characterisation and impact of reported and unreported exacerbations: results from ATTAIN. Eur Respir J. 2014;44(5):1156–1165. doi:10.1183/09031936.00038814.
- Wilkinson TM, Donaldson GC, Hurst JR, et al. Early therapy improves outcomes of exacerbations of chronic obstructive pulmonary disease. Am J Respir Crit Care Med. 2004;169(12):1298–1303. doi:10.1164/rccm.200310-1443OC.
- Celli BR, Decramer M, Wedzicha JA, et al. An official American Thoracic Society/European Respiratory Society statement: research questions in COPD. Eur Respir Rev. 2015;24(136):159–172. doi:10.1183/16000617.00000315.
- Celli BR, Thomas NE, Anderson JA, et al. Effect of pharmacotherapy on rate of decline of lung function in chronic obstructive pulmonary disease: results from the TORCH study. Am J Respir Crit Care Med. 2008;178(4):332–338. doi:10.1164/rccm.200712-1869OC.
- Global Initiative for Chronic Obstructive Lung Disease (GOLD). Global Strategy for the Diagnosis, Management and Prevention of COPD 2016. [cited 2019 May 3]. Available from: http://goldcopd.org/global-strategy-diagnosis-management-prevention-copd-2016/
- Horvath I, Barnes PJ, Loukides S, et al. A European Respiratory Society technical standard: exhaled biomarkers in lung disease. Eur Respir J. 2017;49(4). doi:10.1183/13993003.00965-2016.
- Boots AW, Bos LD, van der Schee MP, et al. Exhaled molecular fingerprinting in diagnosis and monitoring: validating volatile promises. Trends Mol Med. 2015;21(10):633–644. doi:10.1016/j.molmed.2015.08.001.
- Pizzini A, Filipiak W, Wille J, et al. Analysis of volatile organic compounds in the breath of patients with stable or acute exacerbation of chronic obstructive pulmonary disease. J Breath Res.. 2018;12(3):036002. doi:10.1088/1752-7163/aaa4c5.
- Shafiek H, Fiorentino F, Merino JL, et al. Using the electronic nose to identify airway infection during COPD exacerbations. PLoS One. 2015;10(9):e0135199. doi:10.1371/journal.pone.0135199.
- van Geffen WH, Bruins M, Kerstjens HA. Diagnosing viral and bacterial respiratory infections in acute COPD exacerbations by an electronic nose: a pilot study. J Breath Res.. 2016;10(3):036001. doi:10.1088/1752-7155/10/3/036001.
- Brinkman P, van de Pol MA, Gerritsen MG, et al. Exhaled breath profiles in the monitoring of loss of control and clinical recovery in asthma. Clin Exp Allergy. 2017;47(9):1159–1169. doi:10.1111/cea.12965.
- van Velzen P, Ter Riet G, Bresser P, et al. Doxycycline for outpatient-treated acute exacerbations of COPD: a randomised double-blind placebo-controlled trial. Lancet Respir Med. 2017;5(6):492–499. doi:10.1016/S2213-2600(17)30165-0.
- van der Molen T, Willemse BW, Schokker S, et al. Development, validity and responsiveness of the Clinical COPD Questionnaire. Health Qual Life Outcomes. 2003;1:13.
- Kocks JW, Tuinenga MG, Uil SM, et al. Health status measurement in COPD: the minimal clinically important difference of the clinical COPD questionnaire. Respir Res. 2006;7(1):62. doi:10.1186/1465-9921-7-62.
- Brinkman P, Wagener AH, Hekking PP, et al. Identification and prospective stability of electronic nose (eNose)-derived inflammatory phenotypes in patients with severe asthma. J Allergy Clin Immunol. 2019;143(5):1811–1820.e7. doi:10.1016/j.jaci.2018.10.058.
- Ahmed WM, Brinkman P, Weda H, et al. Methodological considerations for large-scale breath analysis studies: lessons from the U-BIOPRED severe asthma project. J Breath Res. 2018;13(1):016001. doi:10.1088/1752-7163/aae557.
- Lamote K, Brinkman P, Vandermeersch L, et al. Breath analysis by gas chromatography-mass spectrometry and electronic nose to screen for pleural mesothelioma: a cross-sectional case-control study. Oncotarget. 2017;8(53):91593–91602. doi:10.18632/oncotarget.21335.
- Bos LD, van Walree IC, Kolk AH, et al. Alterations in exhaled breath metabolite-mixtures in two rat models of lipopolysaccharide-induced lung injury. J Appl Physiol (Bethesda, MD: 1985). 2013;115(10):1487–1495. doi:10.1152/japplphysiol.00685.
- Arasaradnam RP, McFarlane MJ, Ryan-Fisher C, et al. Detection of colorectal cancer (CRC) by urinary volatile organic compound analysis. PLoS One. 2014;9(9):e108750. doi:10.1371/journal.pone.0108750.
- Lewis NS. Comparisons between mammalian and artificial olfaction based on arrays of carbon black-polymer composite vapor detectors. Acc Chem Res. 2004;37(9):663–672. doi:10.1021/ar030120m.
- Di Natale C, Paolesse R, D’Amico A. Metalloporphyrins based artificial olfactory receptors. Sens Actuators B Chem. 2007;121(1):238–246. doi:10.1016/j.snb.2006.09.038.
- Smith CA, Want EJ, O'Maille G, et al. XCMS: processing mass spectrometry data for metabolite profiling using nonlinear peak alignment, matching, and identification. Anal Chem. 2006;78(3):779–787. doi:10.1021/ac051437y.
- Gaugg MT, Nussbaumer-Ochsner Y, Bregy L, et al. Real-time breath analysis reveals specific metabolic signatures of COPD exacerbations. Chest. 2019;156(2):269. doi:10.1016/j.chest.2018.12.023.
- Bos LD, Sterk PJ, Schultz MJ. Volatile metabolites of pathogens: a systematic review. PLoS Pathog. 2013;9(5):e1003311. doi:10.1371/journal.ppat.1003311.
- Microbial volatile organic compound database 2.0. [cited 2019 May 3]. Available from: http://bioinformatics.charite.de/mvoc/index.php?site=home
- Phillips M, Herrera J, Krishnan S, et al. Variation in volatile organic compounds in the breath of normal humans. J Chromatogr B Biomed Sci Appl. 1999;729(1–2):75–88. doi:10.1016/S0378-4347(99)00127-9.
- Anthonisen NR, Manfreda J, Warren CP, et al. Antibiotic therapy in exacerbations of chronic obstructive pulmonary disease. Ann Intern Med. 1987;106(2):196–204. doi:10.7326/0003-4819-106-2-196.