
Abstract
Patients who have chronic obstructive pulmonary disease (COPD) and bronchial asthma (BA) share symptoms such as, dyspnoea, cough and wheeze. Differentiating these diseases in the ambulatory setting can be challenging especially in older adult smokers who are being treated with a variety of medications. The objective of this study was to test the value of adding a maximal inspiratory manoeuvre to basic spirometry to differentiate COPD and BA. One hundred forty-three COPD patients and 142 BA patients had measurements of maximal inspiratory and expiratory flow during routine spirometry. Parameters from these tests were used to assess diagnostic accuracy using receiver-operating characteristic (ROC) analyses followed by logistic regression. The association of two independent parameters were analyzed using linear regression analyses. Results show that forced expiratory volume in one second/forced vital capacity (FEV1/FVC%) <62.4 was the best independent predictor to diagnose COPD. The combination of FEV1/FVC% <62.4 and the ratio of peak inspiratory flow/maximal expiratory flow at 50% FVC (PIF/MEF50) >3.06 significantly predicted COPD. Post-test probability for prediction of COPD was 82.0% when patients had both parameters. When asthmatic patients with a smoking history were compared with COPD patients, FEV1/FVC% <63.4 and PIF/MEF50 >3.29 were both independent predictors of COPD. The post-test probability for COPD was 94.4% when patients had both parameters. The association between FEV1/FVC% and PIF/MEF50 was significantly different between COPD and BA. In conclusion, the addition of the maximal inspiratory effort to routine pulmonary function measurements provides a simple test to help differentiate COPD and BA.
Introduction
Asthma and chronic obstructive pulmonary disease (COPD) have very different aetiologies, pathophysiology and natural history yet both result in decreases in maximal expiratory flow; in fact, decreased expiratory flow is integral to the diagnosis of both the conditions [Citation1, Citation2]. In COPD, the decrease in expiratory flow is due to a combination of loss of lung elastic recoil, small airway narrowing and obliteration [Citation3]. In asthma, lung elastic recoil is usually normal but expiratory flow is reduced because of a reduction in airway calibre due to smooth muscle constriction and airway remodelling both of which stiffen the airways making them less distensible [Citation4]. Although COPD occurs predominantly in smokers, nonsmokers can also develop COPD and COPD and asthma can co-exist [Citation5–7]. In older subjects, it is often difficult to distinguish COPD and asthma when airflow obstruction is relatively unresponsive to bronchodilator therapy, yet this distinction is therapeutically important. There have been attempts to separate the aetiology of expiratory airflow limitation based on lung function tests [Citation8–11]. Colebatch reasoned that the airways of asthmatics would be less distensible and attempted to estimate airway distensibility by constructing maximum flow–static recoil plots [Citation12]. The slope of the maximal flow–static recoil relationship is a measure of airway conductance during forced expiration and he found that dynamic conductance was lower in asthmatics; that is flow at any elastic recoil pressure was lower probably due to intrinsic narrowing and increased rigidity and that loss of lung elastic recoil is a more important contributor to expiratory flow limitation in COPD than asthma. Others have suggested that measures of airway distensibility could help to distinguish asthmatics from patients with COPD especially for individuals who have similar degrees of airflow limitation [Citation13]. However, none of these methods for separating asthma from COPD is practical in a clinical setting, requiring insertion of an oesophageal balloon, measurement of anatomic dead space or CT scanning. In this report, we describe a simple method for assessing the predominant mechanism of airflow obstruction. In the current retrospective study, we show that the comparison of maximal inspiratory to maximal expiratory flow readily distinguishes subjects with COPD from those with asthma and may be useful in subjects in whom the primary cause of airflow obstruction is uncertain.
Material and methods
A computerized patient list in our clinic which included diagnosis was used to select subjects who had a clinical diagnosis of COPD or bronchial asthma (BA). Patients who had both diagnoses (asthma–COPD overlap, ACO) were eliminated from the selection.
Selection of COPD patients
One hundred and fifty patients who visited the respiratory clinic of Fujita Health University for regular check-ups or for the assessment of possible COPD and had post-bronchodilator spirometry were consecutively selected from a patient list between 2007 and 2013. The diagnosis of COPD was based on Global Initiative for Chronic Obstructive Lung Disease [Citation1]. Patients whose FEV1/FVC% was less than 70% after bronchodilator using short acting ß agonist (SABA) were included. Patients who had been treated using a long acting muscarinic antagonist (LAMA) and/or a long acting ß agonists (LABA) and had a FEV1/FVC% less than 70% were also included. Patients who was initially diagnosed as COPD, but whose post-bronchodilator FEV1/FVC% subsequently became larger than 70% with treatment were eliminated from the study (n = 6). We also eliminated one patient who subsequently developed several asthmatic attacks and whose diagnosis changed to ACO [Citation6, Citation14]. All the COPD patients were current or ex-smokers except two who had worked in an environment which involved extensive exposure to second-hand smoke. All patients had a chest radiograph.
Selection of BA patients
One hundred and fifty patients who visited the respiratory clinic of Fujita Health University for regular appointments for asthma or for the diagnosis of possible BA were consecutively selected from a patient list between 2007 and 2013. The final diagnosis of asthma was based on the criteria of the Global Initiative for Asthma Management and Prevention [Citation2]. Patients who had undergone neither post-bronchodilator spirometry nor methacholine challenge testing were eliminated from the study (n = 4). Patients with chronic cough without wheeze or dyspnoea, who were diagnosed as cough variant asthma (n = 2) [Citation15, Citation16] were also eliminated. Two additional smoking asthmatics who were initially assigned to bronchial asthma developed an element of fixed airflow obstruction (FEV1/FVC% less than 70% after bronchodilator test) were diagnosed to have ACO and were eliminated from the analysis. Ultimately 143COPD and 142 asthmatic patients were included in the study.
Pulmonary function tests
Pulmonary function tests were performed by well-trained technicians at Fujita Health University using a rolling seal spirometer (CHESTAC 33DN, 8800DN or 8900DN, Chest, ltd, Tokyo). Quasi-static spirometry was performed to measure vital capacity (VC). The patients were instructed to make a slow expiration to residual volume (RV) and make slow inspiration to TLC (inspiratory VC measurement), then again to make a slow expiration to RV (expiratory VC measurement). The larger of the two values was selected as VC. To perform forced spirometry, the patients were instructed to make a maximal forced inspiration from functional residual capacity (FRC) to total lung capacity (TLC), then to make a forced expiratory manoeuvre without an end-inspiratory pause from TLC to RV and again to make forced inspiratory manoeuvre to TLC as per guidelines [Citation17]. Special attention and instruction of the patients were provided to make the inspiration from FRC to TLC as rapid and as complete as possible. Rehearsals of the maximal inspiratory and expiratory manoeuvres were repeated and the actual measurements were made in triplicate. The tracing with the largest sum of FEV1 and forced vital capacity (FVC) with distinct peaks on the inspiratory and expiratory flow loops was recorded and used for the analysis. The bronchodilator response was tested based on the recommendation of the ATS/ERS guideline [Citation18]. The methacholine challenge test was also performed according to guidelines [Citation19]. The bronchodilator test and methacholine challenge test were mainly used for new patients or reconfirmation of a diagnosis of bronchial asthma. Percent predicted values for VC and FVC were calculated by Baldwin’s equation [20], for FEV1 by Berglund’s equation [21] and for MEF50 and MEF25 by Bouhuys’ equations [22].
Comparison of parameters between COPD and BA
Anthropometric parameters: sex, age. smoking history (pack years).
Pulmonary function parameters: FEV1 percent predicted (FEV1%P), FEV1/FVC%, FVC/VC, peak expiratory flow percent predicted (PEF%P), maximal expiratory flow at 50% FVC percent predicted (MEF50%P), maximal expiratory flow at 25% FVC percent predicted (MEF25%P), peak inspiratory flow from FRC (PIF, litres/seconds), the ratio of peak inspiratory to peak expiratory flow (PIF/PEF) and the ratio of PIF to maximal expiratory flow at 50% FVC (PIF/MEF50). If subjects had more than one pulmonary function test at the clinic on different visits, the first test was chosen for analysis.
Statistics
Each continuous parameter was expressed as mean ± SD and compared between groups using the Student t-test when data were normally distributed, otherwise, data were expressed as median and interquartile range and the Wilcoxon rank sum test was applied for comparison. The sex ratio for the groups was compared using Pearson chi-squared test. To maximize the diagnostic value of the variables for COPD, cut-off levels were determined using receiver-operating characteristic (ROC) analyses with Youden index [Citation23], the greatest value for sum of sensitivity and specificity minus 1. A logistic regression analysis was performed by selecting the parameters which had areas under the ROC curve greater than 0.8 (AUC > 0.8). Each pulmonary function parameter was binarized using the optimal cut-off values obtained from the ROC analyses. Using binarized pulmonary function parameters, univariate analysis was performed, followed by multivariate analysis including significant pulmonary function parameters, age, sex and smoking history.
The combined predictive value of two independent predictive parameters was analyzed by dividing patients into three groups; patients negative for both parameters as a reference, patients who were positive for either predictive parameter and patients who were positive for both parameters. The three categories were analyzed using logistic regression including age, sex and smoking history.
To assess associations between significant predictive parameters, linear regression analyses with analyses of co-variance (ANCOVA) were performed. p < .05 was considered to be statistically significant. All statistical analyses were performed using JMP (SAS institute Inc., NC, USA).
Results
Among the 143 COPD patients, 122 underwent chest CT and 103 of these had centrilobular pulmonary emphysema as assessed by the radiologist; no subject had evidence of bronchiectasis. Among the 21 patients who only had plain chest radiography, seven showed distinct pulmonary hyperinflation. On the first visit to our clinic, 40 had already been treated either with LAMA, LABA, SABA, theophylline (Theo), inhaled corticosteroid (ICS) or short acting anti-cholinergic agent alone or in combination at other clinics. All 142 BA patients had asthmatic symptoms such as cough, wheeze or chest tightness at some time in their life. Ninety-three had been diagnosed as having BA before they visited our clinic and 83 had been treated either with SABA, ICS, LABA, leukotriene receptor antagonist or Theo alone or in combination.
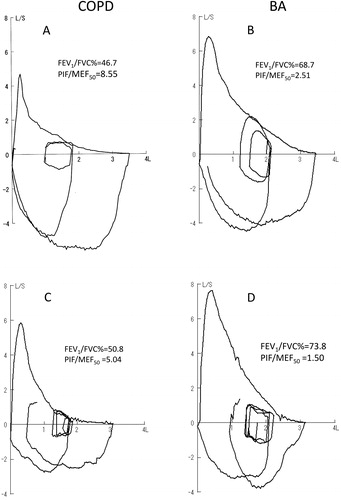
Typical flow volume curves from patients with COPD and BA who had FEV1/FVC% close to average value of each group are shown in . The striking differences are in the shape of the expiratory flow volume loops and of the maximal inspiratory loop. The patient with COPD has a marked reduction in MEF50 and MEF25 relative to PIF while the patient with BA has lesser decrease in MEF50 and MEF25 relative to PIF. Since 71 of COPD and 70 BA patients could not perform adequate forced inspiratory manoeuvre from RV to TLC (), only PIF from FRC to TLC was used for further analyses. The resulting PIF/MEF50 was 8.55 in the COPD patient versus 2.51 in the patient with BA (). In the patients for (COPD) and (D) (BA), PIF/MEF50 were 5.04 and 1.5, respectively.
Figure 1. (A) and (B) Typical flow-volume tracings in COPD and BA patients who had FEV1 values close to average of each group. Although peak expiratory flow and maximal expiratory flow 50% FVC (MEF50) was significantly reduced in COPD, peak inspiratory flow (PIF) was well preserved resulting in PIF/MEF50 being significantly higher in COPD than BA. (C) and (D) Flow volume tracings of COPD and BA patients who could performed forced inspiration from FRC to TLC but failed to achieve an adequate forced-inspiration from RV to TLC. PIF/MEF50 was larger in COPD than BA.
Anthropometric data are shown in . All the COPD patients except two women were current or ex-smokers with a median smoking history of 50 (35–75) pack years. The two non-smoking women had heavy second hand smoke exposure and chest CT showed distinct centrilobular emphysema in both women.
Table 1: Patient demographics and pulmonary function
On the other hand, the median smoking history of asthmatics was 0 (0–6) pack years and 44 were current or ex-smokers. The smoking history was significantly higher in COPD compared with BA and VC%P, FEV1%P and FEV1/FVC% were significantly lower in COPD. The FVC/VC ratio was not different between the two groups. PEF%P, MEF50%P, MEF25%P and PIF were significantly lower in COPD compared with BA. On the other hand, the I/E max ratio and PIF/MEF50 were significantly higher in COPD than in BA. ROC curve analyses were performed using parameters which showed significant differences between COPD and BA. Results showed that the AUC with their cut-off values in all parameters were significant (). Among these, FEV1/FVC%, PEF%P, MEF50% P and PIF/MEF50 showed AUC >0.8 and were included in additional analyses. Diagnostic sensitivity and specificity for the four parameters ranged from 0.81 to 0.93 and from 0.64 to 0.82, respectively. Using these four parameters, logistic regression analyses was done and the results are shown in . Although univariate analysis using each parameter showed that all four parameters significantly predicted COPD, multivariate analysis including the four parameters showed that only FEV1/FVC% <62.4 and PIF/MEF50 >3.06 were independent predictors of COPD. Using these two independent parameters, sex and age, multivariate analysis was performed. Although FEV1/FVC% and PIF/MEF50 remained as independent parameters to predict COPD, multivariate analysis after including sex, age and smoking history showed only FEV1/FVC% <62.4 was an independent predictor of COPD with an odds ratio (OR) of 6.5.
Table 2: ROC curve analyses between each pulmonary function parameters
Table 3: Diagnostic value for COPD of pulmonary function parameters with AUC > 0.8 by logistic regression analysis
Since the two groups were very heterogeneous for sex, age and especially for smoking history, we performed a subset analysis in which we selected only asthmatics who smoked for comparison to COPD. Forty-four smoking asthmatics with a median smoking history was 15 (8–30) were selected for this additional analysis (). All parameters except sex, VC%P and FVC/VC were significantly different between the two groups. ROC analyses showed that FEV1/FVC%, MEF50%P, MEF25%P and PIF/MEF50 were significant with AUC >0.8 (). The sensitivity and specificity for these four parameters ranged from 0.78 to 0.95 and from 0.73 to 0.82, respectively. The results of logistic regression analysis using cut-off values for smokers are shown in . Although all four parameters were significant in predicting COPD in the univariate analysis, multivariate analysis using these four parameters as well as sex and smoking history showed that FEV1/FVC% <63.4 and PIF/MEF50 >3.29 were independent predictors of COPD with OR of 4.3and 4.6, respectively.
Table 4: Patient demographics and pulmonary function in smokers
Table 5: ROC curve analysis for pulmonary function parameters in smokers
Table 6 :Diagnostic value for COPD of pulmonary function parameters with AUC > 0.8 by logistic regression analysis (smokers)
The combined predictive value of FEV1/FVC% and PIF/MEF50 () was analyzed by dividing all patients into three categories; patients negative for both FEV1/FVC% <62.4 and PIF/MEF50 >3.06, patients with either parameters and patients with both parameters. Results showed that OR for COPD was 12.4 compared with reference when patients had both parameters (). When patients had either parameter, the OR was 4.0 but was not significant compared with the reference. One hundred and twenty-three of 143 COPD patients were positive for both parameters and 27 of 142 BA patients were positive for both parameters. Post-test probability to predict COPD was 82.0% when patients were positive for both parameters.
Table 7: Diagnostic value of combination of FEV/FVC(%)<62.4 and PIF/MEF50 >3.06
The same analyses were performed for the smoker groups (). The value of combining FEV1/FVC% <63.4 and PIF/MEF50 >3.29 to predict COPD () was assessed by categorizing the subjects into three groups. Results showed that the OR for COPD was 20.7 compared with reference () when patients had both FEV1/FVC% <63.4 and PIF/MEF50 >3.29. Being positive for either parameter was also significantly predictive of COPD with OR 5.8. One hundred and twenty out of 143 COPD patients were positive for both parameters and seven out of 44 smoking BA patients were positive for both parameters. Post-test probability to predict COPD was 94.4% when patients were positive for both parameters in smokers.
Table 8: Diagnostic value of combination of FEV1/FVC(%)<63.4 and PIF/MEF50 >3.29
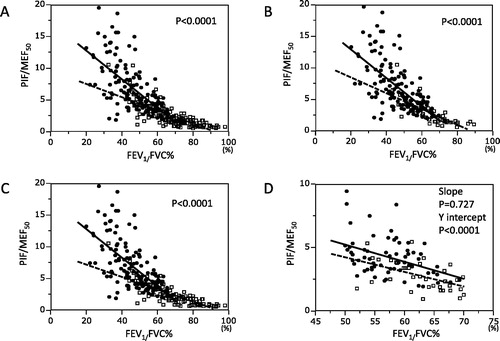
The associations between FEV1/FVC% and PIF/MEF50 are shown in . The slope and y intercept of the regression line for COPD were significantly larger than those for BA and the same was true for the comparison between COPD and BA patients who smoked () and for the comparison of COPD and non-smoking asthmatics (). Because the comparison could be influenced by the very different mean values for FEV1/FVC% in the groups, we selected subjects from both the groups with similar FEV1/FVC% for comparison. Since there was significant overlap in the data in the FEV1/FVC% range between 50% and 70%, patients within this range were selected for this comparison. Although the slopes for the groups were not significantly different, the y intercept was significantly higher in COPD than in BA () indicating that at comparable values for FEV1/FVC% patients with COPD had higher PIF/MEF50.
Figure 2. (A) The relationship between FEV1/FVC% and PIF/MEF50. Closed circles and solid regression line represent COPD and open squares and broken regression line represent BA. Analysis of co-variance was used to analyze differences between the two lines. The slope and y intercept for COPD were −0.23 and 17.3, respectively. The slope and y intercept for BA were −0.10 and 9.64, respectively. The regression lines were significantly different between COPD and BA. (B) The relationship between FEV1/FVC% and PIF/MEF50. Only BA patients who smoked were included for the same analysis as in . The slope and y intercept for COPD were −0.23and 17.3, respectively. The slope and y intercept for BA were −0.13 and 11.13, respectively. The regression lines were significantly different between COPD and BA. (C) The relationship between FEV1/FVC% and PIF/MEF50. Only BA patients who did not smoke were included for the same analysis as . The slope and y intercept for COPD were −0.23 and 17.3, respectively. The slope and y intercept for BA were −0.10 and 9.19, respectively. The regression lines were significantly different between COPD and BA. (D) The relationship between FEV1/FVC% and PIF/MEF50. COPD and BA patients whose FEV1/FVC% was between 50% and 70% were selected for this analysis. The slope and y intercept for COPD were −0.13 and 11.99, respectively. The slope and y intercept for BA were −0.12 and 10.12, respectively. Although the slope of both groups was not different, the y intercept of COPD was significantly larger than that of BA.
Discussion
The current study shows that PIF/MEF50 is a simple and clinically useful measure to aid in the differentiation of COPD and BA in the setting of the outpatient clinic. This distinction can have important implications with respect to treatment and prognosis.
COPD and BA are major obstructive lung diseases and although there are distinct differences between them, there are also substantial similarities especially in older patients [Citation7, Citation14]. Using pathological specimens Kuwano et al. reported that membranous airway walls were thicker than normal in both COPD and BA [Citation24] but the degree of thickening was much larger in BA than COPD suggesting that the mechanical properties of their airway wall could be different. Thickening of the airway wall in BA and COPD can also detected by CT and Nakano et al. reported that the airway lumen is larger in BA than COPD although the airway wall is thicker [Citation25], supporting the notion that the mechanical properties of the asthmatics’ airways could be different. Thickening of the airway wall in BA includes thickening of the basal lamina, subepithelial layer and especially the smooth muscle layer [Citation26]. On the other hand, loss of alveolar attachments is a distinct feature of COPD, while thickening of the basal lamina and smooth muscle layer are not as prominent [Citation27]. In a recent study, Smith et al. showed that the airway walls of COPD patients are actually thinner than those of controls when the dimensions of the airways are matched [Citation28]. During forced expiration, the intrathoracic airway wall downstream of the equal pressure point is exposed to hoop stress from the outside since the pressure outside of the airway becomes larger than inside [Citation29]. Since the pressure inside of the airway decreases progressively along the airway toward the mouth during forced expiration, the airway will be compressed to a variable extent depending on the elastic properties of the airway wall. Thickening of the airway wall and the increased smooth muscle tone observed in bronchial asthma could make airways downstream of the equal pressure point more resistant to compression. We previously reported that airways were more resistant to collapse when bronchoconstriction was induced by carbachol in canine and rabbit lungs [Citation30, Citation31]. Since the airway walls of COPD patients are thinner and smooth muscle tone is less than in BA, downstream airways would be more susceptible to collapse during forced expiration resulting in lower maximal expiratory flow [Citation32]. On the other hand, during inspiration peribronchial pressure is more negative than intra-airway pressure and thus airway dilatation would be expected. Since the airways in COPD are thinner and the tone is less, one would predict greater inspiratory distensibility in COPD than in BA. These considerations led us to predict that the ratio of maximal inspiratory and expiratory flow could be larger in COPD than BA. Thoracic gas compression during forced expiration also contributes to lower MEF in emphysema-dominant COPD compared to bronchitis-dominant subjects [Citation33]. Since the dominant phenotype of COPD in Japan is emphysema this mechanism for decreased MEF could contribute to the ability of PIF/MEF50 to distinguish COPD from BA. Cerveri found that the MEF/PIF ratio at 50%FVC was lower in COPD patient than normal subject [Citation34]. They used MEF50/PIF50 as an index of airway collapsibility and found that it contributes to the prediction of emphysema which in keeping with our study. Since the majority of Japanese COPD patients were emphysema dominant, the difference in MEF50/PIF50 between COPD and BA patients in our study are probably contributed to by this phenomenon. Stanescu et al. reported that PIF in COPD was equivalent to that in normal subjects, yet PEF was significantly lower at all lung volumes. They suggested that this phenomenon was due to decreased parenchymal tethering and increased airway collapsibility in COPD [Citation35].
In the current study, we analyzed PIF and the inspiratory and expiratory flow ratio (I/E max ratio and PIF/MEF50) as potential new parameters to describe the mechanical properties of the airways. Although COPD and BA patients were very heterogeneous in terms of sex, age and smoking history (), univariate and multivariate analyses, demonstrated that FEV1/FVC% <62.4 and PIF/MEF50 >3.06 were independent diagnostic parameters with odds ratio of 5.4 and 3.0 even after sex and age were included (). However, after including smoking history FEV1/FVC% <62.4% remained the sole significant diagnostic parameter. Since the usual diagnostic challenge in the clinic is separating those with COPD from those with BA among subjects who smoke, we selected the group of BA patients who smoked for comparison and repeated these analyses (). Results showed that FEV1/FVC% <63.4 and PIF/MEF50 >3.29 were independent parameters to differentiate COPD and BA. Moreover, combination of these parameters had very high post-test probability (94.4%) to differentiate patients with COPD from asthmatics who smoke.
Since the two diagnostic parameters to predict COPD were independent, a relationship between the two parameters was analyzed using regression analysis and the results showed significant differences between COPD and BA (). For both the COPD and BA groups, PIF/MEF50 increased as FEV1/FVC% decreased indicating relative preservation of maximal inspiratory flows as expiratory flow decreases during disease progression. However, PIF/MEF50 was significantly larger in COPD than BA for those who had FEV1/FVC% less than 50% (), although the regression lines crossed between 50% and 70% FEV1/FVC%.
Since the range of FEV1/FVC% was skewed to low values for COPD, we selected patients with comparable expiratory airflow obstruction (FEV1/FVC% between 50% and 70%) and repeated the regression analysis. The result shows that the intercept of the regression lines of PIF/MEF50 versus FEV1/FVC% was significantly larger for COPD, although the slopes were not statistically different (). These results suggest that PIF/MEF50 may be particularly useful in differentiating COPD from BA in smokers whose FEV1/FVC% is in this range.
Support for a difference in mechanical properties of the airways in COPD and BA has been provided by results obtained using the forced oscillation technique (FOT). Paredi et al. [Citation36] reported that the difference between inspiratory and expiratory reactance was larger in COPD than in BA. Because of the pathological differences in the airway wall in COPD and BA [Citation24], the airway of COPD is more compressible as reflected in a lower MEF/PIF as reported by Cerveri and more distensible as reflected by a higher PIF/MEF50 in our report.
The differentiation of COPD and BA is not difficult for typical cases, using the GOLD and GINA criteria [Citation1, Citation2]. However, in daily practice in the outpatient clinic where tests of airway responsiveness or lung volumes are not available, differentiation may not be easy at the first visit, since both COPD and BA patients may show a positive bronchodilatory test [Citation37]. Smoking is also another confounding factor making differentiation of COPD and BA difficult. Our results in the patients who smoke, showed that an FEV1/FVC% <63.4 plus PIF/MEF50 >3.29 () differentiated COPD and BA patients with very high probability.
Since the criteria for selecting the best flow volume traces are based on expiratory parameters [Citation17], most laboratory technicians tend to focus on coaching patients to generate reproducible maximal expiratory effort. In our laboratory, technicians also devote attention to the inspiratory manoeuvre and coach the patients to breathe in as rapidly and as much as possible from FRC to TLC before expiring forcibly from full inspiration without delay. Maximal expiratory flow has been reported to be greater when rapid inspiration to TLC is followed by immediate expiration compared with slow inspiration and breath holding before expiration in normal subject and patients [Citation38, Citation39]. Therefore, the manoeuvre proposed here is potentially beneficial for measuring not only maximal inspiratory flow but also maximal expiratory flow.
In the current study, we have chosen maximal inspiratory flow from FRC for the inspiratory parameter. Maximal inspiratory flow was sometimes slightly larger when inhalation was initiated from RV rather than from FRC as shown in . However, maximal inspiratory and expiratory manoeuvres demand a large effort for the patient and the second maximal inspiratory manoeuvre from RV was not successful in many older patients as shown . Therefore, we used the maximal inspiratory flow from FRC since it was more consistent. We also analyzed the predictive value of the ratio of the maximal inspiratory and expiratory flow values (I/E max ratio). Although the I/E max ratio was larger in COPD than BA (), this parameter did not have the power to differentiate the two conditions since its AUC was less than 0.8 (). We also analyzed iso-volume inspiratory and expiratory flow at 50% FVC. Unlike MEF50, inspiratory flow at 50% of FVC could not be determined in some individuals since FRC was larger than 50% of FVC. Therefore, we used maximal inspiratory flow from FRC as an inspiratory parameter. As the expiratory flow parameters, we used PEF%P, MEF50%P and MEF25%P. Among these parameters, PEF is effort dependent while the others are effort independent. Since MEF50 and MEF25 are effort independent, they should reflect the mechanical properties of airway during expiration better than PEF. Comparison of inspiratory and expiratory flow was also analyzed using MEF25 and the results were similar to those using MEF50. FEV1/FVC%<63.4% was the significant predictor of COPD. When smokers were selected from both groups, FEV1/FVC%<63.4% and PIF/MEF25 >8.1 were both independent predictors of COPD as shown in . Either PIF/MEF50 or PIF/MEF25 was an significant parameter to differentiate COPD and smoking BA using simple spirometry at the first visit
Table 9 :Diagnostic value for COPD of pulmonary function parameters with AUC > 0.8 by logistic regression analysis (smokers)
Conclusion
PIF/MEF50 and FEV1/FVC% are independent diagnostic parameters to differentiate COPD and BA. The new parameter proposed in this study can easily be obtained by adding maximal inspiratory effort from FRC to routine spirometry. Since acquiring of this parameter is simple and needs no sophisticated lung function equipment, it may be useful in daily practice. Results of the current study found that the combination of FEV1/FVC% and PIF/MEF50 was especially useful for differentiating COPD from BA in patients who smoke. The differentiation may aid in the selection of initial treatment in this group of patients. It would be interesting to assess this parameter in patients with ACO to investigate the mechanics of their airways.
Authors’ contributions
MO takes full responsibility for the content of the manuscript, including the data and analysis. MO and PDP had full access to all the data in the study and take responsibility for study design, data analysis and writing manuscript. KI and YU were responsible for selecting patients and data acquisition from the patients’ record for the study. HT substantially contributed for the study design and statistical analysis.
Statement of ethics
Informed consent was obtained from all patients and this study was approved by the ethics committee of Fujita Health University (#13-295).
Declaration of interest
The authors declare that they have no conflict of interests.
| Abbreviations | ||
| AUC | = | area under the receiver-operating characteristic curve |
| BA | = | bronchial asthma |
| COPD | = | chronic obstructive pulmonary disease |
| FEV1%P | = | forced expiratory volume in one second expressed as percent predicted |
| FEV1/FVC% | = | forced expiratory volume in one second/forced vital capacity expressed as a percent |
| FVC | = | forced vital capacity |
| FVC/VC | = | forced vital capacity/vital capacity ratio |
| ICS | = | inhaled corticosteroid |
| I/E | = | peak inspiratory/expiratory flow ratio |
| MEF50% P | = | maximal expiratory flow at 50% FVC percent predicted |
| MEF25%P | = | maximal expiratory flow at 25% FVC percent predicted |
| PEF%P | = | peak expiratory flow percent predicted |
| PIF | = | peak inspiratory flow |
| PIF/MEF50 | = | ratio of peak inspiratory flow/maximal expiratory flow at 50% FVC |
| ROC | = | receiver-operating characteristic |
| VC | = | vital capacity |
Acknowledgments
We greatly appreciate Tomomi Isogai and Yukari Iwai, the technicians of pulmonary function laboratory at Fujita Health University hospital, for their dedicated work especially in coaching patients to obtain maximal inspiratory and expiratory flow volume curve.
Additional information
Funding
References
- Global initiative for chronic obstructive lung disease. http://www.korektorzdrowia.pl/wp-content/uploads/gold-2014.pdf#search=‘GOLD+guideline+in+2014’
- Global initiative for asthma management and prevention. https://ginasthma.org/wp-content/uploads/2019/01/2014-GINA.pdf#search=‘GINA2014’
- McDonough JE, Yuan R, Suzuki M, et al. Small-airway obstruction and emphysema in chronic obstructive pulmonary disease. N Engl J Med. 2011;365(17):1567–1575. doi:10.1056/NEJMoa1106955.
- Pare PD, Mitzner W. Airway-parenchymal interdependence. Compr Physiol. 2012;2(3):1921–1935.
- Pauwels RA, Buist AS, Ma P, et al. Global strategy for the diagnosis, management, and prevention of chronic obstructive pulmonary disease: National Heart, Lung, and Blood Institute and World Health Organization Global Initiative for Chronic Obstructive Lung Disease (GOLD): executive summary. Respir Care. 2001;46(8):798–825.
- Fu JJ, McDonald VM, Gibson PG, et al. Systemic inflammation in older adults with asthma–COPD overlap syndrome. Allergy Asthma Immunol Res. 2014;6(4):316–324. doi:10.4168/aair.2014.6.4.316.
- Vestbo J, Hurd SS, Agusti AG, et al. Global strategy for the diagnosis, management, and prevention of chronic obstructive pulmonary disease: GOLD executive summary. Am J Respir Crit Care Med. 2013;187(4):347–365. doi:10.1164/rccm.201204-0596PP.
- Goedhart DM, Zanen P, Lammers J-WJ. Relevant and redundant lung function parameters in discriminating asthma from COPD. COPD: J Chron Obstruct Pulmon Dis. 2006;3(1):33–39. doi:10.1080/15412550500493261.
- Gonzalez A, Fernandez A, Guardia S, et al. Supramaximal flows: comparison between asthmatics and patients with chronic obstructive pulmonary disease. Respiration. 2011;81(3):206–210. doi:10.1159/000319563.
- Pellegrino R, Sterk PJ, Sont JK, et al. Assessing the effect of deep inhalation on airway calibre: a novel approach to lung function in bronchial asthma and COPD. Eur Respir J. 1998;12(5):1219–1227. doi:10.1183/0903.1936.98.12051219.
- Mishima M. Physiological differences and similarities in asthma and COPD – based on respiratory function testing. Allergol Int. 2009;58(3):333–340. doi:10.2332/allergolint.09-RAI-0131.
- Colebatch HJ, Finucane KE, Smith MM. Pulmonary conductance and elastic recoil relationships in asthma and emphysema. J Appl Physiol. 1973;34(2):143–153. doi:10.1152/jappl.1973.34.2.143.
- Benfante A, Bellia M, Scichilone N, et al. Airway distensibility by HRCT in asthmatics and COPD with comparable airway obstruction. COPD. 2013;10(5):560–566. doi:10.3109/15412555.2013.773304.
- Gibson PG, Simpson JL. The overlap syndrome of asthma and COPD: what are its features and how important is it? Thorax. 2009;64(8):728–735. doi:10.1136/thx.2008.108027.
- Corrao WM, Braman SS, Irwin RS. Chronic cough as the sole presenting manifestation of bronchial asthma. N Engl J Med. 1979;300(12):633–637. doi:10.1056/NEJM197903223001201.
- Johnson D, Osborn LM. Cough variant asthma: a review of the clinical literature. J Asthma.1991;28(2):85–90. doi:10.3109/02770909109082732.
- Miller MR, Hankinson J, Brusasco V, et al. Standardisation of spirometry. Eur Respir J. 2005;26(2):319–338. doi:10.1183/09031936.05.00034805.
- Pellegrino R, Viegi G, Brusasco V, et al. Interpretative strategies for lung function tests. Eur Respir J. 2005;26(5):948–968. doi:10.1183/09031936.05.00035205.
- Crapo RO, Casaburi R, Coates AL, et al. Guidelines for methacholine and exercise challenge testing-1999. This official statement of the American Thoracic Society was adopted by the ATS Board of Directors, July 1999. Am J Respir Crit Care Med. 2000;161(1):309–329. doi:10.1164/ajrccm.161.1.ats11-99.
- Baldwin ED, Cournand A, Richards DW, et al. Pulmonary insufficiency; physiological classification, clinical methods of analysis, standard values in normal subjects. Medicine (Baltimore). 1948;27(3):243–278. doi:10.1097/00005792-194809000-00001.
- Berglund E, Birath G, Bjure J, et al. Spirometric studies in normal subjects. I. Forced expirograms in subjects between 7 and 70 years of age. Acta Med Scand. 2009;173(2):185–192. doi:10.1111/j.0954-6820.1963.tb16520.x.
- Cherniack RM, Raber MB. Normal standards for ventilatory function using an automated wedge spirometer. Am Rev Respir Dis. 1972;106(1):38–46. doi:10.1164/arrd.1972.106.1.38.
- Ruopp MD, Perkins NJ, Whitcomb BW, et al. Youden index and optimal cut-point estimated from observations affected by a lower limit of detection. Biom J. 2008;50(3):419–430. doi:10.1002/bimj.200710415.
- Kuwano K, Bosken CH, Pare PD, et al. Small airways dimensions in asthma and in chronic obstructive pulmonary disease. Am Rev Respir Dis. 1993;148(5):1220–1225. doi:10.1164/ajrccm/148.5.1220.
- Nakano Y, Van Tho N, Yamada H, et al. Radiological approach to asthma and COPD – the role of computed tomography. Allergol Int. 2009;58(3):323–331. doi:10.2332/allergolint.09-RAI-0124.
- Bosse Y, Pare PD, Seow CY. Airway wall remodeling in asthma: from the epithelial layer to the adventitia. Curr Allergy Asthma Rep. 2008;8(4):357–366. doi:10.1007/s11882-008-0056-0.
- Hogg JC. Pathophysiology of airflow limitation in chronic obstructive pulmonary disease. Lancet. 2004;364(9435):709–721. doi:10.1016/S0140-6736(04)16900-6.
- Smith BM, Hoffman EA, Rabinowitz D, et al. Comparison of spatially matched airways reveals thinner airway walls in COPD. The Multi-Ethnic Study of Atherosclerosis (MESA) COPD Study and the Subpopulations and Intermediate Outcomes in COPD Study (SPIROMICS). Thorax. 2014;69(11):987–996. doi:10.1136/thoraxjnl-2014-205160.
- Rodarte JR, Rehder K. The respiratory system. In: Fishman AP, editor. Volume III: Handbook of physiology. Bethesda (MD): American Physiological Society; 1986.
- Okazawa M, Vedal S, Verburgt L, et al. Determinants of airway smooth muscle shortening in excised canine lobes. J Appl Physiol. 1995;78(2):608–614. doi:10.1152/jappl.1995.78.2.608.
- Okazawa M, Pare PD, Lambert RK. Compliance of peripheral airways deduced from morphometry. J Appl Physiol. 2000;89(6):2373–2381. doi:10.1152/jappl.2000.89.6.2373.
- Kurosawa H, Kohzuki M. Images in clinical medicine. Dynamic airway narrowing. N Engl J Med. 2004;350(10):1036–1036. doi:10.1056/NEJMicm030626.
- Pellegrino R, Crimi E, Gobbi A, et al. Severity grading of chronic obstructive pulmonary disease: the confounding effect of phenotype and thoracic gas compression. J Appl Physiol. 2015;118(7):796–802. doi:10.1152/japplphysiol.00801.2014.
- Cerveri I, Dore R, Corsico A, et al. Assessment of emphysema in COPD: a functional and radiologic study. Chest. 2004;125(5):1714–1718. doi:10.1378/chest.125.5.1714.
- Stanescu D, Veriter C, Van de Woestijne KP. Maximal inspiratory flow rates in patients with COPD. Chest. 2000;118(4):976–980. doi:10.1378/chest.118.4.976.
- Paredi P, Goldman M, Alamen A, et al. Comparison of inspiratory and expiratory resistance and reactance in patients with asthma and chronic obstructive pulmonary disease. Thorax. 2010;65(3):263–267. doi:10.1136/thx.2009.120790.
- Hanania NA, Celli BR, Donohue JF, et al. Bronchodilator reversibility in COPD. Chest. 2011;140(4):1055–1063. doi:10.1378/chest.10-2974.
- Tzelepis GE, Zakynthinos S, Vassilakopoulos T, et al. Inspiratory maneuver effects on peak expiratory flow. Role of lung elastic recoil and expiratory pressure. Am J Respir Crit Care Med. 1997;156(5):1399–1404. doi:10.1164/ajrccm.156.5.9702009.
- D’Angelo E, Prandi E, Marazzini L, et al. Dependence of maximal flow-volume curves on time course of preceding inspiration in patients with chronic obstruction pulmonary disease. Am J Respir Crit Care Med. 1994;150(6 Pt 1):1581–1586. doi:10.1164/ajrccm.150.6.7952618.