
Abstract
Smoking is the main risk factor for the development of chronic obstructive pulmonary disease (COPD) and is known to have deleterious effects on bone metabolism. However, the effects on bone collagen matrix during the development of COPD are unclear. The aim of this study was to evaluate the temporal effect of cigarette smoke exposure on bone type I collagen during COPD development in a cigarette smoke-induced model. C57BL/6 mice were allocated to three groups: control (C), animals exposed to filtered air for 1, 3 and 6 months; cigarette smoke (S), animals exposed to cigarette smoke for 1, 3 and 6 months; provisional smoking (PS), animals exposed to cigarette smoke for 3 months, followed by another 3 months of filtered air exposure. Evaluation of the respiratory mechanics and alveolar enlargement were performed. Femoral and tibial extraction was also performed to evaluate the type I collagen by immunofluorescence and COL1A1 gene expression. Exposure to cigarette smoke led to an alveolar enlargement and progressive reduction in lung tissue resistance and elastance, progressive reduction of type I collagen and reduction in COL1A1 gene expression. Although we did not observe any improvement in the functional and histological parameters in the provisional smoking group, we detected an increase in COL1A1 gene expression. A worsening in bone collagen matrix is part of the initial physiopathological events during COPD development and the smoking cessation induced an evident recovery of COL1A1 expression, possibly to attempt at tissue repair.
Introduction
Smoking remains the global leader in causes of preventable deaths, accounting for approximately 6 million deaths/year and over 1.5 trillion dollars/year of damage to the world economy [Citation1]. Cigarette smoke is composed of approximately 5,000 toxic and carcinogenic chemicals and has two phases: volatile (gaseous) and particulate [Citation2]. The risks associated with smoking depend on factors such as age of onset, number of cigarettes per day, cigarette characteristics (filter type, nicotine and tar rate) and behavior (degree of inhalation) [Citation3].
The main causes of mortality associated with smoking are neoplasms (mainly lung) [Citation4], cardiovascular diseases [Citation5] and chronic obstructive pulmonary disease (COPD) [Citation6].
COPD is one of the leading causes of mortality and morbidity worldwide, with important social and economic impacts. This condition occurs as a result of a complex interaction between long-term cumulative exposure to harmful gases and particles and a number of other well-known factors such as genetics, airway hyperresponsiveness, and poor lung development in childhood [Citation7]. COPD is characterized by persistent and often progressive airflow limitation associated with an exacerbated chronic inflammatory response of the airways and lungs associated with smoking [Citation8].
Inflammatory and structural cells release cytokines, growth factors and proteases in the pulmonary site, causing destruction of the alveolar walls (emphysema) and structural remodeling, resulting in fibrosis, mainly in small airways [Citation9]. The main clinical manifestations of COPD are chronic and progressive dyspnea, chronic cough and bronchial hypersecretion, formerly described in terms of “chronic bronchitis” and “pulmonary emphysema” [Citation7].
COPD is also known to have several extrapulmonary manifestations, including a reduction in bone mineral density, body mass index and muscle strength. These manifestations are closely linked to increased systemic inflammation and oxidative stress generated by smoking, the main agent in the pathophysiology of this disease [Citation10,Citation11].
In the 1970s, the association between smoking and bone fracture in postmenopausal women was described [Citation12]. Experimental and in vitro studies have also shown that smoking can affect bone remodeling by inducing a reduction in bone mineral density [Citation13,Citation14], stimulating osteoclastogenesis, inhibiting osteoblastogenesis [Citation15] and altering bone fibrillar matrix [Citation16]. Smoking has also shown deleterious effects, promoting delayed healing or even nonhealing of fractures [Citation17,Citation18].
In patients diagnosed with COPD, a reduction in bone mineral density (osteopenia/osteoporosis) and a higher prevalence of vertebral fractures have also been identified [Citation11]. Vertebral fracture due to bone insufficiency in a patient with COPD generates morbidity not only related to the fracture itself but also to the impairment of pulmonary function due to the reduction of the thoracic cavity volume.
Studies in an experimental model of COPD have shown that long-term COPD can impair the normal growth of the lumbar vertebrae, as well as deteriorate bone quality by disorientation of collagen fibers [Citation19]. Similarly, in an elastase-induced model, some authors showed that the lumbar vertebrae and femurs/tibiae exhibited trabecular bone loss and impaired osteogenic activity at the 24-week follow-up [Citation20].
Collagens are a heterogeneous family of extracellular matrix glycoproteins and are involved in the formation of macromolecular networks with not only supportive functions but also effects on cell differentiation, adhesion, migration and proliferation [Citation21].
Type I collagen makes up 90% of bone organic mass and is the major collagen in tissues such as tendons, skin, ligaments, cornea and interstitial connective tissues. This molecule is responsible for bone biomechanical properties of tensile strength, compression and torsion, especially after calcification [Citation22]. Its triple helix is composed of two identical alpha-1 and one alpha-2 [α1 (I) 2 α2 (I)] chains synthesized from the COL1A1 and COL1A2 genes [Citation23].
Considering the importance of type I collagen in bone tissue integrity to support mechanical forces and the increase in bone fragility in smokers and COPD patients [Citation19,Citation20], this study aims to evaluate the temporal effect of cigarette smoke exposure and smoking cessation on the bone collagen matrix during COPD development in a cigarette smoke-induced model. To our knowledge, no previous study has focused on the long-term temporal effects of cigarette smoke on changes in type I collagen fibers of the bone matrix.
Methods
Experimental procedures
This experimental study required sixty-six C57BL/6 young adult male mice (6–8 weeks), with an average weight of 26 g, provided by the Central Animal Facility of the University of São Paulo School of Medicine. All animals received care in compliance with the Guide for the Care and Use of Laboratory Animals [Citation24]. This study was approved by the Review Board for human and animal studies from the University of São Paulo School of Medicine (Project Number 937/2017).
The animals were housed in specific polypropylene boxes for mice (approximately 5 animals/box) with the following measures (30 × 20 × 13 cm) at the Experimental Therapeutics Laboratory. All animals had unrestricted access to water and feed (Nuvilab® CR-1 Irradiada, Quimtia S.A., Colombo/PR, Brazil) containing 1.4% calcium and 0.8% phosphorus. The animals were also maintained in a 12-hour light-dark cycle, with light from 7 am to 7 pm, at an ambient temperature of 20 ± 2 °C and were cared for a trained and qualified professional. An acclimatization period of at least 3 weeks was established.
Experimental groups
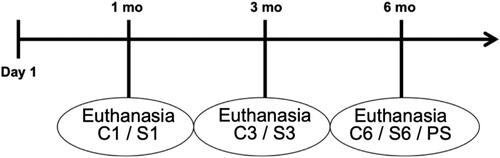
The animals were randomly assigned to three groups: control (C), composed of 30 animals exposed to filtered air for 1 month (C1 = 10), 3 months (C3 = 10) and 6 months (C6 = 10) until euthanasia; smoke (S), composed of 30 animals exposed to cigarette smoke for 1 month (S1 = 10), 3 months (S3 = 10) and 6 months (S6 = 10) until euthanasia; and provisional smoke (PS), composed of 6 animals exposed to cigarette smoke for 3 months, followed by another 3 months of exposure to filtered air ().
Figure 1. Timeline of the study. mo: month; C1: control group 1 month (10 animals); S1: smoke group 1 month (10 animals); C3: control group 3 months (10 animals); S3: smoke group 3 months (10 animals); C6: control group 6 months (10 animals); S6: smoke group 6 months (10 animals); PS: provisional smoking group (6 animals).
Exposure to cigarette smoke to induce COPD
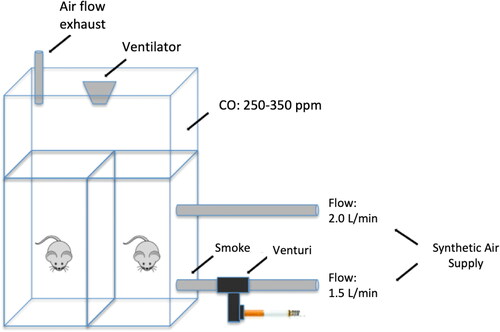
Exposure to cigarette smoke was performed according to a protocol previously described by Toledo et al. [Citation25], which involves using a 28 L inhalation chamber containing two inlet points for air and smoke supplies, one outlet point and one aerator to increase the air/smoke mixture. The synthetic air, connected to one of the inlets, has a flow rate of 2 L/min. The synthetic air connected to the second inlet has a flow rate of 1.5 L/min and passes through a Venturi system connected to a lit cigarette that suctions the smoke into the chamber (). The levels of carbon monoxide (CO) maintained inside the chamber ranged from 250 to 350 ppm. The animals were exposed to 10 commercially filtered cigarettes per exposure (0.8 mg nicotine, 10 mg tar and 10 mg CO). This form of exposure maintains an average concentration of carboxyhemoglobin at 10 ± 1.3% and a total concentration of particulate matter at approximately 354.8 ± 50.3 μg/m3.day. Animals were exposed twice a day for 30 min per exposure, 5 days per week over 1, 3 and 6 months depending on the exposure group (S1 = 1 month, S3 = 3 months, S6 = 6 months). Control animals C1, C3 and C6 received only filtered air for 1, 3 and 6 months.
Figure 2. Cigarette smoke exposure chamber.
During the exposure to cigarette smoke, we had some animal losses related to the time of exposure and prolonged follow-up. Losses occurred in groups C6 (3 animals), S1 (1 animal), S3 (2 animals) and PS (2 animals).
Evaluation of respiratory mechanics
To evaluate the respiratory mechanics, we intraperitoneally anesthetized the animals with thiopental (50 mg/kg), and they were tracheostomized with the installation of a 20 G vascular catheter connected to a respirator for small animals (FlexiVent, SCIREQ, Canada).
To avoid respiratory efforts and interference in the analyses, we administered pancuronium (0.2 mg/kg), a nondepolarizing neuromuscular blocker, to the animals, followed by mechanical ventilation at a tidal volume of 10 mL/kg and respiratory rate of 120 cycles/minute.
To calculate the system impedance (ZL), we used the constant phase model described by Hantos et al. [Citation26], in which Raw and Iaw represent the airway resistance and the airway inertance (without interference from lung tissues); j is an imaginary unit; ω is the angular frequency; Gtis assesses pulmonary tissue resistance; and Htis evaluates lung tissue elastance (accumulated energy).
Thus, ZL = Raw + j. ω. Iaw + (Gtis - j. Htis)/ωα and α = (2/π). arctg (Htis/Gtis).
The values of Htis and Gtis were multiplied by the body weight of each animal to obtain normalized values. This normalization has been described in previous studies and is performed due to the weight variability caused by exposure to cigarette smoke over the months [Citation25,Citation27,Citation28]. Data of body weight of each group are shown in .
Table 1. Data of body weight of each group are shown as mean and standard deviation.
Histological evaluation of alveolar enlargement
After assessment of the respiratory mechanics, the animals were euthanized at the times corresponding to each group (1, 3 or 6 months). Euthanasia was performed by exsanguination through a section of the inferior vena cava.
The lungs were removed and fixed in 10% formaldehyde through tracheal catheterization and infusion at constant pressure (20 cm H2O) for 24 h [Citation29]. The fixed lungs were later included in paraffin cross-sections with a thickness of 4 μm and underwent histological preparation with hematoxylin and eosin staining (H&E).
The microscopic quantification of alveolar enlargement was carried out through the evaluation of the mean linear intercept (Lm), an index that is equivalent to the mean diameter of the distal air spaces [Citation30].
Conventional morphometric analysis was performed using a standard optical microscope (Olympus U-DO, Olympus Co., Japan) using the principle of counting points in tissue structures described by Hsia et al. (2010) [Citation31]. Through a reticule with 100 points and 50 line segments, in a 200x magnification and analysis of 15 random fields, the number of times the lines of the reticulum cross (intercept) the walls of the alveoli was quantified. Bronchi and vascular structures were eliminated from the analysis.
The Lm index (μm) was calculated by the ratio of the sum of all segments of the reticulum (Ltotal = 2500 μm) by the average number of times that the lines of the reticulum intersect the walls of the alveoli (Nm) in the most peripheral regions of the parenchyma and around the airways.
Thus, Lm = Ltotal/Nm and Lm = 2500 μm/Nm.
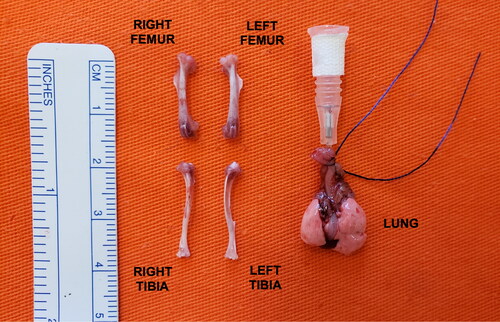
After euthanasia at the specified times (1, 3 or 6 months) and lung extraction, all animals underwent femoral and tibial bone extraction procedures ().
Figure 3. Extracted tissues (femur, tibia and lung). The dissected bones were completely clean from the surrounding tissues to avoid interference in gene expression analysis.
Immunofluorescence and morphometry
To perform immunostaining for type I collagen, the tibiae of each animal were extracted and cleaned from adjacent tissues. A 4 µm thick slices were mounted on slides previously treated with 3-aminopropyltriethoxy silane (Sigma Chemical Co., St. Louis, MO, USA), dewaxed in xylene and hydrated in graded ethanol. For negative controls, the sections were incubated with fetal bovine serum instead of primary antibody. The same treatment was carried out for immunofluorescence detection.
For exposure and recovery of antigenic sites, the samples were submitted to digestion with citrate buffer, pH = 6.0 (Diagnostic BioSystems, CA, USA), for 10 min at 95 °C. For the immunodetection of collagen type I, nonspecific sites were blocked with 5% bovine serum albumin (BSA) in phosphate-buffered saline (PBS) for 30 min at room temperature. Then, the samples were incubated overnight at 4 °C, in a humidified atmosphere, with rabbit polyclonal antibodies type I collagen (1:50, Rockland Immunochemicals, Gilbertsville, PA, USA) diluted in PBS solution plus BSA 1%. The samples were washed in PBS with 0.05% Tween 20 and incubated for 60 min at room temperature with Alexa 488-conjugated goat antirabbit IgG (1:200, Invitrogen, Life Technologies, OR, USA), diluted in PBS containing 0.005% Evans blue [Citation32].
The immunostained slides were viewed using an Olympus BX-51 immunofluorescence microscope (Olympus BX51, Olympus Co., Tokyo, Japan). Histomorphometry was used to quantify the presence of fibers immunostained with collagen type I in the bone trabeculae in the tibial proximal metaphyseal region via digitalized image analysis at 400x magnification.
The digitalization and image evaluation system consists of a photographic camera (Olympus Co., St. Laurent, Quebec, Canada), attached to the immunofluorescence microscope, which captures the images and sends them to the monitor through a scanning system (Oculus TCX, Coreco, Inc., St. Laurent, Quebec, Canada). The images are then processed using specific software (Image - Pro Plus 6.0.) that allows the analysis of the immunostained fibers in green tones, and the results are presented as a percentage in relation to the total area of the trabeculae. The final result of each slide is described as the average of all bone trabeculae evaluated.
Quantitative Real-Time Polymerase Chain Reaction (qRT-PCR)
For the evaluation of COL1A1 gene expression, the femoral bone tissues, previously extracted and cleaned from adjacent tissues, were stored at −80 °C. After completion of the exposures in all groups, the tissues were macerated to isolate total RNA according to the standard RNA Trizol® isolation protocol (Invitrogen Co., Carlsbad, CA, USA).
The RNA was dissolved in 20 μl of deionized H2O and treated with diethylpyrocarbonate (DEPEC; Merck, Germany), which is a strong ribonuclease inhibitor. Total RNA was quantified by optical density measurements (NanoVue Plus® Spectrophotometer; GE).
We performed reverse transcription from the RNA to cDNA using the Super Script lll First-Strand Synthesis Super Mix for qRT-PCR (Invitrogen, Carlsbad, CA, USA). The sequence of the genes of interest was acquired through at http://www.ncbi.nlm.nih.gov/nucleotide, and is shown in . Gene expression was evaluated using a StepOnePlus Real-Time PCR System (Applied Biosystems, Foster City, CA, USA) and SYBR Green as the fluorescent dye (Platinum SYBR Green qPCR SuperMix-UDG from Invitrogen, Carlsbad, CA, USA). All reactions were accompanied by a negative control (all reagents, except the sample). The amplifications were normalized using the GAPDH housekeeping gene as an internal control, since its expression remains constant in mice and is not influenced by exposure to cigarette smoke.
Table 2. Oligonucleotides employed for quantitative qRT-PCR.
Gene expression was assessed using the 2-ΔΔCt method [Citation33]. In this method, the ΔCt that corresponds to the number of Ct (cycle threshold) of the studied gene normalized by the Ct of the GAPDH gene is calculated. The Ct of the target gene corresponds to the number of amplification cycles necessary for the accumulated fluorescence signal of the reaction to exceed the threshold.
Thus, ΔCt COL1A1 = Ct COL1A1 − CtGAPDH and ΔΔCt = ΔCt COL1A1 − ΔCtControl Mean
The qRT-PCR reactions were standardized to determine the best annealing temperature for the gene under study. The sizes of the fragments generated by qRT-PCR were validated on a 1.5% agarose gel and stained with ethidium bromide. The cycling conditions for all genes were as follows: 95 °C for 10 min, followed by 35 cycles at 95 °C for 15 s, 60 °C for 30 s, and 72 °C for 30 s. A melting curve was performed to verify and certify a single fluorescence peak for each sample analyzed (95 °C for 15 s, 65 °C for 30 s, and 95 °C for 15 s).
Statistical analysis
All comparison data among the smoke (S), control (C) and provisional smoke (PS) groups at the different times studied were performed using IBM SPSS® Statistics V21.0 for Windows software. The level of significance used was 5% (α = 0.05).
The descriptive analyses for the quantitative data that showed normal distribution are expressed as the mean and standard deviation. For quantitative data without a normal distribution, the results are expressed as the median and interquartile range IQ (25–75%). The assumptions of the normal distribution in each group and the homogeneity of the variances among groups were evaluated using the Shapiro-Wilk test and the Levene test, respectively.
For the quantitative data that showed a normal distribution in which two factors (group and time) were analyzed, the double factor analysis of variance test (ANOVA) was used, and when it was necessary to perform multiple comparisons of means, the Bonferroni test was used. When the data did not present a normal distribution, we used the Mann-Whitney test for the group factor. For the time factor, the Kruskal-Wallis test was used, and when it was necessary to perform multiple comparisons, the Dunn test was used.
In the comparison among groups (control, smoke and provisional smoke) with a time of six months, one-way ANOVA was used.
Results
Respiratory mechanics
The parameters of the mechanical assessment of the respiratory system, which included Raw, Gtis and Htis in the control and smoking groups with 1 (C1 and S1), 3 (C3 and S3) and 6 months (C6, S6 and PS) of follow-up, are shown in , respectively.
Figure 4. Airway resistance assessment (Raw). Statistical analyses were performed with double factor analysis of variance test (ANOVA) in A, B and C; and one-way ANOVA test in D. The data are shown as mean and standard deviation (Control: 1 mo, n = 10; 3 mo, n = 10; 6 mo, n = 7. Smoke: 1 mo, n = 9; 3 mo, n = 8; 6 mo, n = 10. PS: n = 4). PS: provisional smoke. mo: month.
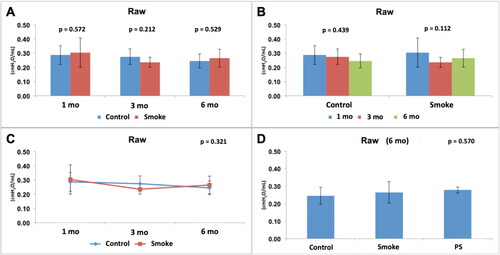
Figure 5. Assessment of lung tissue resistance (Gtis). Statistical analyses were performed with double factor analysis of variance test (ANOVA) in A, B and C; and one-way ANOVA test in D. The data are shown as mean and standard deviation (Control: 1 mo, n = 10; 3 mo, n = 10; 6 mo, n = 7. Smoke: 1 mo, n = 9; 3 mo, n = 8; 6 mo, n = 10. PS: n = 4). PS: provisional smoke. mo: month. *Statistically significant difference present in the Bonferroni post-test.
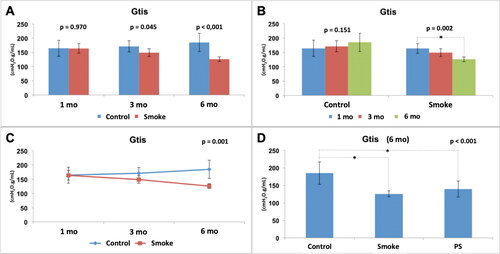
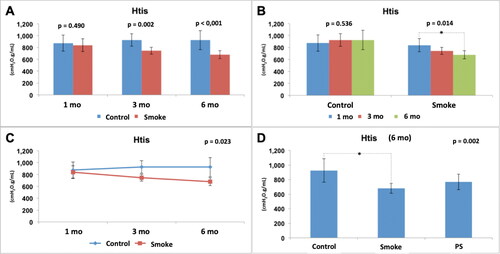
Figure 6. Assessment of lung tissue elastance (Htis). Statistical analyses were performed with double factor analysis of variance test (ANOVA) in A, B and C; and one-way ANOVA test in D. The data are shown as mean and standard deviation (Control: 1 mo, n = 10; 3 mo, n = 10; 6 mo, n = 7. Smoke: 1 mo, n = 9; 3 mo, n = 8; 6 mo, n = 10. PS: n = 4). PS: provisional smoke. mo: month. *Statistically significant difference present in the Bonferroni post-test.
The assessment of airway resistance (Raw) did not show any significant difference between the experimental groups () [C1 × S1 (p = 0.572), C3 × S3 (p = 0.212), C6 × S6 (p = 0.529)]. Moreover, there was no significant difference between the control groups or between the smoke groups over time () [C1 × C3 × C6 (p = 0.439), S1 × S3 × S6 (p = 0.112)]. The results also showed that for this parameter (Raw), the control condition and smoking are independent of time (p = 0.321) (). After addition of the PS group in the analysis of the 6-month groups (), there was also no significant difference among the groups (p = 0.570).
The assessment of pulmonary tissue resistance (Gtis) normalized by weight showed a reduction in the values in the groups with exposure to cigarette smoke compared to the control groups with 3 and 6 months of follow-up () [C1 × S1 (p = 0.970), C3 × S3 (p = 0.045), C6 × S6 (p < 0.001)]. There was no significant difference among the control groups over time () [C1 × C3 × C6 (p = 0.151)]. However, there was a significant reduction among the groups with exposure to cigarette smoke over time () [S1 × S3 × S6 (p = 0.002)], and the Bonferroni post-test for multiple comparisons showed that there was a difference between S1 and S6 (p = 0.001). The results also showed that for this parameter (Gtis), control and smoking are time-dependent (p = 0.001) (). After addition of the PS group in the analysis of the 6-month groups (), there was a significant difference among the groups (p < 0.001), and the Bonferroni post-test for multiple comparisons showed that a difference was observed for C6 × S6 (p < 0.001) and C6 × PS (p = 0.013) but not for S6 × PS (p = 0.977), indicating that the 3-month pause of exposure to cigarette smoke that occurred in the PS group did not result in any improvement in the analyzed parameter (Gtis) compared to that in the S6 group.
The assessment of lung tissue elastance (Htis) normalized by weight showed a reduction in the values in the groups with exposure to cigarette smoke compared to the control groups with 3 and 6 months of follow-up () [C1 x × S1 (p = 0.490), C3 × S3 (p = 0.002), C6 × S6 (p < 0.001)]. There was no significant difference between the control groups over time () [C1 × C3 × C6 (p = 0.536)]. However, there was a significant reduction among the groups with exposure to cigarette smoke over time () [S1 × S3 × S6 (p = 0.014)], and the Bonferroni post-test for multiple comparisons showed that a difference occurred between S1 and S6 (p = 0.012). The results also showed that, for this parameter (Htis), control and smoking are time dependent (p = 0.023) (). After addition of the PS group in the analysis of the 6-month groups (), there was a significant difference among the groups (p = 0.002), and the Bonferroni post-test for multiple comparisons showed that a difference occurred only between C6 and S6 (p = 0.002) and not between C6 and PS (p = 0.138) or S6 and PS (p = 0.654).
Therefore, exposure to cigarette smoke generated alterations in the respiratory mechanics with a reduction in Gtis and Htis from the 3rd month and with progressive and dependent effects over time. In addition, the expected improvement in the PS group associated with a 3-month break from exposure to cigarette smoke was not evident.
Alveolar enlargement
The assessment of the distal lung parenchyma by calculating the mean linear intercept (Lm) in the smoking and control groups at 1 (C1 and S1), 3 (C3 and S3) and 6 months (C6, S6 and PS) of follow-up is shown in .
Figure 7. Histological assessment of the mean linear intercept (Lm). Statistical analyses were performed with double factor analysis of variance test (ANOVA) in A, B and C; and one-way ANOVA test in D. The data are shown as mean and standard deviation (Control: 1 mo, n = 10; 3 mo, n = 10; 6 mo, n = 7. Smoke: 1 mo, n = 9; 3 mo, n = 8; 6 mo, n = 10. PS: n = 4). PS: provisional smoke. mo: month. *Statistically significant difference present in the Bonferroni post-test.
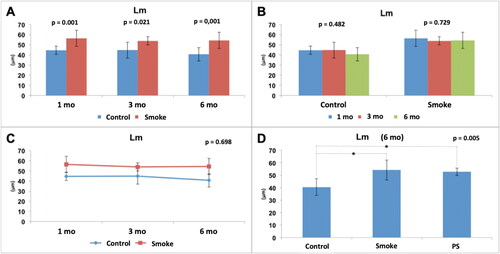
We found a significant increase in Lm in the groups exposed to cigarette smoke compared to the control groups at all studied times () [C1 × S1 (p = 0.001), C3 × S3 (p = 0.021), C6 × S6 (p = 0.001)]. There was no significant difference among the control groups over time () [C1 × C3 × C6 (p = 0.482)]. Moreover, there was no significant difference among the groups with exposure to cigarette smoke over time () [S1 × S3 × S6 (p = 0.729)]. The results also showed that for this parameter (Lm), control and smoking are independent of time (p = 0.698) (). After addition of the PS group in the analysis of the 6-month groups (), there was a significant difference among the groups (p = 0.005), and the Bonferroni post-test for multiple comparisons showed that a difference occurred between C6 and S6 (p = 0.006) and C6 and PS (p = 0.042) but not between S6 and PS (p > 0.999), indicating that the 3-month pause of exposure to cigarette smoke that occurred in the PS group did not result in any improvement in the analyzed parameter (Lm) compared to that of the S6 group.
Therefore, exposure to cigarette smoke caused alterations in the lung parenchyma from the 1st month; however, there was no evidence of a progressive effect over the months. In addition, the expected improvement in the PS group associated with a 3-month break from exposure to cigarette smoke was not evident.
Abnormal microscopic features of type I collagen in early stages of COPD
Immunofluorescence staining for type I collagen () shows a uniform labeling pattern for collagen, identified by the intense bright green fluorescence in the trabecular bone of C1 group, in contrast to a marked decrease of fluorescence in the S1 group (). Likewise, the histological pattern and reduction immunostaining was found in the C3 and S3 groups ().
Figure 8. Immunofluorescence staining for type I collagen shows a uniform labeling pattern for collagen identified by the intense bright green fluorescence in the trabecular bone (arrows) of control groups with a slight decrease in 6 months compared with 1 and 3 months (A, C and E) and a marked decrease of fluorescence in smoke groups (B, D and F). mo: month.
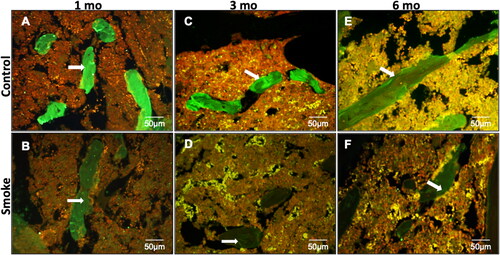
In we identified a slight decrease in the expression of collagen in C6 group when compared with C1 and C3 groups. However, the decrease in the expression of type I collagen in the S6 group was more evident when compared with the C6 group.
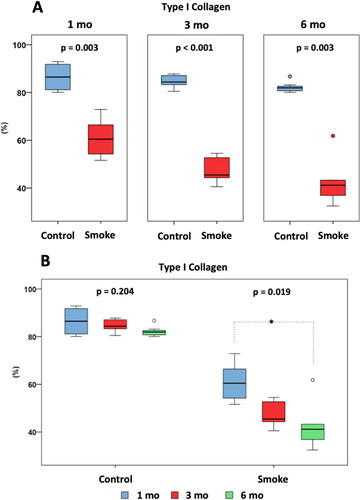
Our histomorphometric results confirm our morphological findings and show a reduction in type I collagen in the groups exposed to cigarette smoke compared to the control groups at all times of follow-up () [C1 × S1 (p = 0.003), C3 × S3 (p < 0.001), C6 × S6 (p = 0.003)]. There was no significant difference among the control groups over time () [C1 × C3 × C6 (p = 0.204)]. However, there was a significant reduction among the groups with exposure to cigarette smoke over time () [S1 × S3 × S6 (p = 0.019)], and Dunn's post-test for multiple comparisons showed that a difference was detected between S1 and S6 (p = 0.023) but not between S1 and S3 (p = 0.123) or S3 and S6 (p > 0.999).
Figure 9. Immunohistochemical assessment of type I collagen fibers. Statistical analyses were performed with Mann-Whitney test in A and Kruskal-Wallis test in B. Results are presented as an average percentage of type I collagen in relation to the total area of the trabeculae. The data are shown as median and interquartile range IQ (25 - 75%). (Control: 1 mo, n = 10; 3 mo, n = 10; 6 mo, n = 7. Smoke: 1 mo, n = 9; 3 mo, n = 8; 6 mo, n = 10). mo: month. *Statistically significant difference present in the Dunn post-test.
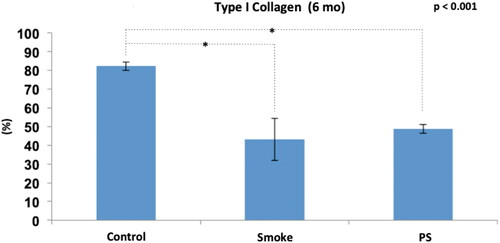
After addition of the PS group in the analysis of the 6-month groups (), there was a significant difference between the groups (p < 0.001), and the Bonferroni post-test for multiple comparisons showed that a difference occurred between C6 and S6 (p < 0.001) and C6 and PS (p < 0.001) but not between S6 and PS (p = 0.668).
Figure 10. Immunohistochemical assessment of type I collagen fibers among the groups at 6 months of follow-up (C6, S6 and PS). Statistical analyses were performed with one-way ANOVA test. Results are presented as an average percentage of type I collagen in relation to the total area of the trabeculae. The data are shown as mean and standard deviation (Control: 6 mo, n = 7. Smoke: 6 mo, n = 10. PS: n = 4). PS: provisional smoke. mo: month. *Statistically significant difference present in the Bonferroni post-test.
Therefore, exposure to cigarette smoke generated alterations in the composition of the bone fibrillar matrix from the 1st month with a progressive effect over time regarding the reduction of type I collagen. In addition, the expected improvement in the PS group associated with a 3-month break from exposure to cigarette smoke was not evident.
COL1A1 gene expression analysis
The assessment of COL1A1 gene expression in the smoking and control groups at 1 (C1 and S1), 3 (C3 and S3) and 6 months (C6, S6 and PS) of follow-up is shown in and .
Figure 11. Assessment of COL1A1 gene expression. Statistical analyses were performed with Mann-Whitney test in A and Kruskal-Wallis test in B. The data are shown as median and interquartile range IQ (25 - 75%). (Control: 1 mo, n = 10; 3 mo, n = 10; 6 mo, n = 7. Smoke: 1 mo, n = 9; 3 mo, n = 8; 6 mo, n = 10). mo: month. a.u.: arbitrary unit.
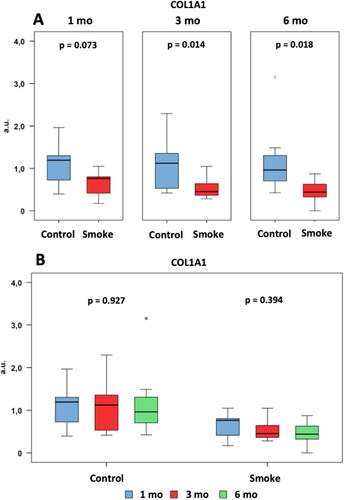
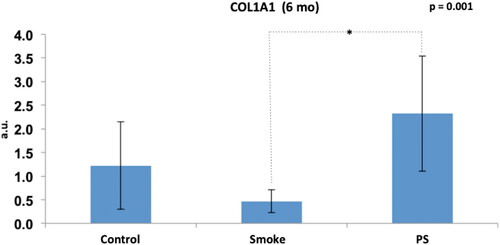
Figure 12. Assessment of COL1A1 gene expression among the groups at 6 months of follow-up (C6, S6 and PS). Statistical analyses were performed with one-way ANOVA test. The data are shown as mean and standard deviation (Control: 6 mo, n = 7. Smoke: 6 mo, n = 10. PS: n = 4). PS: provisional smoke. mo: month. a.u.: arbitrary unit. *Statistically significant difference present in the Bonferroni post-test.
We observed a reduction in the gene expression levels in the groups exposed to cigarette smoke compared to the control groups at 3 and 6 months of follow-up () [C1 × S1 (p = 0.073), C3 × S3 (p = 0.014), C6 × S6 (p = 0.018)]. There was no significant difference among the control groups over time () [C1 × C3 × C6 (p = 0.927)]. There was also no significant difference among the groups with exposure to cigarette smoke over time () [S1 × S3 × S6 (p = 0.394)].
After addition of the PS group in the analysis of the 6-month groups (), there was a significant difference among the groups (p = 0.001), and the Bonferroni post-test for multiple comparisons showed that a difference occurred only for S6 × PS (p = 0.001).
Therefore, exposure to cigarette smoke generated a reduction in the gene expression of COL1A1 from the 3rd month. In addition, the expected improvement in the PS group associated with a 3-month break from exposure to cigarette smoke was shown by the increased gene expression, but no improvement in the type 1 collagen deposition was shown by immunohistochemistry.
Discussion
Early in the development of COPD, we observed a worsening in functional and structural lung parameters with concomitant changes in the composition of the bone collagen matrix characterized by a reduction of type I collagen that remained until the end of the protocol.
Although the destruction of the lung parenchyma was identified from the 1st month through the increase in Lm, the reductions in resistance (Gtis) and elastance (Htis) were confirmed only after the 3rd month. [Citation34]. In animal models, the structural changes generally occur earlier than the functional changes [Citation35]. These differences occur due to initial tissue edema and technical difficulties in assessing respiratory mechanics in small animals. Functional changes were detected only with greater structural damage [Citation27,Citation35].
The structural and functional changes in the lung, characterizing COPD development, were maintained throughout the protocol, and the functional parameters progressively worsened over time. There was no improvement in those parameters in the group in which exposure to cigarette smoke was interrupted for 3 months (PS group). However, smoking cessation does not always ameliorate chronic lung conditions. De Cunto et al. (2018) [Citation36] demonstrated that even after 6 months of smoking cessation, C57Bl6 mice still showed persistent inflammation, progressive parenchymal deterioration as well as airway remodeling. This situation is characterized by a persistent activation of NFkB and a significant up-regulation of proinflammatory cytokines and chemokines gene expression (i.e. IL-6, IL-8, KC and MIP-1).
Once the effectiveness of the experimental model for inducing COPD was demonstrated, we performed the bone tissue analysis. Although fragility of bone tissue in smoking patients has been a recurrent theme in the literature due to loss of bone mass [Citation37], increased risk of fractures [Citation38,Citation39], increased risk of nonconsolidation or delayed fracture consolidation [Citation16,Citation18,Citation40], the physiological mechanisms involved in this process are poorly understood. Smoking generates a systemic inflammatory process characterized by a marked increase in cytokines expression, such as TNF-alpha and IL-17 induced MCP-1, leading the osteoclast differentiation [Citation41]. The dynamic regulation of osteoclastogenic and anti-osteoclastogenic cytokines is important in maintaining the balance between bone-resorbing osteoclasts and bone-forming osteoblasts, which eventually affects bone integrity [Citation42].
Recently, Sasaki et al. (2018) [Citation19] showed deterioration of bone tissue in mice exposed to cigarette smoke (more than 20 weeks of exposure) with the disorganization of total collagen fibers and misalignment of apatite crystals. In our study, we verified a progressive reduction in the proportion of type I collagen over time from the 1st month, as well as in the gene expression of COL1A1.
These results corroborate with previous experimental and clinical findings. Rothem et al. (2009) [Citation43] in human osteoblastic cell culture (MG63) showed that nicotine at high concentrations has toxic, antiproliferative and negative regulatory effects on type I collagen gene expression. Likewise, Theiss et al. (2000) [Citation44], using an experimental model of vertebral fusion, showed a reduction in the gene expression of type I collagen in the bone callus of rabbits exposed to a nicotine solution in a 4-week follow-up. Diniz-Fernandes et al. (2018) [Citation45] studied patients diagnosed with posterior tibial tendinopathy and showed a decrease in the deposition of type I collagen in the tendon that was associated with a reduction in the mechanical resistance of the tissue.
Smoking has been described by their cytotoxic effects in fibroblasts and osteoblasts, worsening these cells activity and the collagen production [Citation16] as we observed in animals that were exposed to cigarette smoke that showed reduction in type I collagen as well as in expression of COL1A1. Evidence from in vitro studies showed that higher levels of nicotine, main compound of cigarette smoke, induces worsening in osteoblasts function with consequent decreased proliferation and impaired collagen synthesis [Citation46–48]. In this context, the interruption of smoking habit before the elective surgeries have been used to diminish the time required for bone healing as well the complications after surgery [Citation49–51] and, after smoking cessation, lower levels of nicotine is detected in serum and urine of these patients [Citation52].
In our study, the effect of smoking cessation on bone tissue turnover was studied through the provisional smoke (PS) group, in which the mice had a 3-month break in cigarette smoke exposure. Although, we did not observe bone structural improvements related to a 3-month exposure pause, we have already detected an important increase in COL1A1 gene expression, suggesting initial events in order to increase type I collagen deposition. Most likely, a longer follow-up PS group would identify a structural improvement.
In the humans, after smoking cessation, there is a rapid decline in nicotine and CO levels; in 1 week, the majority of nicotine metabolites are eliminated, and in 2 months, viscosity and blood flow improve in the limbs [Citation38,Citation53], however the improvement in the bone mineral density in postmenopausal women was observed only 1 year after smoking cessation [Citation54].
In our study, we did not observe pulmonary or bone structural improvements related to a 3-month exposure pause, but we did detect an important increase in COL1A1 gene expression in the PS group related to cessation of exposure. Most likely, a longer follow-up in this group would identify a structural improvement that was preceded by the change in gene expression, which we could detect earlier.
To our knowledge, no previous study has focused on the long-term temporal effects of cigarette smoke on structural changes of the bone matrix. This study will contribute to a better understanding of the extrapulmonary manifestations of COPD as well as to improve the clinical management in bone diseases that are worsened by smoking habit.
Conclusion
We showed that a worsening in bone collagen matrix is part of the initial physiopathological events during COPD development and the smoking cessation induced an evident recovery of COL1A1 expression, possibly to attempt at tissue repair.
Disclosure statement
The authors report no conflicts of interest.
References
- World Health Organization . WHO report on the global tobacco epidemic 2013. Enforcing bans on tobacco advertising, promotion and sponsorship [Internet]. 2013. http://www.who.int/tobacco/global_report/2013/en/.
- Talhout R , Schulz T , Florek E , et al. Hazardous compounds in tobacco smoke. Int J Environ Res Public Health. 2011;8(2):613–628. DOI:10.3390/ijerph8020613
- Ezzati M , Lopez AD . Estimates of global mortality attributable to smoking in 2000. Lancet. 2003;362(9387):847–852. DOI:10.1016/S0140-6736(03)14338-3
- Hecht SS . Cigarette smoking: cancer risks, carcinogens, and mechanisms. Langenbecks Arch Surg. 2006;391(6):603–613. DOI:10.1007/s00423-006-0111-z
- Breitling LP . Current genetics and epigenetics of smoking/tobacco-related cardiovascular disease. Arterioscler Thromb Vasc Biol. 2013;33(7):1468–1472. DOI:10.1161/ATVBAHA.112.300157
- Forey BA , Thornton AJ , Lee PN . Systematic review with meta-analysis of the epidemiological evidence relating smoking to COPD, chronic bronchitis and emphysema. BMC Pulm Med. 2011;11:36. DOI:10.1186/1471-2466-11-36
- Global Initiative for Chronic Obstructive Lung Disease (GOLD). Global Strategy for The Diagnosis, Management, and Prevention of Chronic Obstructive Pulmonary Disease [Internet]. 2019. https://goldcopd.org/gold-reports/.
- Inoue D , Watanabe R , Okazaki R . COPD and osteoporosis: links, risks, and treatment challenges. Int J Chron Obstruct Pulmon Dis. 2016;11:637–648. DOI:10.2147/COPD.S79638
- Llinàs L , Peinado VI , Ramon Goñi J , et al. Similar gene expression profiles in smokers and patients with moderate COPD. Pulm Pharmacol Ther. 2011;24(1):32–41. DOI:10.1016/j.pupt.2010.10.010
- Vrieze A , de Greef MHG , Wijkstra PJ , et al. Low bone mineral density in COPD patients related to worse lung function, low weight and decreased fat-free mass. Osteoporos Int. 2007;18(9):1197–1202. DOI:10.1007/s00198-007-0355-7
- Xiaomei W , Hang X , Lingling L , et al. Bone metabolism status and associated risk factors in elderly patients with chronic obstructive pulmonary disease (COPD). Cell Biochem Biophys. 2014;70(1):129–134. DOI:10.1007/s12013-014-9868-9
- Daniell HW . Osteoporosis of the Slender smoker. Vertebral compression fractures and loss of metacarpal cortex in relation to postmenopausal cigarette smoking and lack of obesity. Arch Intern Med. 1976;136(3):298–304. DOI:10.1001/archinte.136.3.298
- Henemyre CL , Scales DK , Hokett SD , et al. Nicotine stimulates osteoclast resorption in a porcine marrow cell model. J Periodontol. 2003;74(10):1440–1446. DOI:10.1902/jop.2003.74.10.144
- de Vernejoul MC , Bielakoff J , Herve M , et al. Evidence for defective osteoblastic function. A role for alcohol and tobacco consumption in osteoporosis in middle-aged men. Clin Orthop Relat Res. 1983;179:107–115. DOI:10.1097/00003086-198310000-00016
- Kamer AR , El-Ghorab N , Marzec N , et al. Nicotine induced proliferation and cytokine release in osteoblastic cells. Int J Mol Med. 2006;17(1):121–127. DOI:10.3892/ijmm.17.1.121
- Barbosa AP , Lourenço JD , Junqueira JJM , et al. The deleterious effects of smoking in bone mineralization and fibrillar matrix composition. Life Sci. 2020;241:117132. DOI:10.1016/j.lfs.2019.117132
- Chen F , Osterman AL , Mahony K . Smoking and bony union after ulna-shortening osteotomy. Am J Orthop. 2001;30(6):486–489.
- Little CP , Burston BJ , Hopkinson-Woolley J , et al. Failure of surgery for scaphoid non-union is associated with smoking. J Hand Surg Br. 2006;31(3):252–255. DOI:10.1016/j.jhsb.2005.12.010
- Sasaki M , Chubachi S , Kameyama N , et al. Effects of long-term cigarette smoke exposure on bone metabolism, structure, and quality in a mouse model of emphysema. PLoS One. 2018;13(1):e0191611. DOI:10.1371/journal.pone.0191611
- Tsukamoto M , Mori T , Wang KY , et al. Systemic bone loss, impaired osteogenic activity and type I muscle fiber atrophy in mice with elastase-induced pulmonary emphysema: Establishment of a COPD-related osteoporosis mouse model. Bone. 2019; 120:114–124. DOI:10.1016/j.bone.2018.10.017
- Exposito J-Y , Valcourt U , Cluzel C , et al. The fibrillar collagen family. IJMS. 2010;11(2):407–426. DOI:10.3390/ijms11020407
- Feng X . Chemical and biochemical basis of cell-bone matrix interaction in health and disease. Curr Chem Biol. 2009;3(2):189–196. DOI:10.2174/187231309788166398
- Gelse K , Pöschl E , Aigner T . Collagens-structure, function, and biosynthesis. Adv Drug Deliv Rev. 2003;55(12):1531–1546. DOI:10.1016/j.addr.2003.08.002
- Committee for the Update of the Guide for the Care and Use of Laboratory Animals. Guide For The Care And Use Of Laboratory Animals. 8th ed. 500 Fifth Street, NW, Lockbox 285, Washington, DC: Tha National Academies Press; 2011.
- Toledo AC , Magalhaes RM , Hizume DC , et al. Aerobic exercise attenuates pulmonary injury induced by exposure to cigarette smoke. Eur Respir J. 2012;39(2):254–264. DOI:10.1183/09031936.00003411
- Hantos Z , Daróczy B , Suki B , et al. Input impedance and peripheral inhomogeneity of dog lungs. J Appl Physiol. 1992;72(1):168–178. DOI:10.1152/jappl.1992.72.1.168
- Ito JT , Cervilha DAB , Lourenço JD , et al. Th17/Treg imbalance in COPD progression: a temporal analysis using a CS-induced model. PLoS One. 2019;14(1):e0209351. DOI:10.1371/journal.pone.0209351
- Gomes RF , Shen X , Ramchandani R , et al. Comparative respiratory system mechanics in rodents. J Appl Physiol. 2000; Sep89(3):908–916. DOI:10.1152/jappl.2000.89.3.908
- Lopes F , Toledo AC , Olivo CR , et al. A comparative study of extracellular matrix remodeling in two murine models of emphysema. Histol Histopathol. 2013;28(2):269–276. DOI:10.14670/HH-28.269
- Takubo Y , Guerassimov A , Ghezzo H , et al. Alpha1-antitrypsin determines the pattern of emphysema and function in tobacco smoke-exposed mice: parallels with human disease. Am J Respir Crit Care Med. 2002;166(12):1596–1603. DOI:10.1164/rccm.2202001
- Hsia CC , Hyde DM , Ochs M , et al. An official research policy statement of the American Thoracic Society/European Respiratory Society: standards for quantitative assessment of lung structure. Am J Respir Crit Care Med. 2010;181(4):394–418. DOI:10.1164/rccm.200809-1522ST
- Teodoro WR , Velosa AP , Witzel SS , et al. Architectural remodelling in lungs of rabbits induced by type V collagen immunization: a preliminary morphologic model to study diffuse connective tissue diseases. Pathol Res Pract. 2004;200(10):681–691. DOI:10.1016/j.prp.2004.05.007
- Livak KJ , Schmittgen TD . Analysis of relative gene expression data using real-time quantitative PCR and the 2(-Delta Delta C(T)) Method. Methods. 2001;25(4):402–408. DOI:10.1006/meth.2001.1262
- Toumpanakis D , Kastis GA , Zacharatos P , et al. Inspiratory resistive breathing induces acute lung injury. Am J Respir Crit Care Med. 2010;182(9):1129–1136. DOI:10.1164/rccm.201001-0116OC
- Anciães AM , Olivo CR , Prado CM , et al. Respiratory mechanics do not always mirror pulmonary histological changes in emphysema. Clinics (Sao Paulo)). 2011;66(10):1797–1803. DOI:10.1590/s1807-59322011001000020
- De Cunto G , Bartalesi B , Cavarra E , et al. Ongoing lung inflammation and disease progression in mice after smoking cessation: beneficial effects of formyl-peptide receptor blockade. Am J Pathol. 2018;188(10):2195–2206. DOI:10.1016/j.ajpath.2018.06.010
- Szulc P , Garnero P , Claustrat B , et al. Increased bone resorption in moderate smokers with low body weight: the Minos study. J Clin Endocrinol Metab. 2002;87(2):666–674. DOI:10.1210/jcem.87.2.8232
- Hernigou J , Schuind F . Tobacco and bone fractures: A review of the facts and issues that every orthopaedic surgeon should know. Bone Joint Res. 2019; Jul 58(6):255–265. DOI:10.1302/2046-3758.86.BJR-2018-0344.R1
- Kanis JA , Johnell O , Oden A , et al. Smoking and fracture risk: a meta-analysis. Osteoporos Int. 2005;16(2):155–162. DOI:10.1007/s00198-004-1640-3
- Hernigou J , Schuind F . Smoking as a predictor of negative outcome in diaphyseal fracture healing. Int Orthopaedics (Sicot)). 2013;37(5):883–887. DOI:10.1007/s00264-013-1809-5
- De Cunto G , Lunghi B , Bartalesi B , et al. Severe reduction in number and function of peripheral T cells does not afford protection toward emphysema and bronchial remodeling induced in mice by cigarette smoke. Am J Pathol. 2016;186(7):1814–1824. DOI:10.1016/j.ajpath.2016.03.002
- Amarasekara DS , Yun H , Kim S , et al. Regulation of osteoclast differentiation by cytokine networks. Immune Netw. 2018;18(1):e8. DOI:10.4110/in.2018.18.e8
- Rothem DE , Rothem L , Soudry M , et al. Nicotine modulates bone metabolism-associated gene expression in osteoblast cells. J Bone Miner Metab. 2009;27(5):555–561. DOI:10.1007/s00774-009-0075-5
- Theiss SM , Boden SD , Hair G , et al. The effect of nicotine on gene expression during spine fusion. Spine (Phila Pa 1976). 2000; Oct 1525(20):2588–2594. DOI:10.1097/00007632-200010150-00008
- Diniz-Fernandes T , Godoy-Santos AL , Santos MC , et al . Matrix metalloproteinase-1 (MMP-1) and (MMP-8) gene polymorphisms promote increase and remodeling of the collagen III and V in posterior tibial tendinopathy . Histol Histopathol. 2018;33(9):929–936. DOI:10.14670/HH-11-982
- Lenz LG , Ramp WK , Galvin RJ , et al. Inhibition of cell metabolism by a smokeless tobacco extract: tissue and species specificity. Proc Soc Exp Biol Med. 1992;199(2):211–217. DOI:10.3181/00379727-199-43349
- Ramp WK , Lenz LG , Galvin RJ . Nicotine inhibits collagen synthesis and alkaline phosphatase activity, but stimulates DNA synthesis in osteoblast-like cells. Proc Soc Exp Biol Med. 1991;197(1):36–43. DOI:10.3181/00379727-197-43221
- Fang MA , Frost PJ , Iida-Klein A , et al. Effects of nicotine on cellular function in UMR 106-01 osteoblast-like cells. Bone. 1991;12(4):283–286. DOI:10.1016/8756-3282(91)90077-V
- Wagner PD , Mathieu-Costello O , Bebout DE , et al. Protection against pulmonary O2 toxicity by N-acetylcysteine. Eur Respir J. 1989;2(2):116–126.
- Cotgreave IA . N-acetylcysteine: pharmacological considerations and experimental and clinical applications. Adv Pharmacol. 1997;38:205–227.
- Brown LA . Glutathione protects signal transduction in type II cells under oxidant stress. Am J Physiol. 1994;266(2 Pt 1):L172–L177. DOI:10.1152/ajplung.1994.266.2.L172
- Carlson BB , Burton DC , Jackson RS , et al. Recidivism rates after smoking cessation before spinal fusion. Orthopedics. 2016;39(2):e318–e322. DOI:10.3928/01477447-20160301-03
- No authors listed . International Agency for Research on Cancer. World Health Organization. Tobacco control: reversal of risk after quitting smoking. IARC handbooks of cancer prevention, 2007. [internet]. Avalilable: https://publications.iarc.fr/Book-And-Report-Series/Iarc-Handbooks-Of-Cancer-Prevention/Tobacco-Control-Reversal-Of-Risk-After-Quitting-Smoking-2007.
- Oncken C , Prestwood K , Kleppinger A , et al. Impact of smoking cessation on bone mineral density in postmenopausal women. J Womens Health (Larchmt)). 2006;15(10):1141–1150. DOI:10.1089/jwh.2006.15.1141