
Abstract
Chronic obstructive pulmonary disease (COPD) is a complex, multidimensional and heterogeneous disease. The main purpose of the present study was to identify clinical phenotypes through cluster analysis in adults suffering from COPD. A retrospective study was conducted on 178 COPD patients in stable state recruited from ambulatory care at University hospital of Liege. All patients were above 40 years, had a smoking history of more than 20 pack years, post bronchodilator FEV1/FVC <70% and denied any history of asthma before 40 years. In this study, the patients were described by a total of 84 mixed sets of variables with some missing values. Hierarchical clustering on principal components (HCPC) was applied on multiple imputation. In the final step, patients were classified into homogeneous distinct groups by consensus clustering. Three different clusters, which shared similar smoking history were found. Cluster 1 included men with moderate airway obstruction (n = 67) while cluster 2 comprised men who were exacerbation-prone, with severe airflow limitation and intense granulocytic airway and neutrophilic systemic inflammation (n = 56). Cluster 3 essentially included women with moderate airway obstruction (n = 55). All clusters had a low rate of bacterial colonization (5%), a low median FeNO value (<20 ppb) and a very low sensitization rate toward common aeroallergens (0-5%). CAT score did not differ between clusters. Including markers of systemic airway inflammation and atopy and applying a comprehensive cluster analysis we provide here evidence for 3 clusters markedly shaped by sex, airway obstruction and neutrophilic inflammation but not by symptoms and T2 biomarkers.
Introduction
Chronic obstructive pulmonary disease (COPD) is a complex and heterogeneous disease with a large number of subtypes and a multifactorial background [Citation1, Citation2]. It may be caused by different pathophysiologic mechanisms (sometimes referred to as endotypes) but may share similar observed characteristics (phenotypes) [Citation3]. These phenotypes divide all patients into several groups with common features that help patients to receive effective care and achieve better clinical results.
Within the data mining framework one of the most recognized methods for discovering knowledge in multivariate dataset, is clustering. Cluster analysis attempt to find groups of patients such that patients in the same cluster are more similar to each other than to patients in another cluster [Citation4]. In recent years, cluster analysis was applied as a popular method to examine heterogeneity of patients with asthma [Citation5, Citation6] or COPD [Citation7–12]. Within the clustering framework, missing values, which are present in such large datasets, and how to handle it have not been referred among different studies [Citation13]. As different analysis methods exist with their own criterion for clustering and determination of the number of clusters, hierarchical and nonhierarchical, different results are proposed. Another key point is number of variables in clustering, how select them and this fact that correlation exists between initially selected variables, the strategies of data transformation using principal component analysis solved this point [Citation9, Citation10, Citation14–17].
In this paper, we introduce a flexible framework for cluster analysis on multidimensional dataset, which handles missing value by multiple imputation. COPD clustering studies have brought insight to the importance of co-morbidities and systemic inflammation as components accounting for disease variability [Citation18]. There are studies that used demographic variables, symptoms, spirometry, imaging and comorbidities to build the clusters [Citation19]. However, there are not many studies using clustering that investigated the airway inflammatory component and the atopic status in large cohort of COPD. As it is recognized that some COPD may express T2 biomarkers [Citation20], we included serum IgE and FeNO in our standard routine investigation of COPD in order to see whether the T2 trait is frequent and strong enough to shape a cluster in a population of COPD denying any existence of asthma before the age of 40 years.
Here we performed clustering analysis on a cohort of 178 COPD patients recruited from ambulatory care in whom detailed lung function, blood and sputum analysis were available.
Material and methods
The retrospective study was conducted on 178 stable COPD patients recruited from ambulatory care in our COPD clinic in the Pneumology Department of the University hospital of Liege. We have a general agreement from the ethics committee to use clinical data collected from routine practice to make retrospective reports. The protocol was approved by the Hospitalo-Facultaire Universitaire ethics committee, Liege (institutional review board 2005/181). Every patient attending ambulatory clinic care signs an informed consent stating that they accept this principle. Selection criteria to be referred to our COPD clinic were symptomatic patients (including at least one of the three following symptoms: dyspnea, cough and sputum production) with FEV1/FVC ratio post bronchodilation less than 70%, age above 40 years and smoking history of at least 20 pack years. None had an asthma history starting before the age of 40. At the COPD clinic the patients had systematic pre and post bronchodilation spirometry, sputum induction, blood sampling, and completed the self-administered CAT questionnaire. From the clinical data, a comprehensive list of 84 variables was derived and divided into six categories, i.e. demographics, pulmonary function tests, treatment features, blood cell counts and systemic inflammatory markers, atopic status, and sputum cell counts and microbiology. One unavoidable problem in huge dataset is the presence of missing value. The percentage of missing values ranged from 0% to 23% and 75% of patients presented at least one missing value. This matter creates serious problems as most of the classical statistical methods are not designed to handle incomplete data. By default, in statistical methods and software, patients with at least one missing value are discarded from the analysis. In practical research, multiple imputation is a popular and very flexible technique for handling missing value [Citation21]. Multiple imputation replaces each missing value with a set of m (>1) plausible values. Therefore, instead of one incomplete dataset, multiple imputation provides m separate complete datasets [22]. In the present study, m was fixed to 100. Then, 100 imputed datasets are analyzed by the method that would have been appropriate if the data had been complete. The derived results from the analyses are then combined to produce the final quantity of interest following Rubin’s rules [Citation23]. The number of variables is an important issue in cluster analysis specially in determining the number of clusters. Indeed, large number of variables result in poor discrimination distance and misspecification classification. Therefore, in this study with huge numbers of variables, the percentage of contribution of variables was determined, and then, the strategy of variable reduction was applied. Cluster analysis is a powerful but unsupervised method. The big issue in this unsupervised method is, to evaluate the quality of the clustering framework for classification. Clustering validation was considered to evaluate this issue. Statistical methodology is discussed in the online supplement in more detail.
Statistical method
Quantitative variables were summarized using median and interquartile range (P25 - P75); while count and percentage were used for qualitative variables. Outlines of the proposed steps to assign clustering for patients are described in . Missing values were imputed by draw from the posterior predictive distribution of bayesian model and predictive mean matching (PMM) was used as a robust method to model misspecification in imputing values. Since this study contains quantitative and qualitative variables, factor analysis for mixed data (FAMD) was applied for creating new components. In cluster analysis step, the number of clusters for each imputed dataset was determined by hierarchical clustering and a package of 30 indices for determining the relevant number of clusters, then K-means was applied for assigning clusters to patients. In consensus step, final clustering result was achieved by minimizing the sum of squared distance of existing clustering results. For each clustering output, two indices for internal clustering validation and stability validation were calculated. Output of consensus clustering was considered as the individual final clustering result for raw and all of imputed datasets. Then, median and interquartile range were calculated for all variables in raw dataset and for each imputed dataset. Finally, an overall median with corresponding interquartile range was calculated over all 100 imputed datasets. All variables were compared between the derived clusters using Kruskal-Wallis and Chi-squared tests for quantitative and qualitative variables, respectively. Comparison among clusters was applied according to Dunn’s multiple comparison test. Finally, the difference between three groups was displayed by boxplot. All analyses were performed using R statistical software. P values <0.05 were considered as statistically significant.
Table 1. Process of factor analysis and cluster analysis to describe phenotypes in COPD.
Results
Characteristics of the total patients and percentage of missing values before imputing are presented in . Patients were mostly males (54.49%) with age ranging from 40 to 84 years and displayed a normal weight (median body mass index was 23.62). Patients had a consistent tobacco consumption history with a median pack/year of 37.
Table 2. Characteristics of the COPD cohort.
Table 3. Percentage of the contribution of variables in clustering.
shows the order and the impact of each variable on clustering. The highest contribution for variables in clustering is for FEV1 (mL), FEV1 PD (mL), FEV1 PD predicted (%), FEV1 predicted (%) and FVC (mL) (Figure 1). Based on all operational processes indicated in , three distinct clusters with acceptable values for validation were identified weighing similarly regarding the number of patients from this procedure for COPD dataset and output for 100 imputed datasets displayed in . In this study, two indices for internal clustering validation and two indices for clustering stability validation are reported. Silhouette Width and Dunn Index values for Internal measures are 0.61 and 0.54, respectively. Average Proportion of Non-overlap and Average Distance between Means for Stability measures are 0.02 and 0.01, respectively (For more information, refer to supplementary, clustering validation). There were striking sex differences between the clusters with a clear dominance of male in clusters 1 and 2 while cluster 3 was essentially composed of women. Smoking history was similar between clusters and BMI was slightly higher in cluster 1 while still remaining in the normal range. Clusters 2 and 3 received more often courses of OCS the year prior to the visit whereas there was no difference regarding the number of antibiotic course. Clusters 2 and 3 were those in which patients received more maintenance treatment including ICS, LAMA, LABA and also used more often SABA as reliever. Cluster 2 and 3 had also more impaired lung function with more severe airway obstruction, lung hyperdistension and severely reduced diffusing capacity and transfer coefficient (). As far as inflammation is concerned, the cluster 2 had more severe systemic and airway neutrophilic inflammation, with slightly raised fibrinogen but not CRP. Circulating lymphocytes were reduced in cluster 2 ( and ). Absolute sputum eosinophil counts were higher in cluster 2 than in cluster 1 while no difference was seen in blood (). FeNO levels were similar between clusters and no difference was seen regarding total serum IgE () nor sensitizations to aeroallergens, which were rare in all three clusters. Interestingly, CAT score did not differ between the three clusters despite clear differences in lung function impairment ().
Figure 1. Percentage of the contribution of variables in clustering.
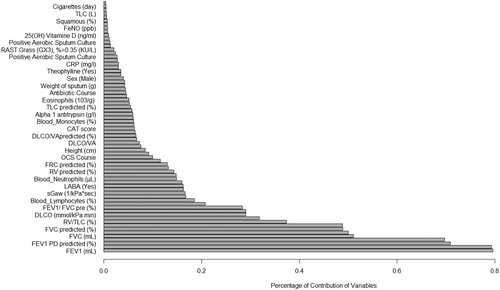
Figure 2. Lung function in three clusters.
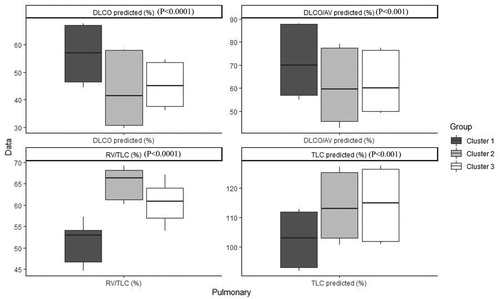
Figure 3. Blood in three clusters.
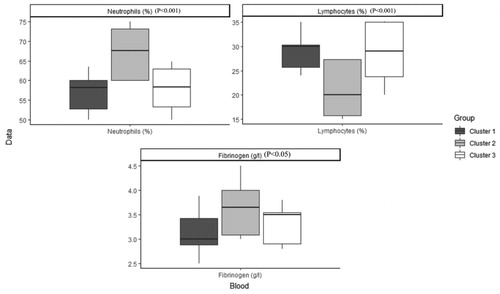
Figure 4. Sputum in three clusters.
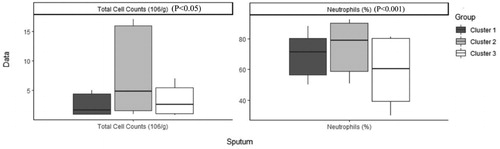
Figure 5. T2 biomarkers in three clusters.
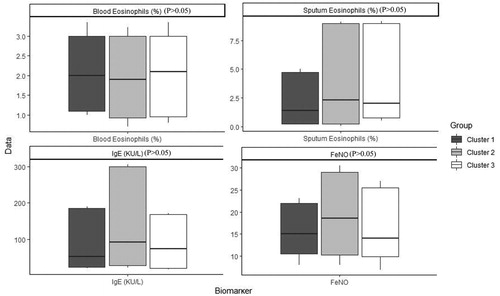
Figure 6. Cat Score in three clusters.
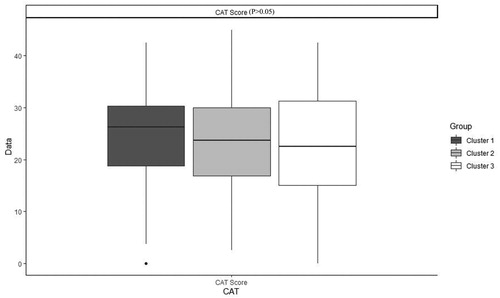
Table 4. Characteristics of patients with COPD after imputation, Median (IQR) / Percentage (frequency) in each cluster and comparison between clusters.
Table 5. Characteristics of patients with COPD before imputation, Median (IQR) / Percentage (frequency) in each cluster and comparison between clusters.
Discussion
In this study, we characterized COPD patients into three distinctly different groups by applying general and flexible statistical computation in dataset with missing values. In the present study, clustering was applied to a large number of variables instead of selecting a limited number of variables. Although missing values are a common and pervasive problem in diverse datasets such as COPD with large number of variables, missing values have not been considered property in the clustering literature. Based on these restrictions, classification on COPD datasets has not been comprehensively investigated. Therefore, in this exhaustive study, phenotypes in COPD dataset were described by imputing missing values, principal components and cluster analysis with many analytical decisions, which overcome limitations, often reported in previous clustering studies.
The concept of treatable trait has become very popular over the last years and it has been suggested to avoid label of asthma or COPD among patients with severe chronic airway diseases [Citation24]. Adopting this taxonomic view our COPD population could be seen as a population featuring the trait of fixed airway obstruction after a significant smoking history and denying any previous diagnosis of asthma before the age of 40. One strength of our study, compared to previous clustering analysis in COPD, is that it included airway inflammatory features, FeNO and atopic status in the parameters subjected to analysis.
We actually found 3 clusters of COPD, strikingly linked to sex with two clusters showing male dominance while the third was essentially a female cluster. There were clear differences between lung function impairment between the clusters whereas quantitative smoking history was quite similar, pointing to different susceptibility to tobacco among patients. The percentage of contribution of the different variables to the clustering. It appears that functional criteria including airway flow and the degree of airway obstruction and lung hyperdistension and the % of blood lymphocytes are amongst the most important criteria to structure the cluster while variables like smoking history, FeNO and Vitamin D level were rather homogeneous between the subjects.
The cluster 2 is conspicuously the most severe group of patients with marked airway obstruction, lung hyperdistension capacity together with intense neutrophilic inflammation both at the systemic and the airway level, in keeping with the previously reported relationship between the severity of airway obstruction and the neutrophilic inflammation [Citation25]. Cluster 2 and 3 had also impaired diffusing capacity and transfer coefficient pointing to emphysema. Despite severe emphysema the level of α1- antitrypsin was higher in cluster 2, perhaps indicating a response of the body trying to counteract the lung destruction favored by the intense neutrophilic inflammation.
Associated with neutrophilic inflammation, cluster 2, displays a small rise in fibrinogen level even through the median value remained within the normal range and below the threshold of 5.1 g/l, shown to be predictive of an excess of mortality [Citation26]. Of note is the fact that the intensity in neutrophilic airway inflammation is not associated with bacterial colonization identified by classical bacterial culture, which was rather low come close to 10% for the whole cohort. Of course, it does not imply that microbiome may be profoundly disturbed in COPD and more sophisticated microbiological analyses might have revealed differences between the clusters. Altered microbiome may be the consequence of frequent antibiotic courses received by the patients as shown in our cohort since almost two third of the patients had received antibiotics for bronchitis the year prior the visit. It is worth noting that there was no difference between clusters in the number of antibiotic courses. As opposed to exacerbation defined by OCS course, exacerbation defined by antibiotic course was not related the severity of lung function impairment nor to the severity of airway inflammation.
We also looked at phosphocalcic metabolism and found, as expected in western Europe, reduced levels of 25 OH Vit D (< 30 ng/ml) in all clusters without any difference between the groups. While Calcium levels, a tightly regulated ion, were normal and similar between the three clusters, there were striking differences in the levels of phosphates, which were clearly lower in cluster 1 and 2. The literature about phosphate level in COPD is virtually absent and the clinical meaning of our finding remains obscure though there might be a sex effect as this demographic trait best differentiates cluster 1 and 2 from cluster 3.
Eosinophilic trait is a marker of response to corticoids in asthma but also in COPD. In our study, blood eosinophilic inflammation does not appear to be discriminant feature between the clusters but cluster 2 shows a greater absolute, but not relative, sputum eosinophil cell count. However, the three clusters had median value of sputum eosinophil counts greater than that we found in a healthy population [Citation27] and, actually, rather similar to what is found in large population of unselected asthmatics [Citation28]. Furthermore, the greater amount of eosinophils present in sputum of COPD was noted despite heavier treatment with ICS in this cluster, which points to some corticoresistance in this cluster.
Atopic status based on positive RAST toward aeroallergens was low in the three clusters but total serum IgE was measured at higher level than those usually found in a general population of this age, maybe pointing to a role of IgE mediated processes in the pathophysiology of the disease. It has also been suggested that smoking may stimulate IgE production [Citation29]. However, it is a production clearly directed toward something different from the classical aeroallergens encountered in asthma. The reason why atopic status is so low in COPD, clearly lower than in a general population, is likely to be related to the age of the COPD patients. Indeed, it was demonstrated in population studies that specific IgE levels decreased with age [Citation30] and we have shown in a large asthmatic population that the rate of sensitization to aeroallergens was sharply declining with age after 60 years [Citation31].
Of interest, and also perhaps surprising, is the fact the CAT score does not differ between the groups despite clear differences in lung function impairment and extent in airway inflammation. This shows that CAT score cannot capture the airflow limitation nor airway inflammation, indicating that symptoms, lung function and airway inflammation are different domains accounting for the disease variability [Citation32].
Our study has obviously limitations as we have not taken into account comorbidities, exercise capacity and lung imaging in our parameters, which are key variables in phenotyping the COPD patients in clinical practice. Our purpose here was rather to explore variables traditionally linked to asthma such FeNO, IgE and eosinophilic inflammation and to see whether they can play a significant contribution in defining the variability of the disease in patients > 40 years with smoking history and persistent airway obstruction. Our data indicate that FeNO, blood eosinophils and serum IgE, though being significantly different from what is found in a healthy population for total serum IgE, are not able to single out a particular cluster. Therefore, most of the T2 biomarkers had not enough variability among the patients to shape a cluster. However, eosinophilic (together with neutrophilic) airway inflammation is raised in the cluster that shows the most severe lung function impairment. These data may have importance as it has been shown by retrospective post hoc analysis that ICS treatment in eosinophilic COPD might actually slow down the lung function decline [Citation33]. The impact of targeting eosinophilic inflammation in COPD should be given careful consideration in long term clinical trials using not only ICS but also anti-interleukine-5.
Another important limitation of our study is the lack of a validation cohort whereas Castaldi et al have shown that reproducibility of COPD clustering across studies was rather modest. The size of our cohort was however too small to split our population and perform meaningful clustering with our extensive set of variables. However, we presented validation with two statistical indices.
In conclusion, in a cohort of COPD we found 3 clusters of patients with similar age and smoking history but very different sex distributions and lung function and inflammatory parameter. In particular, we identified a cluster of male patients with intense granulocytic airway inflammation combined with severe airway flow limitation and lung hyperdistention, who are prone to exacerbate and undergo recurrent hospitalizations. These clusters need to be confirmed in a new cohort of patients, ideally from other centers.
Disclosure of interest
The author reports no conflicts of interest in this work.
Supplemental Material
Download PDF (134.7 KB)Acknowledgment
The authors are grateful to the Federal Government Grant EOS (Excellence of science)30565447 for the support.
Correction Statement
This article has been republished with minor changes. These changes do not impact the academic content of the article.
References
- Rennard SI, Drummond MB. Early chronic obstructive pulmonary disease: definition, assessment, and prevention. Lancet Lond Engl. 2015;385(9979):1778–1788. DOI:10.1016/S0140-6736(15)60647-X
- Fabbri LM, Luppi F, Beghe B, et al. Complex chronic comorbidities of COPD. Eur Respir J. 2008;31(1):204–212. DOI:10.1183/09031936.00114307
- Deliu M, Sperrin M, Belgrave D, et al. Identification of asthma subtypes using clustering methodologies. Pulm Ther. 2016;2:19–41. DOI:10.1007/s41030-016-0017-z
- Johnson RA, Wichern DW. Applied multivariate statistical analysis: international edition. 6th ed. Pearson; ISBN-13 : 978-0135143506 Publisher: Pearson (4 May 2007)
- Haldar P, Pavord ID, Shaw DE, et al. Cluster analysis and clinical asthma phenotypes. Am J Respir Crit Care Med. 2008;178(3):218–224. DOI:10.1164/rccm.200711-1754OC
- Moore WC, Meyers DA, Wenzel SE, National Heart, Lung, and Blood Institute's Severe Asthma Research Program, et al. Identification of asthma phenotypes using cluster analysis in the severe asthma research program. Am J Respir Crit Care Med. 2010;181(4):315–323. DOI:10.1164/rccm.200906-0896OC
- Castaldi PJ, Benet M, Petersen H, et al. Do COPD subtypes really exist? COPD heterogeneity and clustering in 10 independent cohorts. Thorax. 2017;72(11):998–1006. DOI:10.1136/thoraxjnl-2016-209846
- Vanfleteren LEGW, Spruit MA, Groenen M, et al. Clusters of comorbidities based on validated objective measurements and systemic inflammation in patients with chronic obstructive pulmonary disease. Am J Respir Crit Care Med. 2013;187(7):728–735. DOI:10.1164/rccm.201209-1665OC
- Burgel P-R, Roche N, Paillasseur J-L, INITIATIVES BPCO Scientific Committee, et al. Clinical COPD phenotypes identified by cluster analysis: validation with mortality. Eur Respir J. 2012;40(2):495–496. DOI:10.1183/09031936.00228511
- Burgel P-R, Paillasseur J-L, Caillaud D, Initiatives BPCO Scientific Committee, et al. Clinical COPD phenotypes: a novel approach using principal component and cluster analyses. Eur Respir J. 2010;36(3):531–539. DOI:10.1183/09031936.00175109
- Garcia-Aymerich J, Gomez FP, Benet M, on behalf of the PAC-COPD Study Group, et al. Identification and prospective validation of clinically relevant chronic obstructive pulmonary disease (COPD) subtypes. Thorax. 2011;66(5):430–437. DOI:10.1136/thx.2010.154484
- Fens N, van Rossum AGJ, Zanen P, et al. Subphenotypes of mild-to-moderate COPD by factor and cluster analysis of pulmonary function, CT imaging and breathomics in a population-based survey. COPD J Chronic Obstr Pulm Dis. 2013;10(3):277–285. DOI:10.3109/15412555.2012.744388
- Basagaña X, Barrera-Gómez J, Benet M, et al. A framework for multiple imputation in cluster analysis. Am J Epidemiol. 2013;177(7):718–725. DOI:10.1093/aje/kws289
- Pistolesi M, Camiciottoli G, Paoletti M, et al. Identification of a predominant COPD phenotype in clinical practice. Respir Med. 2008;102(3):367–376. DOI:10.1016/j.rmed.2007.10.019
- Paoletti M, Camiciottoli G, Meoni E, et al. Explorative data analysis techniques and unsupervised clustering methods to support clinical assessment of Chronic Obstructive Pulmonary Disease (COPD) phenotypes. J Biomed Inform. 2009;42(6):1013–1021. DOI:10.1016/j.jbi.2009.05.008
- Burgel P-R, Nesme-Meyer P, Chanez P, et al. Cough and sputum production are associated with frequent exacerbations and hospitalizations in COPD subjects. Chest. 2009;135(4):975–982. DOI:10.1378/chest.08-2062
- Burgel P-R, Paillasseur J-L, Peene B, et al. Two distinct chronic obstructive pulmonary disease (COPD) phenotypes are associated with high risk of mortality. Sethi. S, ed. PLoS ONE. 2012;7(12):e51048. DOI:10.1371/journal.pone.0051048
- Burgel P-R, Paillasseur J-L, Janssens W, et al. A simple algorithm for the identification of clinical COPD phenotypes. Eur Respir J. 2017;50(5):1701034. DOI:10.1183/13993003.01034-2017
- Burgel P-R, Paillasseur J-L, Roche N. Identification of clinical phenotypes using cluster analyses in COPD patients with multiple comorbidities. BioMed Res Int. 2014;2014:420134–420139. DOI:10.1155/2014/420134
- Cataldo D, Corhay J-L, Derom E, et al. A Belgian survey on the diagnosis of asthma-COPD overlap syndrome. COPD. 2017;Volume 12:601–613. DOI:10.2147/COPD.S124459
- Molenberghs G, Kenward M. Missing data in clinical studies. John Wiley & Sons; ISBN:9780470849811 Publisher is: John Wiley & Sons: Chichester, 2007.
- Buuren S. v. Flexible imputation of missing data. CRC Press; ISBN-13: 978-1439868249 Publisher: Chapman and Hall/CRC; 1st Edition (March 29, 2012).
- Rubin DB. Multiple imputation for nonresponse in surveys. John Wiley & Sons; ISBN:0470317361, 9780470317365 Publisher: John Wiley & Sons, Inc. 2009.
- Agusti A, Pavord ID. Do we really need a new classification of airway diseases? Lancet Respir Med. 2018;6(12):891–893. DOI:10.1016/S2213-2600(18)30386-2
- Moermans C, Heinen V, Nguyen M, et al. Local and systemic cellular inflammation and cytokine release in chronic obstructive pulmonary disease. Cytokine. 2011;56(2):298–304. DOI:10.1016/j.cyto.2011.07.010
- Celli BR, Locantore N, Yates J, for the ECLIPSE Investigators, et al. Inflammatory biomarkers improve clinical prediction of mortality in chronic obstructive pulmonary disease. Am J Respir Crit Care Med. 2012;185(10):1065–1072. DOI:10.1164/rccm.201110-1792OC
- Demarche S, Schleich F, Henket M, et al. Detailed analysis of sputum and systemic inflammation in asthma phenotypes: are paucigranulocytic asthmatics really non-inflammatory? BMC Pulm Med. 2016;16(1):46. DOI:10.1186/s12890-016-0208-2
- Schleich FN, Chevremont A, Paulus V, et al. Importance of concomitant local and systemic eosinophilia in uncontrolled asthma. Eur Respir J. 2014;44(1):97–108. DOI:10.1183/09031936.00201813
- O'Connor GT, Sparrow D, Weiss ST. The role of allergy and nonspecific airway hyperresponsiveness in the pathogenesis of chronic obstructive pulmonary disease. Am Rev Respir Dis. 1989;140(1):225–252. DOI:10.1164/ajrccm/140.1.225
- Amaral AFS, Newson RB, Abramson MJ, et al. Changes in IgE sensitization and total IgE levels over 20 years of follow-up. J Allergy Clin Immunol. 2016;137(6):1788–1795.e9. DOI:10.1016/j.jaci.2015.09.037
- Manise M, Bakayoko B, Schleich F, et al. IgE mediated sensitisation to aeroallergens in an asthmatic cohort: relationship with inflammatory phenotypes and disease severity. Int J Clin Pract. 2016;70(7):596–605. DOI:10.1111/ijcp.12837
- Lapperre TS, Snoeck-Stroband JB, Gosman MME, Groningen and Leiden Universities Corticosteroids in Obstructive Lung Disease Study Group, et al. Dissociation of lung function and airway inflammation in chronic obstructive pulmonary disease. Am J Respir Crit Care Med. 2004;170(5):499–504. DOI:10.1164/rccm.200401-112OC
- Pavord ID, Lettis S, Locantore N, et al. Blood eosinophils and inhaled corticosteroid/long-acting β-2 agonist efficacy in COPD. Thorax. 2016;71(2):118–125. DOI:10.1136/thoraxjnl-2015-207021