
Abstract
Patients with advanced chronic obstructive pulmonary disease (COPD) develop skeletal muscle loss (sarcopenia) that is associated with adverse clinical outcomes including mortality. We evaluated if thoracic muscle area is associated with clinical outcomes in patients with severe COPD. We analyzed consecutive patients with severe COPD undergoing evaluation for lung volume reduction from 2015 to 2019 (n = 117) compared to current and former smoking controls undergoing lung cancer screening with normal lung function (n = 41). Quantitative assessments of pectoralis muscle (PM) and erector spinae muscle (ESM) cross sectional area (CSA) were related to clinical outcomes including composite endpoints. Our results showed a reduction in PM CSA but not ESM CSA was associated with the severity of GOLD stage of COPD. Current smokers demonstrated reduced PM CSA which was similar to that in COPD patients who were GOLD stages 3 and 4. PM CSA was associated positively with FEV1, FEV1% predicted, FVC, DLCO, and FEV1/FVC ratio, and was associated negatively with the degree of radiologic emphysema. ESM correlated positively with DLCO, RV/TLC (a marker of hyperinflation), and correlated negatively with radiologic severity of emphysema. Kaplan-Meier analysis showed that reductions in PM but not ESM CSA was associated with the composite end point of mortality, need for lung volume reduction, or lung transplant. In conclusion, in well-characterized patients with severe COPD referred for lung volume reduction, PM CSA correlated with severity of lung disease, mortality, and need for advanced therapies. In addition to predicting clinical outcomes, targeting sarcopenia is a potential therapeutic approach in patients with severe COPD.
Introduction
Chronic obstructive pulmonary disease (COPD) is the third most common cause of death globally [Citation1] and fourth most common cause in the United States [Citation2–4]. Patients with advanced COPD develop skeletal muscle loss or secondary sarcopenia [Citation5, Citation6], that is associated with adverse clinical outcomes including higher mortality, more frequent exacerbations and hospitalizations, increased healthcare cost and length of stay, and decreased quality of life [Citation7–11]. Body mass index (BMI) has been used to define sarcopenia but the components of BMI include bone, viscera, blood volume, extracellular fluid, and fat mass which reduce its reliability as a measure of muscle mass [Citation12]. Other measures including bioelectric impedance analysis or dual-energy x-ray absorptiometry to quantify both total and local skeletal muscle mass in COPD [Citation5, Citation13, Citation14] correlate with clinical outcomes more accurately than BMI [Citation13]. However, these instruments to quantify muscle mass are limited by logistics and lack of reproducibility [Citation15].
Measurement of the cross-sectional area (CSA) of skeletal muscles on single-slice axial abdominal computed tomography (CT) scans and more recently, chest CT scans is recognized to precisely and reproducibly quantify skeletal muscle mass [Citation16–18]. Even though cost and radiation exposure limit use of CT scans to diagnose and follow patients with sarcopenia, patients with COPD undergo routine lung cancer screening with chest CT scans. Screening for lung cancer in COPD improves mortality [Citation19] and is recommended by the United States Preventive Services (USPS) Taskforce [Citation20]. Quantifying muscle mass from these studies can therefore be used to assess prognosis of COPD patients.
Skeletal muscle area on abdominal CT scans has been widely used in patients with liver disease and cancers and is associated with clinical outcomes, [Citation21] however it has been used to a limited extent in other diseases [Citation22]. For instance, pectoralis muscle (PM) [Citation17, Citation23] and erector spinae muscle (ESM) [Citation16] CSA area correlate with lung function parameters [Citation17, Citation23] in COPD. Reductions in ESM antigravity muscles that maintain normal posture and atrophy has been seen in debilitated populations [Citation22] while PM is an accessory muscle of respiration. Both PM and ESM CSA can be measured on chest CT scans. However, there is limited published data on the use of CT scans to quantify muscle mass and its relevance in clinical outcomes in COPD patients. Previous studies are limited to a single sex [Citation16] and did not distinguish current and former smokers as the control population [Citation17]. Since active smoking causes muscle loss [Citation24–27], an optimal control population should include both current and former smokers. We determined if PM and ESM CSA were associated with lung function and clinical outcomes in patients with severe COPD.
Methods
Consecutive patients with severe COPD undergoing evaluation for advanced therapies (lung volume reduction surgery [LVRS] or endobronchial valve [EBV] placement) between the years 2015 and 2019 at the Cleveland Clinic COPD Center were included. Patients with other conditions that cause sarcopenia including chronic liver disease, end stage renal disease, and active cancer were excluded. As part of clinical evaluation for these procedures, patients undergo chest CT imaging, spirometry, full body plethysmography, a detailed clinical history, physical examination, and clinical questionnaires to assess COPD severity (including mMRC [Modified Medical Research Council] dyspnea scale, CAT [COPD Assessment Test] [Citation28], BODE [Body mass index, Obstruction, Dyspnea, Exercise] Index [Citation29], and Charlson comorbidity index [Citation30]). Lung function parameters that were documented were: FEV1% predicted (percentage of the predicted value), FEV1 (in liters), FVC % predicted, the ratio of FEV1/FVC, RV %, RV (in liters), RV/TLC, TLC %, TLC (in liters), DLCO (ml/min/mm Hg), DLCO %, 6 min walk test (in meters), and 6 min walk test %. Alpha-1 antitrypsin levels were present in 72/117 subjects of which genotypes were available in 39/117 subjects. A detailed explanation of the clinical implications of different Alpha-1 genotypes can be found elsewhere [Citation31]. Prior exacerbation history was defined by GOLD grade criteria as either ≥2 exacerbations in the prior year or ≥1 exacerbation leading to a hospital admission. Study data were collected and managed using REDCap electronic data capture tools [Citation32]. The study was approved by Cleveland Clinic’s central IRB (#19-217) with waiver of consent due to minimal risk to research subjects.
The control group consisted of a concurrent sample of subjects who were current and former smokers from our lung cancer screening clinic (LCS) during the same time period. Per the guidelines from the USPS Task Force [Citation20], these subjects were aged 55–80 years with ≥30 pack year smoking history and either current smokers or former smokers who had quit smoking for ≤15 years. The control group was only included if they had normal spirometry (i.e. FEV1 (%) within normal range and FEV1/FVC with a normal ratio) with no previous diagnosis of COPD and CT imaging demonstrating either “no emphysema” or “mild emphysema” per the interpretation of the radiologist. Similar to reports by others [Citation16, Citation17], we did not include healthy nonsmoking controls since these patients do not have routine screening CT scans.
CT scan analysis
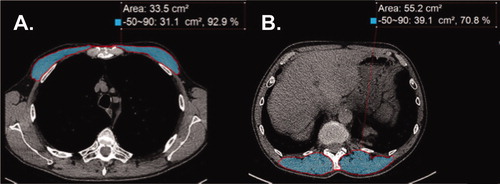
Quantitative assessments of PM and ESM CSA by image analyses of CT scans were performed ()) using Aquarius iNtuition (TeraRecon Inc, Durham, NC) by two independent readers (AA and RY) who were masked to clinical outcomes with one (RY) being a board-certified thoracic radiologist with publications on thoracic imaging evaluation [Citation33]. This was similar to our previous reports on skeletal muscle area on abdominal CT [Citation18, Citation21, Citation34]. PM area was quantified on a single axial slice of the CT scan just above the aortic arch as reported by others [Citation16, Citation17]. The superior aspect of the aortic arch was visualized and scrolled toward the apex of the lungs to identify the first axial image above the arch [Citation17]. The left and right pectoralis major and minor muscles were identified on the anterior chest and measures of area were performed. For ESM, a single-slice axial chest CT image at the level of the lower margin of the 12th thoracic vertebra was used [Citation16]. Muscles were manually selected based on an attenuation range of −50 to +90 HU, consistent with the values for skeletal muscle [Citation16, Citation17]. The aggregate area (in cm2) of PM and ESM were assessed in the axial plane.
Figure 1. Representative computed tomography (CT) scans at thoracic level used to determine muscle area in chronic obstructive pulmonary disease (COPD). (A) CT image used for pectoralis muscle imaging shaded in light blue. (B) CT image for erector spinae muscle imaging shaded in light blue. Label delineates the designated Hounsfield units for skeletal muscle from –50 to 90, the percentage of skeletal muscle mass, and the CSA measured in cm2.
A standardized semiquantitative grading of emphysema was performed by thoracic radiologists to assess the severity of emphysema at three locations (upper/middle/lower zone) in each lung following the protocol for the NETT trial [Citation35]. For each of the six locations, a numerical score of 0–4 is assigned, in which 0: represents no emphysema, 1: 1–25%; 2: 26–50%; 3: 51–75%; and 4: 76–100% of radiological evidence of emphysema. In this system, the total score can range from 0 to 24. The radiologist provides a visual estimation of axial distribution of emphysema (peripheral/central/evenly) and craniocaudal distribution (upper lobe/lower lobe/diffuse/superior segments of lower lobes) [Citation35].
Statistical analysis
Inter-reader assessments of PM CSA and ESM CSA were performed by repeating the assessment of the same CT scan for 37 subjects, by two independent readers (AA and RY), at two time points separated by approximately 3 months. We report adjusted R2 and Bland–Altman plots (Supp )) between the two sets of readings for both muscle groups, which showed no evidence for consistent bias. A subsequent analysis of another 10 subjects was performed to confirm the intraclass correlation. Student’s “t” test assuming normality were used to compare continuous variables and chi-square test was used to compare categorical variables between case subjects and control subjects. For PM and ESM CSA, all linear or logistic regression analyses were adjusted for age, sex, height, smoking status, pack years, and race. Model diagnostics, including the visual inspection of associated variables to ensure assumptions of normality were performed. Both PM and ESM CSA were normally distributed. A receiver operating characteristic curve was generated to determine the optimum cutoff for event-free survival (with events defined as mortality, bronchoscopic or surgical lung volume reduction surgery, or lung transplant) for PM and ESM CSA. We confirmed mortality through the Ohio Department of Health database [Citation36]. Time to event analysis was performed using Kaplan–Meier survival curves and log-rank tests. The composite outcome of mortality and lung transplant was chosen because these are censoring events in the natural course of COPD and others have used similar approaches for evaluation of outcomes in end stage lung diseases [Citation37–42]. We also included COPD patients who underwent lung volume reduction in our composite outcome, since lung volume reduction is believed to be representative of disease progression and a failure to respond to optimal medical therapy that is similar to those undergoing lung transplantation [Citation43]. The optimal cutoff value was based on the distribution of measurement (greater than or equal to the mean or less than the mean) in the COPD cohort of patients. A p value of less than 0.05 was considered statistically significant. All statistical analyses were performed with R version 4.0.2.
Results
The baseline clinical and demographic characteristics of the 117 COPD patients and 41 control subjects from the LCS clinic with significant smoking history are shown in . Age, sex distribution and smoking pack-years in the COPD LCS patients were similar. Since patients were not considered for LVRS or EBV if they were active smokers, current smokers represented only 0.9% of the COPD population, whereas they represented 48.8% of the LCS population. The population was predominantly Caucasian in the COPD group (91.5%) compared to 51.2% Caucasian in the LCS population (p < 0.001).
Table 1. Baseline clinical and demographic characteristics of lung cancer screening (LCS) control subjects and chronic obstructive pulmonary disease (COPD) case subjects.
Lung function
Of the COPD patients, the average FEV1 was 31% predicted for the COPD population ( and ) as compared to 98% in the LCS group (). In the COPD patients, the mean TLC was 123% (±19%) and RV was 210% (±55%). BODE index was 6.27 ± 1.47, mMRC was 3.01 ± 0.76, and CAT was 22.58 ± 7.15. Most subjects were GOLD stage III (42.7%) or IV (53.0%) and were either GOLD grade B (34.2%) or grade D (64.1%). Of the COPD patients who underwent radiologic scoring of severity of lung disease (97/117), most subjects had either central/axial distribution of emphysema (50.5%) or were evenly distributed (39.6%). In terms of craniocaudal distribution, the proportion of subjects being evaluated for advanced therapies for COPD tended to be upper lobe predominant (87.0%). Of the patients tested for Alpha-1 antitrypsin genotype prior to COPD center evaluation (n = 37), only a small number (1/117) were ZZ genotype.
Table 2. Clinical characteristics of patients with COPD.
Table 3. Spirometric measures and AATD testing of patients with COPD.
Thoracic muscle area was lower in COPD and active smokers
The inter-reader PM CSA R2 was 0.75, and ESM CSA R2 was 0.76. Bland–Altman plots did not indicate systematic bias across the range of cross-sectional muscle area determination between the two readers (Supp. )). The repeat comparison in another 10 subjects also showed no significant differences between the same two readers. PM CSA correlated with BMI with an adjusted model R2 of 0.23 (p < 0.001). ESM CSA correlated with BMI with an adjusted model R2 of 0.20 (p < 0.001). Both PM and ESM CSA were lower in COPD subjects as compared with LCS patients (). PM was lower in females and Caucasian race (as compared to males and African American race), and positively correlated with BMI (0.62 per cm2 increment, R2=0.39, p < 0.001) (). Age and pack years of smoking were not significantly associated with PM CSA (). ESM was also lower in females than males and correlated positively with BMI (0.82 per cm2 increment, R2=0.32, p < 0.001), while race, age, and pack years was not significantly associated with ESM CSA (). When stratified by GOLD stage, the PM CSA for Stages 3 and 4 were both significantly lower compared to former smokers from the LCS cohort (). Stage 2 was not included in the analysis due to insufficient power (n = 5). Current smokers in the LCS cohort had significantly lower PM CSA than the former smokers. However, ESM CSA, was not significantly different between GOLD stages 3 or 4 compared to current and former smokers (). There was a significant but only moderate positive correlation between the muscle groups for the entire cohort after adjustment for age, sex, height, smoking status, and race (R2=0.49 when correlating PM with ESM and R2=0.57 when correlating ESM with PM, p < 0.001) ( and ).
Figure 2. Muscle area in COPD patients and smoking controls. (A) Distribution of pectoralis muscle area (in cm2) stratified by GOLD stage compared to current and former smoking controls. †<p < 0.01, ‡p < 0.05 for Tukey’s test for intergroup differences. (B) Distribution of erector spinae muscle area (in cm2) stratified by GOLD stage compared to current and former smoking controls. Tukey’s test did not show significant intergroup differences.
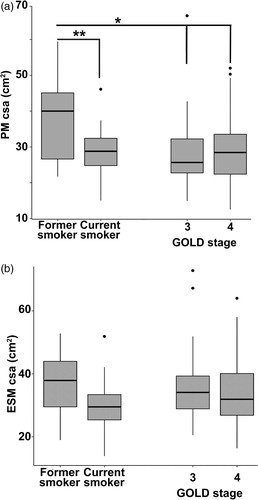
Table 4. Bivariate assessment of covariates with pectoralis muscle (PM) area in COPD subjects.
Table 5. Bivariate assessment of covariates with Erector Spinae muscle (ESM) area in COPD subjects.
Table 6. Relationship between PM CSA and physiologic parameters/clinical traits.
Table 7. Relationship between ESM CSA and physiologic parameters/clinical traits.
Sarcopenia predicted poor pulmonary and clinical outcomes
The COPD cohort data was analyzed for potential associations between muscle CSA, lung function and clinical/radiologic outcomes. PM CSA was positively correlated with FEV1, FEV1% predicted, FVC, FEV1/FVC ratio, and DLCO, and PM CSA negatively correlated with emphysema scoring (). As an example, for every 1% increase in the FEV1, the PM CSA was predicted to increase by 0.11 cm2. For every 25% increase in the FEV1, the PM CSA was predicted to increase by 2.75 cm2. For ESM CSA, there was a significant positive correlation with DLCO and negative correlations with RV/TLC ratio and emphysema scoring ().
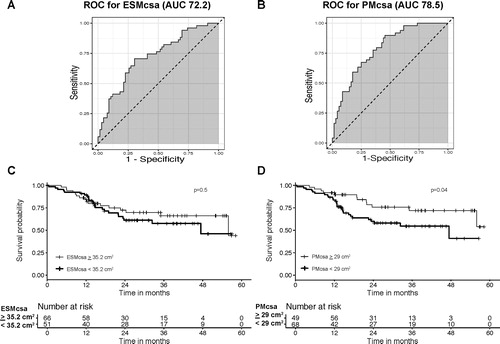
The median follow-up of 117 patients with COPD was 23.63 months (range 0.43–58.23 months) during which 14 died, 15 underwent surgical LVRS, 4 underwent bronchoscopic LVRS, and 7 underwent lung transplant. When excluding those who experienced these events, the median time of observation was longer (30.65 months, range 10.67-58.23 months). Kaplan–Meier survival curves based on the PM and ESM CSA subgroups with cutoff values based on greater than or less than the respective mean (29.00 cm2 for PM CSA and 35.20 cm2 for ESM CSA) are shown in . The patients with higher PM CSA were more likely to experience event-free survival (p = 0.04 by the log-rank test), whereas higher ESM CSA was not associated with event-free survival compared to lower (p = 0.50 by the log-rank test). Kaplan–Meier survival curves for each individual outcome (mortality, mortality or need for lung transplant, or lung volume reduction) are presented in Supp. . The individual outcomes were not statistically significant, although the cohort with lower muscle mass was more likely to experience an event in each outcome.
Figure 3. Survival analysis of patients with COPD. (A) and (B) Receiver operating characteristic curves to determine the optimum cutoff value for ESM and PM CSA and the event (death, bronchoscopic or surgical lung volume reduction surgery, or lung transplant). Area under the curve was 72.2 for ESM CSA and 78.5 for PM CSA. (C) Kaplan–Meier survival curves stratified by ESM CSA. The cutoff value corresponds to greater than or equal to the mean ESM CSA and less than the mean ESM CSA (≥ 35.2 cm2 and <35.2 cm2, respectively). The solid line indicates event-free survival probability. The crosses indicate censoring. The steps down indicate events (mortality, lung volume reduction surgery, or lung transplant). There was no significant difference for patients with COPD who had lower ESM CSA values in terms of event-free rates (p = 0.5 by log rank test). (D) Kaplan–Meier survival curves stratified by PM CSA. The cutoff value corresponds to greater than or equal to the mean PM CSA and less than the mean PM CSA (≥ 29 cm2 and <29 cm2, respectively). The solid line indicates event-free survival probability. The crosses indicate censoring. The steps down indicate events. The patients with COPD and lower PM CSA values exhibited significantly worse event-free rates (p = 0.04 by log rank test).
Discussion
Our analysis of this cohort of severe COPD patients evaluated for advanced therapies demonstrated that PM and ESM CSA correlated with severity of COPD when compared to a routinely screened population of LCS current and former smokers with normal lung function. The two muscles studied, however, correlated with different lung function parameters. Only PM CSA was associated with the severity of GOLD stage of COPD. Interestingly, current smokers also demonstrated lower PM CSA which was similar to that in COPD patients who were GOLD stages 3 and 4 and were former smokers.
Our data show that PM CSA was more associated with spirometric parameters than ESM CSA. PM CSA correlated positively with FEV1, FEV1% predicted, FVC, FEV1/FVC ratio, and DLCO. DLCO is also associated with worsening emphysema in COPD [Citation44]. This is consistent with previous studies showing that reductions in PM CSA are associated with worsening lung function [Citation17]. We also noted that PM CSA correlated negatively with worsening radiologic emphysema, which is also consistent with previous studies [Citation17] while ESM CSA correlated negatively with RV/TLC, a marker of hyperinflation [Citation45], DLCO, as well as the radiologic severity of emphysema. Since ESM is an antigravity muscle, it is possible that worsening hyperinflation, hypoxemia on exertion due to severe emphysema, and exercise limitation [Citation46] could contribute to deconditioning as reflected by reductions in ESM [Citation46]. These observations are of direct clinical relevance to determine responses to resistance versus endurance exercise in COPD [Citation47], as measures focusing on resistance exercise would improve pectoralis musculature while endurance exercise would improve the erector spinae. The findings of our study highlight the loss of both PM and ESM mass in both are associated with deleterious effects in lung function, and therefore pulmonary rehabilitation should include both resistance and endurance training.
Limitations of our study include the highly select population of patients with COPD with severe disease who had failed conventional clinical management referred to the lung volume reduction program. Given that mortality or need for lung transplant are commonly used as a composite outcome in the literature [Citation37–42], and a significant proportion of subjects were referred by the transplant group to us (or vice versa), we believe that including the need for lung volume reduction in the composite outcome provides meaningful clinical information about a subcategory of patients who have failed optimal clinical management due to their severity of illness. While our composite outcome was significantly associated with reductions in PM CSA, the individual components (mortality, mortality or need for lung transplant, or need for lung volume reduction) were not statistically significant alone. It is possible that the observation period of our study may have affected the results, as our median time of observation (excluding events) was 2.6 years. However, given the fact that our patients had severe disease with a high risk for mortality (as evidenced by an average BODE index of 6.3), we believe the time of observation allowed for meaningful clinical information to be demonstrated. Since the factors that contribute to the endpoints can be overlapping, a composite rather than independent end points could have contributed to the significant impact on outcomes.
Other limitations are that most of the patients in our COPD cohort were former smokers, which is a prerequisite for consideration of LVRS and EBV therapy in smoking related COPD. This allows us to evaluate the consequences of the chronic inflammatory nature of COPD without the additive effect of active smoking, but future studies are needed in COPD patients who are actively smoking. CT scans are not recommended routinely due to the risk of radiation and cost unless the benefit outweighs the risk. Our studies, however, lay the foundation for developing reproducible and cost-effective measures of muscle area measurements in the evaluation of COPD patients to target them for interventions. Very few patients (n = 5) were included in the moderate category for COPD (GOLD stage 2) unless their FEV1 was close to 50% and had significant symptoms owing to the nature of evaluation for LVRS which excludes those with FEV1>50% [Citation35]. There may have also been a referral bias for evaluation for LVRS/EBV as the vast majority of subjects referred had upper lobe predominant emphysema (given this population demonstrated the most benefit in the NETT trial [Citation35]). Similarly, only a small number of patients with alpha 1 antitrypsin deficiency (ZZ genotype) were considered for LVRS likely due to evidence for poor outcomes seen from long-term follow up from the NETT trial [Citation35, Citation48]. While mortality, LVRS intervention, or lung transplant within our EMR system (or visible through our EMR’s healthcare information exchange) could be determined, it was not possible to determine if those events occurred outside of this system. Despite these limitations, our data demonstrate the high clinical significance of sarcopenia in COPD. Our study found that reductions in PM CSA was associated with events (defined as mortality, bronchoscopic or surgical lung volume reduction, or lung transplant) in contrast to ESM CSA which was not associated with these events. These data were different from reports by others that reductions in ESM CSA were more often associated with mortality than PM CSA [Citation16]. These maybe due to differences in patient populations since previous studies included a large number of early stage COPD patients and did not consider adjunct therapies for end stage COPD including lung volume reduction or lung transplant [Citation16]. Our analysis of end stage COPD patients also found that PM CSA was more often associated with adverse clinical events than ESM CSA.
When each of the composite outcomes were analyzed separately, reductions in PM CSA and need for lung volume reduction approached statistical significance (p = 0.07). We note that most patients who undergo lung volume reduction have an “emphysema phenotype,” which is more often associated with extrapulmonary loss of tissue (including muscle mass) [Citation49]. It is possible that the association between reductions in PM CSA and LVR were due to physician related selection bias of those with emphysema phenotype. Therefore, the clinical relevance of our analysis may not extend to all COPD populations and such analyses need to be done in different COPD phenotypes [Citation50].
Sarcopenia is common in advanced COPD and correlates with disease severity [Citation5, Citation6] but measurements of muscle mass are not standard clinical practice. While low BMI has been used as a surrogate for sarcopenia and correlates with poor outcomes [Citation29], there are a number of COPD patients with normal weight or even obesity who have sarcopenia [Citation51]. Objective measures of sarcopenia including bioelectric impedance or handgrip strength are not routinely performed [Citation52]. Our data using clinical imaging are consistent with previous reports that CT scan analysis of muscle mass could provide an objective measure of sarcopenia and the impact on clinical outcomes.
Our cohort included a significant proportion of patients on home oxygen, with 53% on continuous oxygen and 17.1% on oxygen with exertion. Recent studies have noted reductions in physical activity in patients who initiate supplemental oxygen [Citation53, Citation54]. Therefore, it is possible that supplemental oxygen and not COPD severity alone may have influenced muscle mass in our analysis.
We noted a significant association between active smoking and PM CSA muscle loss. The inflammatory nature of active smoking and its impact on skeletal muscle loss and dysfunction is known [Citation24–27], and muscle loss was reversible in a murine model of cigarette smoking when exposure to smoking was discontinued [Citation55]. Moreover, smoking cessation was associated with increases in muscle mass and muscle strength in a twelve-month longitudinal study of adult smokers [Citation56]. However, our data show that despite cessation of smoking, patients in our study had low muscle mass suggesting that development of COPD may prevent recovery of muscle mass in former smokers. Our observations reiterate the need to stop smoking to avoid persistent muscle mass loss and adverse clinical outcomes and emphasizes the importance of smoking cessation counseling by doctors and other providers [Citation57].
In summary, in a large and well characterized cohort of severe COPD patients referred for lung volume reduction, the majority of patients had reduction in PM and ESM CSA that correlated with lung function and radiologic severity of COPD. While PM CSA was associated with spirometric measures, ESM was associated with hyperinflation, and both were associated with worsening emphysema. Only higher PM CSA was associated with composite event-free survival. Finally, current smokers showed evidence for significant reductions in PM CSA similar to those with severe COPD subjects who were largely former smokers after adjustment for pack years of smoking. Our findings highlight the contrasting nature of these muscles and their clinical relevance to patients with severe COPD.
Authors’ contributions
| Abbreviations | ||
| COPD | = | chronic obstructive pulmonary disease |
| LVRS | = | lung volume reduction surgery |
| LCS | = | lung cancer screening |
| ESM | = | erector spinae muscle |
| PM | = | pectoralis muscle |
| EBV | = | endobronchial valves |
| USPST | = | United States Preventive Services Taskforce |
Amy Attaway and Srinivasan Dasarathy contributed to conceptualization, design, data acquisition, analysis, interpretation, writing the manuscript, and obtaining funding. Nicole Welch contributed to interpretation of data, manuscript writing and editing, and preparing figures. Ruchi Yadav, Joe Zein, Marielle Engelen, Yvonne Meli, Umur Hatipoglu, and Annette Bellar contributed to analysis and interpretation of data, reviewing and editing manuscript.
Data availability statement
A data availability statement provided by the authors is available upon request.
Disclosure statement
The authors report no other conflicts of interest. The funders had no role in the design, analysis or interpretation of the data.
Additional information
Funding
References
- Disease burden and mortality estimates. World Health Organization. Available from: https://wwwwhoint/healthinfo/global_burden_disease/estimates/en/. 2000-2016.
- Heron M. Deaths: leading causes for 2017. Natl Vital Stat Rep. 2017;66(5):1–76.
- Adeloye D, Chua S, Lee C, Global Health Epidemiology Reference Group (GHERG), et al. Global and regional estimates of COPD prevalence: systematic review and meta-analysis. J Glob Health. 2015;5(2):020415 DecDOI:https://doi.org/10.7189/jogh.05-020415
- Rycroft CE, Heyes A, Lanza L, et al. Epidemiology of chronic obstructive pulmonary disease: a literature review. Int J Chron Obstruct Pulmon Dis. 2012;7:457–494. DOI:https://doi.org/10.2147/COPD.S32330
- Engelen MP, Schols AM, Lamers RJ, et al. Different patterns of chronic tissue wasting among patients with chronic obstructive pulmonary disease. Clin Nutr. 1999;18(5):275–280. DOI:https://doi.org/10.1016/S0261-5614(98)80024-1
- Engelen MP, Schols AM, Baken WC, et al. Nutritional depletion in relation to respiratory and peripheral skeletal muscle function in out-patients with COPD. Eur Respir J. 1994;7(10):1793–1797. DOI:https://doi.org/10.1183/09031936.94.07101793
- Schols AM, Broekhuizen R, Weling-Scheepers CA, et al. Body composition and mortality in chronic obstructive pulmonary disease. Am J Clin Nutr. 2005;82(1):53–59. DOI:https://doi.org/10.1093/ajcn.82.1.53
- Jones SE, Maddocks M, Kon SS, et al. Sarcopenia in COPD: prevalence, clinical correlates and response to pulmonary rehabilitation. Thorax. 2015;70(3):213–218. DOI:https://doi.org/10.1136/thoraxjnl-2014-206440
- Swallow EB, Reyes D, Hopkinson NS, et al. Quadriceps strength predicts mortality in patients with moderate to severe chronic obstructive pulmonary disease. Thorax. 2007;62(2):115–120. DOI:https://doi.org/10.1136/thx.2006.062026
- Roig M, Eng JJ, MacIntyre DL, et al. Deficits in muscle strength, mass, quality, and mobility in people with chronic obstructive pulmonary disease. J Cardiopulm Rehabil Prev. 2011;31(2):120–124. DOI:https://doi.org/10.1097/HCR.0b013e3181f68ae4
- Attaway AH, Welch N, Hatipoglu U, et al. Muscle loss contributes to higher morbidity and mortality in COPD: an analysis of national trends. Respirology. 2021;26(1):62–71. DOI:https://doi.org/10.1111/resp.13877.
- Newman AB, Kupelian V, Visser M, Health ABC Study Investigators, et al. Sarcopenia: alternative definitions and associations with lower extremity function. J Am Geriatr Soc. 2003;51(11):1602–1609. DOI:https://doi.org/10.1046/j.1532-5415.2003.51534.x
- Schols AM, Soeters PB, Dingemans AM, et al. Prevalence and characteristics of nutritional depletion in patients with stable COPD eligible for pulmonary rehabilitation. Am Rev Respir Dis. 1993;147(5):1151–1156. DOI:https://doi.org/10.1164/ajrccm/147.5.1151
- Shen W, Punyanitya M, Wang Z, et al. Total body skeletal muscle and adipose tissue volumes: estimation from a single abdominal cross-sectional image. J Appl Physiol. 2004;97(6):2333–2338. DOI:https://doi.org/10.1152/japplphysiol.00744.2004
- Dasarathy S, Merli M. Sarcopenia from mechanism to diagnosis and treatment in liver disease. J Hepatol. 2016;65(6):1232–1244. DOI:https://doi.org/10.1016/j.jhep.2016.07.040
- Tanimura K, Sato S, Fuseya Y, et al. Quantitative assessment of erector spinae muscles in patients with chronic obstructive pulmonary disease. Annals ATS. 2016;13(3):334–341. DOI:https://doi.org/10.1513/AnnalsATS.201507-446OC
- McDonald ML, Diaz AA, Ross JC, et al. Quantitative computed tomography measures of pectoralis muscle area and disease severity in chronic obstructive pulmonary disease. A cross-sectional study. Annals ATS. 2014;11(3):326–334. DOI:https://doi.org/10.1513/AnnalsATS.201307-229OC
- Tsien C, Shah SN, McCullough AJ, et al. Reversal of sarcopenia predicts survival after a transjugular intrahepatic portosystemic stent. Eur J Gastroenterol Hepatol. 2013;25(1):85–93.
- Results of initial low-dose computed tomographic screening for lung cancer. New Eng J Med. 2013;368(21):1980–1991.
- Mazzone P, Powell CA, Arenberg D, et al. Components necessary for high-quality lung cancer screening: American College of Chest Physicians and American Thoracic Society Policy Statement. Chest. 2015;147(2):295–303. DOI:https://doi.org/10.1378/chest.14-2500
- Welch N, Dasarathy J, Runkana A, et al. Continued muscle loss increases mortality in cirrhosis: impact of aetiology of liver disease. Liver Int. 2020;40(5):1178–1188. DOI:https://doi.org/10.1111/liv.14358
- Ikezoe T, Mori N, Nakamura M, et al. Effects of age and inactivity due to prolonged bed rest on atrophy of trunk muscles. Eur J Appl Physiol. 2012;112(1):43–48. DOI:https://doi.org/10.1007/s00421-011-1952-x
- Ratnovsky A, Elad D, Halpern P. Mechanics of respiratory muscles. Respir Physiol Neurobiol. 2008;163(1–3):82–89. DOI:https://doi.org/10.1016/j.resp.2008.04.019
- Nakatani T, Nakashima T, Kita T, et al. Responses of exposure to cigarette smoke at three dosage levels on soleus muscle fibers in Wistar-Kyoto and spontaneously hypertensive rats. Jpn J Pharmacol. 2002;90(2):157–163. DOI:https://doi.org/10.1254/jjp.90.157
- Basic VT, Tadele E, Elmabsout AA, et al. Exposure to cigarette smoke induces overexpression of von Hippel-Lindau tumor suppressor in mouse skeletal muscle. Am J Physiol Lung Cell Mol Physiol. 2012;303(6):L519–27. DOI:https://doi.org/10.1152/ajplung.00007.2012
- Hansen MJ, Chan SP, Langenbach SY, et al. IL-17A and serum amyloid A are elevated in a cigarette smoke cessation model associated with the persistence of pigmented macrophages, neutrophils and activated NK cells. PLoS One. 2014;9(11):e113180 DOI:https://doi.org/10.1371/journal.pone.0113180
- Krüger K, Dischereit G, Seimetz M, et al. Time course of cigarette smoke-induced changes of systemic inflammation and muscle structure. Am J Physiol Lung Cell Mol Physiol. 2015;15309(2):L119–28. DOI:https://doi.org/10.1152/ajplung.00074.2015
- Gupta N, Pinto LM, Morogan A, et al. The COPD assessment test: a systematic review. Eur Respir J. 2014;44(4):873–884. DOI:https://doi.org/10.1183/09031936.00025214
- Celli BR, Cote CG, Marin JM, et al. The body-mass index, airflow obstruction, dyspnea, and exercise capacity index in chronic obstructive pulmonary disease. N Engl J Med. 2004;4350(10):1005–1012. DOI:https://doi.org/10.1056/NEJMoa021322
- Charlson ME, Pompei P, Ales KL, et al. A new method of classifying prognostic comorbidity in longitudinal studies: development and validation. J Chronic Dis. 1987;40(5):373–383. DOI:https://doi.org/10.1016/0021-9681(87)90171-8
- Stoller JK, Hupertz V, Aboussouan LS, et al. Alpha-1 antitrypsin deficiency. 2006 Oct 27 [Updated 2020 May 21]. In: Adam MP, Ardinger HH, Pagon RA, editors. GeneReviews® [Internet]. Seattle (WA): University of Washington, Seattle; 1993-2020. Available from: https://www.ncbi.nlm.nih.gov/books/NBK1519/.
- Harris PA, Taylor R, Thielke R, et al. Research electronic data capture (REDCap)–a metadata-driven methodology and workflow process for providing translational research informatics support . J Biomed Inform. 2009;42(2):377–381. DOI:https://doi.org/10.1016/j.jbi.2008.08.010
- Southern BD, Scheraga RG, Yadav R. Managing interstitial lung disease detected on CT during lung cancer screening. Cleve Clin J Med. 2016;83(1):55–65. DOI:https://doi.org/10.3949/ccjm.83a.14157
- Dasarathy J, Periyalwar P, Allampati S, et al. Hypovitaminosis D is associated with increased whole body fat mass and greater severity of non-alcoholic fatty liver disease. Liver Int. 2014;34(6):e118–e127. DOI:https://doi.org/10.1111/liv.12312
- Fishman A, Martinez F, Naunheim K, et al. A randomized trial comparing lung-volume-reduction surgery with medical therapy for severe emphysema. N Engl J Med. 2003;348(21):2059–2073.
- Mortality Statistics. Ohio Dept of Health. 2020. (Date accessed December 7 2020.). Available from: https://odh.ohio.gov/wps/portal/gov/odh/home/data.
- Case AH, Hellkamp AS, Neely ML, et al. Associations between patient-reported outcomes and death or lung transplant in idiopathic pulmonary fibrosis. data from the idiopathic pulmonary fibrosis prospective outcomes registry. Ann Am Thorac Soc. 2020;17(6):699–705. DOI:https://doi.org/10.1513/AnnalsATS.201906-437OC
- Snyder L, Neely ML, Hellkamp AS, on behalf of the IPF-PRO™ Registry investigators, et al. Predictors of death or lung transplant after a diagnosis of idiopathic pulmonary fibrosis: insights from the IPF-PRO Registry. Respir Res. 2019;20(1):105. DOI:https://doi.org/10.1186/s12931-019-1043-9
- Durheim MT, Judy J, Bender S, et al. In-hospital mortality in patients with idiopathic pulmonary fibrosis: a US cohort study. Lung. 2019;197(6):699–707. DOI:https://doi.org/10.1007/s00408-019-00270-z
- Pulido T, Adzerikho I, Channick RN, et al. Macitentan and morbidity and mortality in pulmonary arterial hypertension. N Engl J Med. 2013;369(9):809–818. DOI:https://doi.org/10.1056/NEJMoa1213917
- Moore OA, Goh N, Corte T, et al. Extent of disease on high-resolution computed tomography lung is a predictor of decline and mortality in systemic sclerosis-related interstitial lung disease. Rheumatology (Oxford). 2013;52(1):155–160. DOI:https://doi.org/10.1093/rheumatology/kes289
- Alabed S, Shahin Y, Garg P, et al. Cardiac-MRI predicts clinical worsening and mortality in pulmonary arterial hypertension: a systematic review and meta-analysis. JACC Cardiovasc Imaging. 2020;S1936-878X(20)30731-2. DOI:https://doi.org/10.1016/j.jcmg.2020.08.013.
- Freemantle N, Calvert M, Wood J, et al. Composite outcomes in randomized trials: greater precision but with greater uncertainty? JAMA 2003;289(19):2554–2559. DOI:https://doi.org/10.1001/jama.289.19.2554
- Saure EW, Bakke PS, Lind Eagan TM, et al. Diffusion capacity and CT measures of emphysema and airway wall thickness – relation to arterial oxygen tension in COPD patients. Eur Clin Respir J. 2016;3(1):29141. DOI:https://doi.org/10.3402/ecrj.v3.29141
- Shin TR, Oh YM, Park JH, et al. The prognostic value of residual volume/total lung capacity in patients with chronic obstructive pulmonary disease. J Korean Med Sci. 2015;30(10):1459–1465. DOI:https://doi.org/10.3346/jkms.2015.30.10.1459
- Zafar MA, Tsuang W, Lach L, et al. Dynamic hyperinflation correlates with exertional oxygen desaturation in patients with chronic obstructive pulmonary disease. Lung. 2013;191(2):177–182. DOI:https://doi.org/10.1007/s00408-012-9443-3
- McCarthy B, Casey D, Devane D, et al. Pulmonary rehabilitation for chronic obstructive pulmonary disease. Cochrane Database Syst Rev. 2015;(2):CD003793. DOI:https://doi.org/10.1002/14651858.CD003793.pub3.
- Stoller JK, Gildea TR, Ries AL, et al. Lung volume reduction surgery in patients with emphysema and alpha-1 antitrypsin deficiency. Ann Thorac Surg. 2007;83(1):241–251. DOI:https://doi.org/10.1016/j.athoracsur.2006.07.080
- Celli BR, Locantore N, Tal-Singer R, et al. Emphysema and extrapulmonary tissue loss in COPD: a multi-organ loss of tissue phenotype. Eur Respir J. 2018;51(2):1702146. DOI:https://doi.org/10.1183/13993003.02146-2017
- Corlateanu A, Mendez Y, Wang Y, et al. Chronic obstructive pulmonary disease and phenotypes: a state-of-the-art. . Pulmonology. 2020;26(2):95–100. 2020/03/01/DOI:https://doi.org/10.1016/j.pulmoe.2019.10.006
- Joppa P, Tkacova R, Franssen FM, et al. Sarcopenic obesity, functional outcomes, and systemic inflammation in patients with chronic obstructive pulmonary disease. J Am Med Dir Assoc. 2016;17(8):712–718. DOI:https://doi.org/10.1016/j.jamda.2016.03.020
- de Blasio F, Di Gregorio A, de Blasio F, et al. Malnutrition and sarcopenia assessment in patients with chronic obstructive pulmonary disease according to international diagnostic criteria, and evaluation of raw BIA variables. Respir Med. 2018;134:1–5. DOI:https://doi.org/10.1016/j.rmed.2017.11.006
- Mazzarin C, Kovelis D, Biazim S, et al. Physical inactivity, functional status and exercise capacity in COPD patients receiving home-based oxygen therapy. COPD 2018;15(3):271–276. DOI:https://doi.org/10.1080/15412555.2018.1469608
- Paneroni M, Ambrosino N, Simonelli C, et al. Physical activity in patients with chronic obstructive pulmonary disease on long-term oxygen therapy: a cross-sectional study. Int J Chron Obstruct Pulmon Dis. 2019;14:2815–2823. DOI:https://doi.org/10.2147/COPD.S228465
- Ajime TT, Serré J, Wüst RCI, et al. Two weeks of smoking cessation reverse cigarette smoke-induced skeletal muscle atrophy and mitochondrial dysfunction in mice. Nicotine Tob Res. 2021;23(1):143–151. DOI:https://doi.org/10.1093/ntr/ntaa016
- Rom O, Reznick AZ, Keidar Z, et al. Smoking cessation-related weight gain-beneficial effects on muscle mass, strength and bone health. Addiction. 2015;110(2):326–335. DOI:https://doi.org/10.1111/add.12761
- Hersi M, Traversy G, Thombs BD, et al. Effectiveness of stop smoking interventions among adults: protocol for an overview of systematic reviews and an updated systematic review. Syst Rev. 2019;8(1):28. DOI:https://doi.org/10.1186/s13643-018-0928-x