
Abstract
The objective of this study is to estimate the excess economic burden of Asthma-COPD Overlap (ACO) among older adults in the United States. We used a cross-sectional study design with data from a nationally representative survey of Medicare beneficiaries (Medicare Current Beneficiary Survey) linked to Medicare fee-for-service claims. Older adults with ACO had higher average total healthcare expenditures ($45,532 vs. $12,743) and higher out-of-pocket spending burden (19% vs. 8.5%) compared to those with no-asthma no-COPD (NANC). Individuals with ACO also had almost two, and 1.5 times higher expenditures compared to individuals with asthma only and COPD only, respectively. Multivariable regression models indicated that the adjusted associations of ACO to economic burden remained positive and statistically significant. In comparison with NANC, nearly three-quarters of the excess total healthcare expenditures and 83% of the out-of-pocket spending burden of older adults with ACO were explained by differences in predisposing, enabling, need, personal healthcare practices, and external factors among the two groups. The higher number of unique medications and the increased incidence of fragmented care were the leading contributors to the excess economic burden among older adults with ACO comparing to NANC individuals. Interventions that reduce the number of medications and fragmented care have the potential to reduce the excess economic burden among older adults with ACO.
Introduction
In the United States (US), chronic obstructive respiratory disease in older individuals occurs most often as COPD or asthma [Citation1]. Among 15–45% of older adults initially diagnosed with COPD or asthma, can later develop “Asthma-COPD overlap” (ACO) with symptoms consistent with each disease state [Citation2]. A significant disease burden and adverse health consequences exist for ACO patients compared to patients with either asthma only or COPD only. Prior research suggest that ACO patients experience higher acute respiratory events, outpatient visits, and hospitalizations compared to those with either asthma only or COPD only [Citation1, Citation3, Citation4]. The prevalence rates of comorbid medical conditions and polypharmacy are also higher in ACO compared to either asthma or COPD [Citation5], suggesting that adults with ACO may constitute a significant economic burden.
However, current estimates of the economic burden of ACO in older adults are unknown. There have been only two studies in the US on the economic burden of ACO. The first study was conducted among enrollees of Medicare Advantage Plan in 2004. This study found that the average annual healthcare expenditures for the patients with ACO is higher than patients with COPD only [Citation6]. The second study was a retrospective commercial claims analysis which reported that healthcare expenditures were twice as high for patients with ACO compared to those with asthma only between 2007-2010 [Citation7]. Neither of these studies provided any information on average total healthcare expenditures, out-of-pocket (OOP) expenditures, and high OOP spending burden of older adults with ACO or compared economic burden with those who had no-asthma no-COPD (NANC).
Estimating the excess economic burden of ACO is important for several reasons. First, there is an emerging focus on achieving optimal healthcare with the triple aims of better health, higher quality, and lower costs [Citation8]. For reducing overall healthcare costs, identification and management of high-cost conditions are very important [Citation9]. Second, reducing costs also requires innovative practice models and payment reforms [Citation10]. For example, innovative payment models such as bundled payments for episodes of care need critical information on high-cost individuals as part of case mix adjustments [Citation11]. Third, estimating the excess economic burden can provide benchmarks for deriving cost-effectiveness of targeted interventions for management of ACO [Citation12]. Finally, estimating the economic burden of ACO can translate disease burden into a universal metric (i.e. monetary value) which can be used for decision making by payers, policymakers, and other stakeholders [Citation13].
Although quantifying excess economic burden of ACO can provide needed information for decision making, it may not provide enough information to act on because costs are influenced by many factors including severity, care fragmentation [Citation14], age [Citation15], and presence of other chronic conditions[Citation16]. Understanding the extent to which differences in patient-level factors drive the excess economic burden of ACO is vital to case-mix adjustment, allocation of resources, payment reforms, cost-sharing, and cost reduction efforts. Therefore, the main objectives of this study are to quantify the economic burden of ACO using data from a nationally representative sample of Medicare beneficiaries, and estimate the extent to which differences in characteristics among patients with ACO and NANC explained this economic burden.
Methods
Study design
This study used a cross-sectional study design and evaluated data from multiple years of linked fee-for-service Medicare claims with a nationally representative survey of Medicare beneficiaries.
Data source
This study used the Medicare Current Beneficiary Survey (MCBS) linked to fee-for-service Medicare claims from 2006 through 2013. The MCBS is a rotating panel survey of a nationally representative sample of individuals enrolled in Medicare Part A and B. Each MCBS panel is interviewed up to three-times a year over a four-year period. The survey data sources provide information on direct medical costs, sources of payment, OOP payments, health outcomes, clinical diseases, and sociodemographic of beneficiaries [Citation17]. To improve the completeness and accuracy of medical costs and utilization, survey data are matched with fee-for-service Medicare claims for making best of both claims and survey data worlds [Citation18]. For this study, we used Medicare claims files for capturing information on health conditions and third-party payments. We also used “Cost and Use” (CU) survey files for deriving OOP burden and other variables (e.g. sex, age, race, prescription coverage, education level, disability status, smoking habit, and residency region).
Study sample
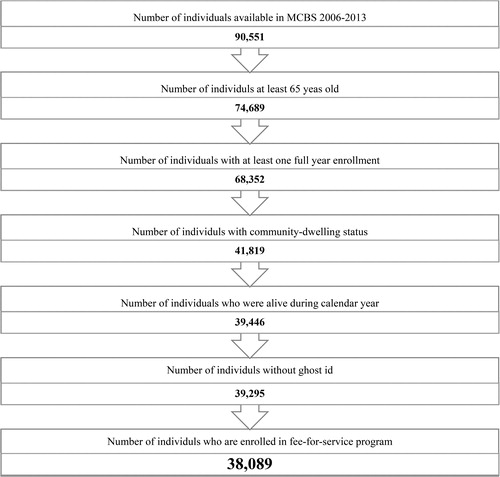
The final analytical sample consisted of 38,089 person years and included community-dwelling Medicare beneficiaries who were 65 years or older, alive throughout the calendar year, and enrolled in both Parts A and B fee-for-service during the calendar year().
Figure 1. Attrition table of individuals included in the analysis based on inclusion and exclusion criteria.
Measures
Dependent variables: Economic burden
Total healthcare expenditures: All expenditures information in MCBS linked to Medicare claims files was extracted through a reconciliation process by combing survey information and Medicare claims files [Citation17]. Linking these files provide a unique opportunity of cost analyses on the Medicare population compared to using either survey data or claims data alone [Citation18]. Respondents to the survey utilized calendars to record their medical events and were asked to save all their healthcare receipts from insurance companies, their OOP healthcare receipts, and prescription bags provided by the pharmacy. Total healthcare expenditures were calculated by adding all the expenditures for inpatient visits, outpatient visits, prescription drugs, medical provider services, and other medical services (e.g. dental, vision). Sources of payment included both third-party expenditures and out-of-pocket (OOP) expenditures. To account for inflation of medical services, all the expenditures were converted to 2013-equivalent US dollars by using the annual consumer price index of medical services [Citation19].
High OOP spending burden of individuals and families: OOP expenditures in the MCBS represented amount spent by the patients or their families on healthcare but did not include insurance premium. To capture OOP expenditures, respondents of the MCBS were asked to record all of the details on what they spent on healthcare bills and what they expected to spend on additional bills [Citation17]. Respondents also reported their household income. OOP “spending burden” was calculated as the ratio of OOP to income. Older adults who spent more than 10% of their income on healthcare were classified as having a “high OOP burden”.
Spending more than 10% of income on healthcare may take away from essential living expenses such as housing and food. As there is no consensus on the definition of OOP burden, we chose the 10% threshold based on previously published literature which reported that this threshold is above generally accepted affordability standards [Citation20, Citation21].
Key independent variable: Asthma/COPD categories
The key independent variable of this study was asthma/COPD categories. Individuals with either asthma or COPD were identified by using the International Classification of Diseases, 9th edition diagnostic codes available in fee-for-service Medicare claims (Appendix 1). We used inpatient, outpatient, physician, skilled nursing home, and home healthcare claims. The diagnosis codes for identification of asthma and COPD cases have been used in previously well-designed published research [Citation7, Citation22–26]. Individuals with a minimum of two outpatient visits (at least 14 days apart) or one inpatient visit for asthma were considered to have asthma. Older adults with one inpatient or two outpatient visits (at least 14 days apart) for COPD were categorized as individuals with COPD. Based on the presence of asthma or COPD, we created the following four asthma/COPD categories: 1) ACO; 2) Asthma only; 3) COPD only; and 4) NANC.
Other independent variables
The selection of other independent variables that could affect expenditures were derived from published literature [Citation27, Citation28] and guided by Andersen’s Healthcare Behavioral Framework [Citation29]. Based on the model, the healthcare outcomes (in our study total healthcare expenditures) is affected by predisposing (age, sex, and race), enabling (marital status, education level, poverty status, prescription coverage, and fragmented care), need (number of chronic conditions, number of activities of daily living (ADL), and number of unique medications) factors; personal healthcare practices (obesity and smoking status); and external environment (e.g. residency region). For this study, chronic conditions included: cancer, diabetes, hypertension, heart disease, arthritis, and osteoporosis. We calculated fragmented care similar to previous studies [Citation30, Citation31].
Statistical analyses
Patient characteristics by asthma/COPD categories were compared using chi-square test for categorical variables and ANOVA for continuous variables. The unadjusted and adjusted associations of asthma/COPD categories to economic burden were evaluated using generalized linear models (GLM). GLM with a gamma distribution and log-link function was used for total and third-party expenditures and GLM with binomial distribution and log-link function (i.e. logistic regression) was used to model high OOP burden. The robust estimates of excess burden of ACO were derived using the counterfactual recycled prediction. Separate models were used for total healthcare expenditures, third-party expenditures, and OOP expenditures. In all the models, the reference group was NANC. In the adjusted models, we controlled for predisposing, enabling, need factors, personal healthcare practices, and external environmental factors.
To estimate the extent to which differences in characteristics of individuals among the four groups (ACO, asthma only, COPD only, and NANC) contribute to the excess economic burden, we used linear and non-linear decomposition analyses. In these analyses, we distinguish between explained and unexplained parts of the average difference in an outcome (example: total healthcare expenditures). The explained part was derived by taking the differences in average characteristics between two groups and weighting by regression co-efficient estimates from the pooled regression of fully adjusted model. Unexplained portion was derived from differences in regression-coefficients of the two groups weighted by average characteristics of groups.
Linear decomposition analysis followed the Blinder-Oaxaca approach for survey data using pooled regression weights. The decomposition analysis used log-transformed total healthcare expenditures as the dependent variable and assesses how much of the difference in log-transformed total healthcare expenditures between groups can be due to difference in characteristics (e.g. the predisposing, enabling, need, personal healthcare practices, and external environmental factors described above). For high OOP burden, we used the non-linear decomposition technique proposed by Fairlie [Citation32]. We summarize results from the decomposition analysis by comparing NANC to: 1) ACO; 2) COPD only and 3) asthma only. All data management and analyses were conducted with SAS 9.4 (SAS Institute Inc., Cary, NC) and we used Stata 14 (Stata Corp LLC, College Station, TX) for decomposition analyses.
Results
Sample description
The study sample consisted of 38,089 person-years and included community-dwelling, full-year enrolled in fee-for-service Parts A and B, elderly (age > 65 years) Medicare beneficiaries (Appendix 2). The prevalence of ACO, asthma only, and COPD only conditions were 1.5%, 2.4%, and 8.8%, respectively, between 2006 and 2013. ACO, asthma only, COPD only, and NANC groups were significantly different in terms of all predisposing, enabling, need, personal healthcare practices, and external factors (). For example, individuals with ACO had the highest rates of poverty (59.8% vs 44.2%) and higher levels of fragmented care (78.08 ± 12.01 vs 66.08 ± 22.17) and higher number of unique medications (16.12 ± 7.27 vs 7.53 ± 5.32) as compared to NANC.
Table 1. Unweighted N and weighted percentages of characteristics by asthma /COPD Categories (Column %) Older (age > 65 years) Medicare Beneficiaries Medicare Current Beneficiary Survey, 2006–2013.
Healthcare and Third-Party payers’ expenditures
The unadjusted and adjusted average annual total healthcare and third-party expenditures are provided in . Average total, third-party, and OOP expenditures were significantly higher for all asthma/COPD categories compared to NANC. Medicare beneficiaries with ACO in comparison with NANC had almost 3.5-times higher unadjusted annual average total healthcare expenditures ($45,532 vs. $12,743), with an excess per patient cost of $32,789 (p < 0.001) (). The excess total healthcare expenditures for COPD only and asthma only over NANC were $17,409 and $10,760, respectively. The excess third-party expenditures for ACO, COPD only, and asthma only were $31,113, $16,383, and $9,459 (), respectively. Similar differences were observed in OOP payments.
Figure 2. Total healthcare expenditures and high out-of-pocket burden by Asthma/ COPD categories older (age > 65 years) medicare beneficiaries medicare current beneficiary SURVEY, 2006–2013.
Note: (a) Unadjusted expenditures, (b) Adjusted expenditures from recycle prediction” group, (c) high OOP spending burden percentage (d) Unadjusted and adjusted odds ratio of high OOP spending burden by asthma/COPD categories
Based on 38,089 elderly Medicare beneficiaries who were observed between years 2006 and 2013. The variables in the adjusted models were selected based on Andersen’s healthcare behavioral model and include sex, age, race, marital status, poverty, education, prescription coverage, fragmented care, # ADL, # chronic conditions, # unique medications, overweight, smoking habit, and residency region.
Abbreviations: ADL: Activity Daily Limitation; COPD: chronic obstructive pulmonary disease; OOP: Out-of-Pocket; Log: natural logarithm; #: number; $: Dollar; %: Percentage; +: Excess cost comparing to no-asthma no-COPD.
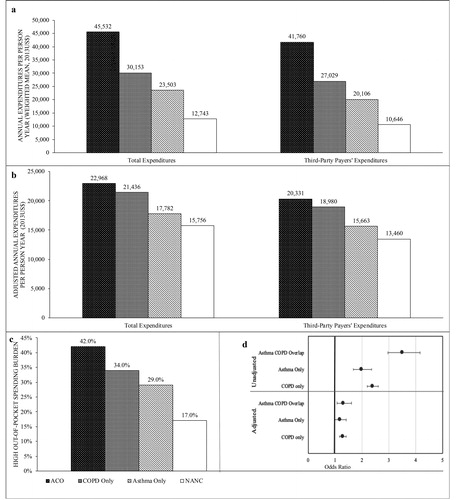
Using recycled prediction, we observed that annual total healthcare expenditures remained significantly higher () for those with ACO ($22,968), yielding an excess cost of $7,211 (p < 0.001). Adjusted annual third-party payers’ expenditures were significantly higher ($6,871) for individuals with ACO as compared to NANC. Compared to older adults with asthma only, individuals with ACO had excess total healthcare expenditures of $11,505 (p < 0.001), and third-party payers’ expenditures of $11,351 (p < 0.001). Moreover, individuals with ACO had $6,504 (p < 0.001) excess total healthcare expenditures and $6,273 (p < 0.001) higher third-party payers’ expenditures in comparison with those with COPD only.
Results from the linear decomposition analysis are summarized in . The average predicted log-transformed total healthcare expenditures for the ACO group was 10.393 units; the corresponding figure for NANC was 8.994 units, yielding a difference of 1.399 log-transformed expenditures. We found that differences in predisposing, enabling, need, personal healthcare practices, and external factors could explain 77% of this difference in average log-transformed total healthcare expenditures. Thus, if older adults with ACO were to have similar characteristics as those with NANC, the difference in log-transformed dollars would reduce to 8.99. Of the 1.399 unit difference, 1.081 units (76.98% of total explained portion) were explained by the differences in characteristics. The number of unique medications (0.833 units, 77.30% of total explained portion) and fragmented care (16.08 units, 14.93% of total explained portion) were mainly explained the differences.
Table 2. Post-regression decomposition analyses older (age > 65 years) medicare current beneficiary survey, 2006–2013 decomposition of log total healthcare expenditures (2013US$) by Asthma/COPD categories by using blinder Oaxaca liner decomposition analysis for survey data using pooled regression weights.
Of the total difference in log-transformed costs (1.003) among COPD only and NANC group, 0.594 units (or 59.21%) was explained by differences in the patient-level characteristics between the two groups. Similarly, of the total difference in log-transformed expenditures (0.735) among asthma only and NANC group, 0.655 units (89.21%) was explained by differences in characteristics between asthma only and NANC groups. In all these comparisons, number of unique medications, need factors (i.e. number of chronic conditions and number of ADL) and fragmented care were the leading drivers of the excess economic burden.
High OOP spending burden
summarizes the prevalence of high OOP spending burden among the four asthma/COPD groups: 42% for those with ACO, 34% for those with COPD only, and 29% for those with asthma only as compared to 17% among individuals with NANC. In the unadjusted logistic regression models, the odds of high OOP spending burden was significantly higher among individuals with ACO (UOR = 3.51, 95% CI = [2.96, 4.16], p < 0.001), asthma only (UOR = 1.99, 95% CI = [1.68, 2.36], p < 0.001), and COPD only (UOR = 2.40, 95% CI = [2.20, 2.61], p < 0.001) as compared to the NANC group (). In the adjusted logistic regression models, the association remained significant. The odds of high OOP spending burden was significantly higher among individuals with ACO (AOR = 3.51, 95% CI = [2.96, 4.16], p < 0.001) and COPD only (AOR = 3.51, 95% CI = [2.96, 4.16], p < 0.001) as compared to the NANC group.
Based on non-linear decomposition analysis, we found that of the 23.53 percentage point difference in high OOP burden, 19.59 percentage points were explained by the differences in the characteristics between the ACO and the NANC group (). Thus, if older adults with ACO were to have similar characteristics as those of the NANC group, the difference in OOP burden would be reduced to 18.5 percentage points. Of this total difference, 13.18 percentage points (or 67.29% of total explained portion) was explained by the number of unique medications. Similar findings were observed when the asthma only and the COPD only groups were compared to the NANC group.
Discussion
This study examined the excess economic burden associated with ACO among older adults in the US, using multiple years of a nationally representative sample of Medicare beneficiaries. In terms of projected total healthcare expenditures, nearly two billion dollars (2013USD) was spent on the healthcare of older community-dwelling adults with ACO (weighted number of ACO adults in 2013 = 42,984 multiplied by the average per-capita cost $45,532). In terms of the excess economic burden, individuals with ACO had almost four, two, and 1.5 times higher expenditures compared to individuals with NANC, asthma only, and COPD only, respectively. The excess expenditures associated with ACO is not surprising because studies have documented increasing expenditures with increasing number of chronic conditions [Citation33]. While healthcare utilization and reasoning for expenditure was not directly reviewed in this study, a prior study of 17,088 COPD patients in Taiwan reported that ACO patients experienced almost twice as many acute respiratory events (e.g. acute respiratory failure, pneumonia, and acute exacerbation) than did the rest of the COPD cohort [Citation3]. This higher event rates undoubtedly lead to higher healthcare resource utilization and overall higher direct costs.
In this study, those with ACO had higher odds of high OOP spending burden compared to all other groups in both unadjusted and adjusted models. This high burden could be due to cost-sharing of Medicare-covered services, including prescription drugs and payments for non-covered services by Medicare. OOP burden may be particularly high among individuals with ACO because of historically high cost-sharing of inhaler medications [Citation34]. Individuals with ACO may also have greater need for some of the services not covered by Medicare compared to NANC as they are higher risk of these conditions. For example, individuals with ACO have significantly higher odds (AOR = 1.82, 95% CI = [1.59, 2.08], p < 0.001) of removing all teeth compared to NANC [Citation35], suggesting greater spending on oral healthcare by patients. Medicare reform proposals that focus on value-based healthcare that balance the value of health services to the OOP spending burden of patients (vs. quantity of care) may reduce the excess economic burden of patients.
Our decomposition analysis suggested that patient-level characteristics such as higher number of co-existing chronic conditions and related characteristics (i.e. higher number of unique medications and higher levels of fragmented care) were the leading drivers of the excess economic burden among ACO patients. For example, receiving care from several different providers often results in gaps in communication between providers which can lead to suboptimal care and polypharmacy [Citation27, Citation36]. Prior studies suggest that more fragmented care is associated with more diagnostic tests, more low-value care, and lower patient satisfaction [Citation37–39]. Previous studies further suggest the associations of fragmented care and higher number of emergency department (ED) visits, higher hospitalization rates, and higher expenditures [Citation30, Citation40].
Taken together, our study findings highlight the need for a “holistic management” of older adults with chronic respiratory conditions, specifically ACO, asthma, and COPD. Given that those with chronic respiratory conditions may need to see multiple providers and have a high medication burden, the risks of fragmented care and drug-disease and drug-drug interactions are very high. These factors often lead to greater economic burden, as evidenced by our study. Although the CMS began reimbursing providers for providing coordinated care for those with multiple conditions in 2015 [Citation41], it remains to be seen whether such fiscal incentives for care coordination have resulted in less fragmented care and reduced healthcare expenditures. In this context, patients with chronic respiratory conditions (ACO, asthma, and COPD) may need to be managed in a patient-centered medical home model which focuses care that is “comprehensive, team-based, coordinated, accessible, and focused on quality and safety.” [Citation42]. As documented in published literature, pharmacists can play an important role in medical homes by reducing unnecessary medications, counseling patients and/or caregivers, reviewing medication regimens and inhaler techniques, and completing adherence assessments [Citation43–45]. Such management may improve not only outcomes but also lower the economic burden of patients, payers, and health systems.
As with most studies, this study also had some limitations. The first limitation was the lack of availability of data from recent years. Notwithstanding this limitation, we used the most recently available data of a nationally representative large sample of elderly Medicare beneficiaries. Another limitation was the lack of information on the onset and severity of diseases, rates of uncontrolled disease states, spirometry results. To overcome this, we used ADL status as a proxy of overall severity of diseases. Furthermore, the data source does not provide the cost of medications individually. Lastly, the findings of the current study cannot be generalizable to all older adults in the US, although it is generalizable to the majority of older adults (community-dwelling Medicare beneficiaries enrolled in fee-for-service Part A and B).
Conclusion
This study is the first to document the excess economic burden of ACO among elderly Medicare beneficiaries. ACO among elderly Medicare beneficiaries was associated with substantial total healthcare expenditures, third-party payers’ expenditure and high OOP spending burden, even after adjusting with a comprehensive list of variables. Post regression decomposition analyses revealed that the challenges associated with multiple chronic conditions, specifically use of multiple medications and high levels of fragmented care were the leading drivers of the excess economic burden. Individual, policy, and program interventions that facilitate coordination of care may reduce the excess economic burden of older adults with chronic respiratory conditions, specifically ACO, asthma, or COPD.
Declaration of interest
No potential conflict of interest was reported by the author(s).
References
- Fragoso CAV, Murphy TE, Agogo GO, et al. Asthma–COPD overlap syndrome in the US: a prospective population-based analysis of patient-reported outcomes and health care utilization. COPD. 2017; 12:517–527. DOI:10.2147/COPD.S121223
- Hosseini M, Almasi-Hashiani A, Sepidarkish M, et al. Global prevalence of asthma-COPD overlap (ACO) in the general population: A systematic review and meta-analysis. Respir Res. 2019;20(1):229. DOI:10.1186/s12931-019-1198-4
- Chung WS, Lin CL, Kao CH. Comparison of acute respiratory events between asthma-COPD overlap syndrome and COPD patients: a population-based cohort study . Medicine (Baltimore). 2015;94(17):e755. DOI:10.1097/MD.0000000000000755
- Menezes AMB, De Oca MM, Pérez-Padilla R, et al. Increased risk of exacerbation and hospitalization in subjects with an overlap phenotype : COPD-Asthma. Chest. 2014;145(2):297–304. DOI:10.1378/chest.13-0622
- Kumbhare S, Pleasants R, Ohar JA, et al. Characteristics and prevalence of asthma/chronic obstructive pulmonary disease overlap in the United States. Annals ATS. 2016;13(6):803–810. DOI:10.1513/AnnalsATS.201508-554OC
- Blanchette CM, Gutierrez B, Ory C, et al. Economic burden in direct costs of concomitant chronic obstructive pulmonary disease and asthma in a Medicare Advantage population. JMCP. 2008;14(2):176–185. DOI:10.18553/jmcp.2008.14.2.176
- Gerhardsson DVM, Andersson M, Kern DM, et al. Asthma and chronic obstructive pulmonary disease overlap syndrome: Doubled costs compared with patients with asthma alone. Value Heal. 2015;18(6):759–766. DOI:10.1016/j.jval.2015.04.010
- Carroll A. The “iron triangle” of health care: access, cost, and quality. JAMA Heal Forum. American Medical Association; 2012. Available from: https://jamanetwork.com/channels/health-forum/fullarticle/2760240
- Bates DW, Saria S, Ohno-Machado L, et al. Big data in health care: using analytics to identify and manage high-risk and high-cost patients. Health Aff (Millwood). 2014;33(7):1123–1131. DOI:10.1377/hlthaff.2014.0041
- Stone PW, Glied SA, McNair PD, et al. CMS changes in reimbursement for HAIs: setting a research agenda. Med Care. 2010;48(5):433–439. DOI:10.1097/MLR.0b013e3181d5fb3f
- Shih T, Chen LM, Nallamothu BK. Will bundled payments change health care? Examining the evidence thus far in cardiovascular care. Circulation. 2015;131(24):2151–2158. DOI:10.1161/CIRCULATIONAHA.114.010393
- Frick KD, Kymes SM. The calculation and use of economic burden data. Br J Ophthalmol. 2006;90(3):255–257. DOI:10.1136/bjo.2005.084848
- Rabarison KM, Bish CL, Massoudi MS, et al. Economic evaluation enhances public health decision making. Front Public Heal. 2015;3:164.
- Reschovsky JD, Hadley J, Saiontz-Martinez CB, et al. Following the money: factors associated with the cost of treating high-cost Medicare beneficiaries. Health Serv Res. 2011;46(4):997–1021. DOI:10.1111/j.1475-6773.2011.01242.x
- Dieleman JL, Squires E, Bui AL, et al. Factors associated with increases in US health care spending, 1996-2013. JAMA. 2017;318(17):1668–1678. DOI:10.1001/jama.2017.15927
- Ajmera M, Raval AD, Shen C, et al. Explaining the increased health care expenditures associated with gastroesophageal reflux disease among elderly Medicare beneficiaries with chronic obstructive pulmonary disease: a cost-decomposition analysis. Int J Chron Obstruct Pulmon Dis. 2014;9:339–348.
- Adler GS. A profile of the medicare current beneficiary survey. Health Care Financ Rev. 1994;15(4):153–163.
- Eppig FJ, Chulis GS. Matching MCBS (Medicare Current Beneficiary Survey) and medicare data: the best of both worlds. Health Care Financ Rev. 1997;18(3):211–229.
- US Bureau of labor statistics. Measuring Price Change in the CPI: Medical care [Internet]. Div Consum Prices Price Indexes. ivision of Consumer Prices and Price Indexes; 2020. Available from: https://www.bls.gov/cpi/factsheets/medical-care.htm.
- Crystal S, Johnson R, Harman J, et al. Out-of-pocket health care costs among older Americans. J Gerontol Ser B. 2000;55:S51–S62.
- Baird KE. Recent trends in the probability of high out-of-pocket medical expenses in the United States. SAGE Open Med. 2016;4:2050312116660329. DOI:10.1177/2050312116660329
- Van Dyke MK, Hinds D, Dickinson H, et al. Evaluation of ICD-9 to ICD-10 conversion on estimates of asthma and COPD in a US commercial claims database. C37 Optim ASTHMA CARE aCROSS Divers PATIENTS. 2018:A4868–A4868.
- Wurst KE, St. Laurent S, Hinds D, et al. Disease burden of patients with asthma/COPD overlap in a US claims database: Impact of ICD-9 coding-based definitions. COPD J Chronic Obstr Pulm Dis. 2017;14(2):200–209. DOI:10.1080/15412555.2016.1257598
- Nili M, Adelman M, Madhavan SS, et al. Asthma-chronic obstructive pulmonary disease overlap and cost-related medication non-adherence among older adults in the United States. J Asthma. 2020:1–14. DOI:10.1080/02770903.2020.1868497
- Shantakumar S, Pwu R-F, D'Silva L, et al. Burden of asthma and COPD overlap (ACO) in Taiwan: A nationwide population-based study. BMC Pulm Med. 2018;18(1):16. DOI:10.1186/s12890-017-0571-7
- Kao Y-H, Tseng T-S, Ng Y-Y, et al. Association between continuity of care and emergency department visits and hospitalization in senior adults with asthma-COPD overlap. Health Policy (New York). 2019;123(2):222–228. DOI:10.1016/j.healthpol.2018.11.005
- Kern LM, Seirup JK, Rajan M, et al. Fragmented ambulatory care and subsequent healthcare utilization among Medicare beneficiaries. Am J Manag Care. 2018;24:e278–e284.
- Gupta S, McColl MA, Guilcher SJ, et al. Cost-related nonadherence to prescription medications in Canada: A scoping review. Patient Prefer Adherence. 2018;12:1699–1715. DOI:10.2147/PPA.S170417
- Andersen RM. Revisiting the behavioral model and access to medical care: does it matter? J Health Soc Behav. 1995;36(1):1–10.
- Liu CW, Einstadter D, Cebul RD. Care fragmentation and emergency department use among complex patients with diabetes. Am J Manag Care. 2010;16(6):413–420.
- Liu S, Yeung PC. Measuring fragmentation of ambulatory care in a tripartite healthcare system. BMC Health Serv Res. 2013;13:176. DOI:10.1186/1472-6963-13-176
- Fairlie RW. An extension of the Blinder-Oaxaca decomposition technique to logit and probit models. JEM. 2005;30(4):305–316. DOI:10.3233/JEM-2005-0259
- Krishnan JA, Nibber A, Chisholm A, et al. Prevalence and characteristics of asthma–chronic obstructive pulmonary disease overlap in routine primary care practices. Annals ATS. 2019;16(9):1143–1150. DOI:10.1513/AnnalsATS.201809-607OC
- Tseng C-W, Yazdany J, Dudley RA, et al. Medicare Part D plans' coverage and cost-sharing for acute rescue and preventive inhalers for chronic obstructive pulmonary disease. JAMA Intern Med. 2017;177(4):585–588. DOI:10.1001/jamainternmed.2016.9386
- Dwibedi N, Wiener RC, Findley PA, et al. Asthma, chronic obstructive pulmonary disease, tooth loss, and edentulism among adults in the United States: 2016 Behavioral Risk Factor Surveillance System survey. J Am Dent Assoc. 2019;51(10):735–744.e1. DOI:10.1016/j.adaj.2019.07.032
- O'Malley AS, Reschovsky JD. Referral and consultation communication between primary care and specialist physicians: finding common ground. Arch Intern Med. 2011;171(1):56–65. DOI:10.1001/archinternmed.2010.480
- Kern LM, Seirup JK, Casalino LP, et al. Healthcare fragmentation and the frequency of radiology and other diagnostic tests: a cross-sectional study. J Gen Intern Med. 2017;32(2):175–181. DOI:10.1007/s11606-016-3883-z
- Romano MJ, Segal JB, Pollack CE. The association between continuity of care and the overuse of medical procedures. JAMA Intern Med. 2015;175(7):1148–1154. DOI:10.1001/jamainternmed.2015.1340
- Van Walraven C, Oake N, Jennings A, et al. The association between continuity of care and outcomes: a systematic and critical review. J Eval Clin Pract. 2010;16(5):947–956. DOI:10.1111/j.1365-2753.2009.01235.x
- Hussey PS, Schneider EC, Rudin RS, et al. Continuity and the costs of care for chronic disease. JAMA Intern Med. 2014;174(5):742–748. DOI:10.1001/jamainternmed.2014.245
- Department of Health and Human Services. Connected care toolkit: chronic care management resources for health care professionals and communities. Available from: https://www.cms.gov/About-CMS/Agency-Information/OMH/Downloads/connected-hcptoolkit.pdf
- Ortiz G, Fromer L. Patient-centered medical home in chronic obstructive pulmonary disease. J Multidiscip Healthc. 2011;4:357–365. DOI:10.2147/JMDH.S22811
- Elliott RA, O'Callaghan C, Paul E, et al. Impact of an intervention to reduce medication regimen complexity for older hospital inpatients. Int J Clin Pharm. 2013;35(2):217–224. DOI:10.1007/s11096-012-9730-3
- Muir AJ, Sanders LL, Wilkinson WE, et al. Reducing medication regimen complexity: a controlled trial. J Gen Intern Med. 2001;16(2):77–82. DOI:10.1046/j.1525-1497.2001.016002077.x
- Newsome AS, Smith SE, Olney WJ, et al. Medication regimen complexity is associated with pharmacist interventions and drug-drug interactions: A use of the novel MRC-ICU scoring tool. J Am Coll Clin Pharm. 2020;3(1):47–56. DOI:10.1002/jac5.1146
Appendix 1
Diagnosis ICD-9-CM Codes for Asthma and COPD
Asthma: 493.0, 493.1, 493.2, 493.8, 493.9
COPD: 491.1, 491.2, 491.8, 491.9, 492, 492.8
Appendix 2
Characteristics of elderly community-dwelling fee-for-service medicare beneficiaries