
Abstract
Pulmonary events (PEs) associated with alpha-1 antitrypsin deficiency (AATD) can have a severe clinical course and increase healthcare resource use (HRU). However, AATD-associated HRU and healthcare costs have not been extensively described. This study describes and compares real-world HRU and healthcare costs among US patients with severe (requiring hospitalization after AATD-related PE) versus nonsevere AATD clinical course. Administrative healthcare claims for patients with a second primary AATD diagnosis between 6/1/2008 and 12/31/2017 were analyzed from 2 databases (requiring continuous enrollment 6 months preceding diagnosis). Patient baseline characteristics and AATD-associated PE incidence rates, HRU, and healthcare costs during follow-up were compared in patients with severe versus nonsevere AATD. Of 5109 patients with a second AATD diagnosis, 2674 (severe, n = 711 [26.6%]; nonsevere, n = 1963 [73.4%]) had ≥1 AATD-associated PE. PE incidence per 100 person-years was higher in patients with severe versus nonsevere AATD. Annual incidences (mean ± SD) of emergency department (1.2 ± 5.7 vs. 0.4 ± 1.2), inpatient (1.3 ± 2.5 vs. 0.1 ± 0.5), and outpatient (10.3 ± 15.9 vs. 5.7 ± 13.2) visits were higher in patients with severe versus nonsevere AATD. Median (interquartile range) annual costs were also higher for patients with severe versus nonsevere AATD for emergency department ($185 [$0–$1665] vs. $0 [$0–$264]), inpatient ($16,038 [$2968–$70,941] vs. $0 [$0–$0]), and outpatient ($2663 [$412–$10,277] vs. $1114 [$134–$4195]) visits. Higher percentages of patients with severe AATD were prescribed augmentation therapy, antibiotics, or corticosteroids. These findings suggest that patients with severe AATD have higher incidence of AATD-associated PEs, as well as higher HRU and healthcare costs.
Introduction
Alpha-1 antitrypsin deficiency (AATD) is a genetic disorder characterized by reduced concentrations and/or functional levels of serum alpha-1 antitrypsin (AAT) protein [Citation1]. Approximately 0.6 million individuals in the United States have mutations in the gene responsible for AATD [Citation2]. Direct population screening studies in the United States estimate that the prevalence of AATD with severe PI*ZZ phenotype ranges from approximately 1 in 3000 to 1 in 5000 [Citation3, Citation4]. Based on the 2010 population of the United States of approximately 309 million [Citation5], an estimated 62,000 to 103,000 individuals have AATD with severe PI*ZZ phenotype. However, <10% of these individuals have been diagnosed with AATD [Citation6, Citation7], and the mean diagnostic delay between symptom onset and diagnosis has been estimated to be 5.6 years [Citation8], further highlighting that recognition and diagnosis of AATD are unmet needs.
Pulmonary events (PEs) are among the most frequently reported clinical manifestations of AATD [Citation9, Citation10], which often include chronic obstructive pulmonary disease (COPD), emphysema, bronchiectasis, chronic bronchitis, and pulmonary exacerbations [Citation8, Citation11–14]. Between 40% and 92% of individuals diagnosed with AATD experience pulmonary exacerbations, with the duration of the exacerbations ranging from 2 days to >5 weeks [Citation12–14].
A severe clinical course of AATD can lead to increased healthcare resource use (HRU) and healthcare costs [Citation15–17]. In a retrospective study examining HRU among Medicare beneficiaries, higher percentages of patients diagnosed with AATD compared with COPD visited the emergency room (ER; 58.4% vs. 42.5%) and had inpatient visits (58.0% vs. 19.5%) [Citation17]. Additionally, total healthcare costs were higher for AATD than COPD by $27,674 per patient [Citation17].
Emerging evidence suggests that augmentation therapy slows the progression of emphysema and can be disease-modifying [Citation18]. The American Thoracic Society/European Respiratory Society and the Chronic Obstructive Pulmonary Disease Foundation recommend augmentation therapy with α1-protease inhibitors (PIs) or nonspecific therapy for the treatment of some individuals with AATD-associated pulmonary issues [Citation19, Citation20]. Published reports indicate that roughly 13% of patients with AATD receive augmentation therapy [Citation16, Citation17], signaling that it may be underutilized.
Together, the delayed and low rates of AATD diagnosis [Citation6, Citation7, Citation21, Citation22], high HRU burden of AATD [Citation15–17], and low utilization of augmentation therapy [Citation16, Citation17] emphasize the need for improved diagnosis and treatment of AATD. Such improvements may mitigate the burden of AATD on HRU and healthcare costs. The primary aim of this study was to compare the characteristics of patients with a severe versus nonsevere AATD clinical course to better understand the profile of patients diagnosed with AATD with respect to disease severity. The second aim was to compare HRU and healthcare costs among patients with a severe and nonsevere AATD clinical course to describe the real-world burden of AATD.
Methods
Study design
This retrospective cohort study identified patients from the IBM® MarketScan® Commercial Database and Medicare Supplemental Database (IBM Watson Health; Ann Arbor, MI), formerly the Truven Health MarketScan® databases, using medical and prescription claims data from January 1, 2008, to December 31, 2017. The research protocol did not require approval from an institutional review board or ethics committee because the study used a commercial database with de-identified data to maintain confidentiality at all times.
Population
To be included in the study, patients were required to have a primary AATD diagnosis (based on International Classification of Diseases, Ninth Revision, Clinical Modification [ICD-9-CM] code 273.4 or ICD-10-CM code E88.01) documented on ≥2 claims. Patients were also required to have continuous enrollment in a health plan (commercial/private insurance, Medicare, or both) with both medical and pharmacy benefits during the baseline period (). The baseline period was defined as the 6-month period of continuous enrollment with both medical and pharmacy benefits immediately preceding (but not including) the index date. The index date was defined as the date of the second claim with a documented AATD diagnosis. The follow-up period was defined as the interval starting on the index date and ending at the earliest of loss of continuous coverage, loss to follow-up (end of data), or the end of the study period.
Figure 1. Study timeline and periods (A) and patient disposition (B). AATD = alpha-1 antitrypsin deficiency; ICD-9-CM = International Classification of Diseases, Ninth revision, Clinical Modification; ICD-10-CM = International Classification of Diseases, tenth revision, Clinical Modification; IP = inpatient; PE = pulmonary event. *Patients had continuous enrollment in a health plan with both medical and pharmacy benefits during the 6-month baseline period, which preceded but did not include the index date. †The index date was the date of the second documented diagnosis of alpha-1 antitrypsin deficiency. ‡The follow-up period was the interval starting on the index date and ending on the earliest of loss of continuous coverage, loss to follow-up (end of data), or the end of the study period. §Formerly the Truven Health MarketScan® databases.
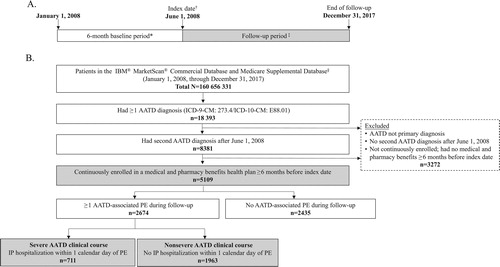
Patients identified as having met study inclusion criteria for a primary AATD diagnosis regardless of having an AATD-associated PE (the overall cohort) were categorized based on severity of AATD-associated PEs. Patients with severe AATD-related PEs (the severe AATD clinical course cohort) were defined as those with ≥1 claim for an AATD-associated PE during the follow-up period with hospitalization occurring within 1 calendar day of the event. Patients with nonsevere AATD–related PEs (the nonsevere AATD clinical course cohort) were defined as those with ≥1 claim for an AATD-associated PE during the follow-up period not associated with hospitalization within 1 calendar day of the event.
Measures
Population measures
Patient demographic and clinical characteristics, healthcare payer and plan type, and the season of the first PE of interest (emphysema, COPD, chronic bronchitis, bronchiectasis, exacerbation event) during the baseline period were recorded. Clinical characteristics included Charlson Comorbidity Index (CCI) scores, AATD-related comorbidities (i.e. emphysema, COPD, asthma), and the number of hospitalizations.
Outcome measures
The primary outcome measure was the annual frequency of severe and nonsevere AATD-associated PEs during the follow-up period. AATD-associated PEs were identified by the presence of ≥1 medical claim with an ICD-9-CM or ICD-10-CM code for bronchiectasis, chronic bronchitis, COPD, emphysema, or exacerbations. Specific ICD-9-CM and ICD-10-CM codes used to identify specific AATD-associated PEs can be found in Table 1, supplementary material.
Treatment patterns during the follow-up period were assessed by examining the use of α1-PI augmentation therapy (hereafter referred to as augmentation therapy), antibiotics, and corticosteroids. The augmentation therapies identified included Glassia® (alpha1-proteinase inhibitor [human]; Baxalta US Inc., Lexington, MA), Aralast™ (alpha1-proteinase inhibitor [human]; Baxter Healthcare Corporation, Westlake Village, CA), Aralast™ NP (alpha1-proteinase inhibitor [human]; Baxter Healthcare Corporation, Westlake Village, CA), Prolastin® (alpha1-proteinase inhibitor [human]; Talecris Biotherapeutics, Inc., Research Triangle Park, NC), Prolastin® C (alpha1-proteinase inhibitor [human]; Grifols Therapeutics LLC, Research Triangle Park, NC), and Zemaira® (alpha1-proteinase inhibitor [human]; CSL Behring LLC, Kankakee, IL). Use of nonspecified agents (i.e. augmentation therapy not specified) was also recorded.
All-cause HRU was examined by evaluating ER visits, outpatient visits, inpatient visits, other visits, total number of inpatient days, and hospital length of stay (LOS). Other visits included visits to any other medical service location to which patients were referred (e.g. hospice; inpatient rehabilitation, psychiatric, or other inpatient facility; long-term care; outpatient rehabilitation, psychiatric, clinic, office, or other outpatient facility; skilled nursing facility; surgical center).
All-cause direct healthcare costs for medical services and pharmacy costs for selected AATD-associated therapies during the follow-up period were identified based on CPT codes and recorded (Table 1, supplementary material). Medical services costs included costs for ER, inpatient, outpatient, and other visits. Pharmacy costs for AATD-related treatment represent the sum of drug prescription and administration costs; costs for over-the-counter medications were not available. Reported costs represent reimbursed amounts from payers to healthcare providers adjusted to 2017 US dollars using the medical component of the Consumer Price Index [Citation23].
Data presentation and analysis
In this descriptive study, no formal hypothesis testing or sample size calculations were performed. Analyses were performed using the Instant Health Data tool (Boston Health Economics, Boston, MA) and SAS®, version 9.4 (SAS Institute, Cary, NC). Patient characteristics, AATD-associated PEs, pharmacotherapy use, all-cause HRU, time to first HRU, and healthcare costs in the overall, severe, and nonsevere cohorts are reported using descriptive statistics.
Patient demographic and baseline clinical characteristics as of the index date were collected. These data are reported as means with standard deviations (SD) for continuous variables and as number (%) for categorical variables.
For assessment of each AATD-associated PE, incidence during the follow-up period was calculated by dividing the total number of events per person by the time in person-years at risk. Person-years at risk were calculated for the period commencing on the index date and ending on the earliest of either loss of continuous coverage, loss to follow-up (end of data), or the end of the study period. For incidence rates, 95% confidence intervals (CI) are presented.
For assessments of treatment, the number and percentage of patients using specified treatments (augmentation therapies, antibiotics, corticosteroids) and the mean ± SD number of prescriptions or injections for each treatment are reported. Changes in treatment for augmentation therapy were identified by dividing the follow-up period into 30-day segments comprising all treatments received at least once during the 30-day period. Treatment segments without an identified treatment were excluded; consecutive segments comprising the same drug were collapsed.
Data for HRU and healthcare costs were collected between the index date and the date ending on the earliest of loss of continuous coverage, loss to follow-up, or end of the study period. For HRU, the mean ± SD numbers of ER, inpatient, outpatient, or other visits are presented. In addition, the median (interquartile range [IQR]) time to first HRU, measured as the number of years between the index date and the date of the first recorded visit, is reported. For healthcare costs, median (IQR) annual costs for ER visits, inpatient visits, outpatient visits, and other visits are reported, as are general medical, pharmacy, and total costs.
Results
Patient disposition and characteristics
Patient disposition is summarized in . Of 160,656,331 patients with claims, the overall cohort included 5109 patients. Of these patients, 2674 had ≥1 AATD-associated PE (711 [26.6%] patients with a severe AATD clinical course; 1963 [73.4%] patients with a nonsevere AATD clinical course). Patient demographics and baseline clinical characteristics are summarized in . Patients with a severe AATD clinical course were older and had higher CCI scores than patients with a nonsevere AATD clinical course (). The baseline frequencies of COPD, emphysema, and hospitalization were higher in patients with a severe versus nonsevere AATD clinical course (). A lower percentage of patients with a severe AATD clinical course was enrolled in a commercial/private plan and a higher percentage was enrolled in a Medicare-only plan (). Small percentages of patients in each AATD severity group (<1%) had both commercial insurance and Medicare. The seasonal pattern of the first AATD-associated PE was comparable between AATD severity groups, with higher percentages of patients reporting the first AATD-associated PE in the fall and winter than in the spring and summer ().
Table 1. Patient characteristics during the baseline perioda.
AATD-associated PEs
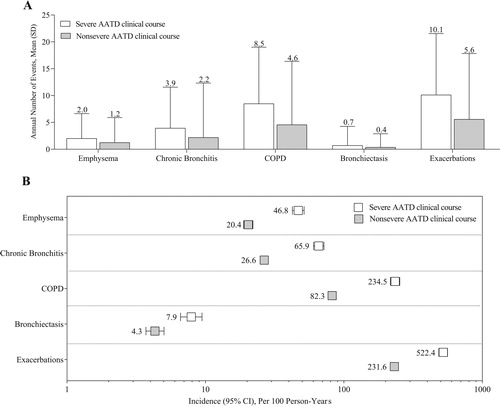
The mean ± SD annual frequencies of AATD-associated PEs in the overall cohort were highest for exacerbations (3.6 ± 9.5) and COPD (2.9 ± 8.9). In patients with a severe AATD clinical course, the mean ± SD annual number of AATD-associated PEs was 1.6 to 1.9 times greater than in patients with a nonsevere AATD clinical course (). In both the severe and nonsevere cohorts, the mean ± SD number of annual AATD-associated PEs was greatest for exacerbations (). The annual number of AATD-associated PEs in patients with a severe and nonsevere AATD clinical course is summarized in Figure 1, supplementary material. In the overall cohort, the incidence (95% CI) per 100 person-years of AATD-associated PEs was greatest for exacerbations (56.6 [54.5–58.7]) and COPD (36.3 [34.8–37.9]). The incidences of AATD-associated PEs among patients with a severe AATD clinical course were 1.8 to 2.8 times greater than in patients with a nonsevere AATD clinical course ().
Figure 2. Annual number (A) and incidence (B) of AATD-associated PEs during the follow-up period. AATD = alpha-1 antitrypsin deficiency; CI = confidence interval; COPD = chronic obstructive pulmonary disease; PE = pulmonary event; SD = standard deviation. Severe AATD clinical course: ≥1 claim for an AATD-associated PE during the follow-up period that was associated with a hospitalization occurring within 1 calendar day of the event. Nonsevere AATD clinical course: ≥1 claim for an AATD-associated PE in the follow-up period with no hospitalization occurring within 1 calendar day of the event. Values reported above the error bars in panel A represent the mean.
AATD treatment
In the overall cohort, 15.1% (772/5109) of patients received augmentation therapy, with the percentage of patients with a severe AATD clinical course receiving augmentation therapy being higher than patients with a nonsevere AATD clinical course (). Higher percentages of patients with a severe versus nonsevere AATD clinical course were prescribed Aralast™ NP, Prolastin®, and Prolastin® C (). Similarly, the mean ± SD numbers of prescriptions in patients with a severe AATD clinical course were higher than in patients with a nonsevere AATD clinical course for Aralast™ NP (2.3 times greater), Prolastin® (5.3 times greater), and Prolastin® C (2.2 times greater) (). Data on augmentation treatment changes were available for 101 patients with a severe AATD clinical course and 164 patients with a nonsevere AATD clinical course. Most often, only a single augmentation therapy was prescribed (severe, 98/101 [97.0%]; nonsevere, 156/164 [95.1]). Only 11 patients (severe, 3/101 [3.0%]; nonsevere, 8/164 [4.9%]) had recorded therapy switches.
Table 2. Use of augmentation therapy, antibiotics, and corticosteroids during the follow-up periodTable Footnotea.
Antibiotic and corticosteroid use
In the overall cohort, 64.8% (3310/5109) of patients used antibiotics and 60.9% (3111/5109) used corticosteroids during the follow-up period. During the follow-up period, higher percentages of patients with a severe AATD clinical course used antibiotics or corticosteroids (). The mean ± SD numbers of antibiotic prescriptions per patient and injections per patient were 1.9 and 8 times greater, respectively, in patients with a severe versus nonsevere AATD clinical course (). In addition, the mean ± SD number of prescriptions for corticosteroids was higher in patients with a severe AATD clinical course than in patients with a nonsevere AATD clinical course (inhaled, 1.4 times greater; injectable, 1.6 times greater), as were the mean ± SD number of corticosteroid injections (2.4 times greater) ().
Healthcare resource use and costs
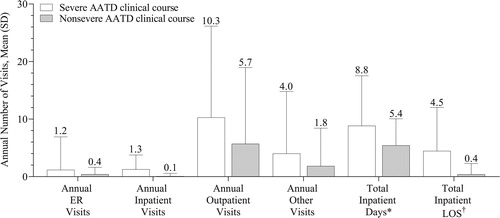
In the overall cohort, the mean ± SD annual number of visits was 0.5 ± 2.4 for ER visits, 0.6 ± 2.7 for inpatient visits, 6.4 ± 12.1 for outpatient visits, and 2.0 ± 7.3 other visits. The mean number of annual ER, inpatient, outpatient, and other visits was 1.8 to 16 times greater among patients with a severe AATD clinical course than a nonsevere AATD clinical course. Total inpatient days were 1.6 times greater and total inpatient LOS was 11.4 times greater in patients with a severe AATD clinical course versus patients with a nonsevere AATD clinical course (). The time from diagnosis to resource use was shorter in those with a severe versus nonsevere AATD clinical course during the follow-up period. The median (IQR range) times to first HRU during the follow-up period in patients with severe and nonsevere AATD clinical course, respectively, were 0.5 (0.2–1.1) and 0.8 (0.3–1.9) years for ER visits, 0.4 (0.1–1.0) and 1.1 (0.4–2.3) years for inpatient visits, 0.1 (0.0–0.3) and 0.2 (0.1–0.6) years for outpatient visits, and 0.0 (0.0–0.0) and 0.0 (0.0–0.1) years for other visits.
Figure 3. Health resource use during the follow-up period. AATD = alpha-1 antitrypsin deficiency; ER = emergency room; LOS = length of stay; PE = pulmonary event; SD = standard deviation. Severe AATD clinical course: ≥1 claim for an AATD-associated PE during the follow-up period that was associated with a hospitalization occurring within 1 calendar day of the event. Nonsevere AATD clinical course: ≥1 claim for an AATD-associated PE in the follow-up period with no hospitalization occurring within 1 calendar day of the event. *Data based on rounded values, with all null values changed to 0. †Estimated as the product of the number of inpatient visits × LOS for inpatient hospitalization. Values above the error bars represent the mean.
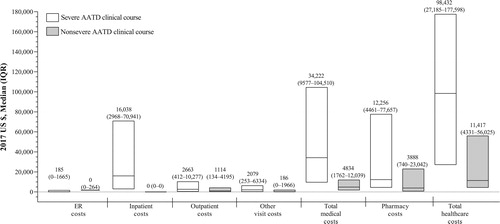
In the overall cohort, the median (IQR range) annual total healthcare costs in 2017 US dollars were $9753 ($3070–$45,266), with the median (IQR range) costs being $4927 ($1569–$16,340) for total medical costs and $2063 ($214–$10,000) for total pharmacy costs. Median annual costs were higher in patients with a severe versus nonsevere AATD clinical course across all cost measures, with median total healthcare costs being 8.6 times greater in patients with a severe AATD clinical course ().
Figure 4. Median (IQR) annual healthcare costs during the follow-up* period. AATD = alpha-1 antitrypsin deficiency; ER = emergency room; IQR = interquartile range. Severe AATD clinical course (≥1 claim for an AATD-associated PE during the follow-up period associated with a hospitalization occurring within 1 calendar day of the event). Nonsevere AATD clinical course (≥1 claim for an AATD-associated PE in the follow-up period not associated with hospitalization within 1 calendar day of the event). The upper and lower limits of each bar represent the 75th and 25th percentiles; the line within each box represents the median. *The follow-up period was the interval starting on the index date and ending on the earliest of loss of continuous coverage, loss to follow-up (end of data), or the end of the study period.
Discussion
Although there are limited data describing the burden of AATD in terms of HRU and healthcare costs [Citation24], findings to date indicate that AATD is associated with high rates of HRU and with high healthcare costs. However, to the best of our knowledge, there are no published studies describing HRU and healthcare costs in patients with a severe versus nonsevere AATD clinical course. In support of previous findings, this study found that patients with AATD had frequent HRU and high healthcare costs. Importantly, patients with a severe AATD clinical course had approximately 2 to 16 times greater annual HRU, shorter times to HRU, and approximately 9 times greater total healthcare costs. Patients with a severe AATD clinical course also had a more severe clinical profile at baseline, as evidenced by higher CCI scores, higher frequencies of COPD and emphysema, and more hospitalizations compared with patients with a nonsevere AATD clinical course, and continued to exhibit a more severe clinical profile during the follow-up period, as evidenced by approximately 2 to 3 times greater incidence rates of AATD-associated PEs. Importantly, the observed differences in clinical profile, HRU, and healthcare costs would have been more pronounced if patients without AATD-associated PEs were included in the nonsevere group. Finally, greater percentages of patients with a severe AATD clinical course utilized augmentation therapies and nonspecific therapies (antibiotics and corticosteroids). Taken together, these findings indicate that a severe AATD clinical course is associated with increased use of healthcare resources.
A previous study in which AATD severity was defined by clinical measures observed increased PEs in patients with severe disease during baseline and follow-up periods [Citation24]. In a population-based study that used the Information System for the Development of Research in Primary Care database of Catalonia, higher percentages of patients with severe AATD (i.e. those with AAT levels <50 mg/dL) had COPD and emphysema during the study period and at a 6-month follow-up compared with patients with intermediate AATD. In our study, the frequency at baseline and the incidence during follow-up of emphysema was higher than any other AATD-associated PE. This observation supports other published studies that report that 40% to 92% of patients with AATD experience pulmonary exacerbations [Citation12–14, Citation25]. Taken together, the data from this study indicate that AATD-associated PEs were not only more severe in patients with a severe AATD clinical course, as evidenced by the need for hospitalization within 1 day of the event, but also more likely to occur in this patient population.
Consistent with other studies that have reported that approximately 13% of patients with AATD receive augmentation therapy [Citation16, Citation17], only 15.1% of patients in the current study had been prescribed augmentation therapy. From a clinical perspective, the low utilization of α1-PI augmentation therapy could be partially accounted for by the multiple medical conditions for which augmentation therapy is not recommended by Sandhaus et al, including having certain genotypes of AATD, having lung disease and currently smoking, having emphysema or bronchiectasis but not airflow obstruction, being treated for liver disease due to AATD, having undergone liver transplantation, and the presence of liver disease [Citation20]. From an economic perspective, the cost of augmentation therapy is high, with 1 report indicating that the difference in annual costs between recipients and nonrecipients of augmentation therapy exceeds $100,000 in the United States; 75% of that cost difference is attributable to augmentation therapy [Citation16]. It is noteworthy, however, that a higher percentage of patients with a severe AATD clinical course received augmentation therapy. These findings support the results of a population-based analysis from a Spanish AATD registry showing that a higher percentage of patients with AATD who received augmentation therapy had AATD-associated COPD and emphysema compared with patients who did not receive augmentation therapy [Citation25]. Taken together, this suggests augmentation therapy is considered more often after patients have progressed to a more severe clinical course. Given that the current data suggest that a more severe clinical course is associated with increased HRU and healthcare costs, it seems prudent for healthcare providers to consider initiating augmentation therapy earlier in those patients who meet current treatment guidelines in an attempt to slow disease progression and possibly mitigate HRU and healthcare costs.
In further regard to treatment patterns, a majority of patients received antibiotics or corticosteroids during the follow-up period, with these nonspecific agents being prescribed more frequently to patients with a severe AATD clinical course. These real-world data suggest that corticosteroids and antibiotics are prescribed as recommended to treat bronchial inflammation, bronchitis, and upper respiratory tract infections in patients with AATD [Citation19].
Based on the available literature on AATD and HRU, this may be the first study to assess HRU and healthcare costs using an HRU-based proxy of AATD disease severity. In this study, patients with a severe AATD clinical course had more healthcare visits, more inpatient days, and longer inpatient LOS. Consequently, all related healthcare costs were higher in patients with a severe versus nonsevere AATD clinical course. Furthermore, the median time to first HRU among patients with a severe AATD clinical course was shorter than in patients with a nonsevere AATD clinical course.
In recognition of the limitations of our proxy measure of disease severity, we assessed the relevant literature for comparisons of the outcomes we note herein with those previously reported among studies that utilized lab or genotypic-based measures of disease severity. Consistent with our findings, a survey comparing healthcare costs among patients with AATD having the severe PI*ZZ phenotype, which is associated with the greatest deficiencies in AAT levels (i.e. most severe disease) [Citation26], with those with the less severe non-PI*ZZ phenotype reported that annual healthcare costs with the PI*ZZ phenotype were higher [Citation27]. Previously published reports have also compared HRU and costs for treating AATD with other obstructive lung diseases, such as COPD, asthma, and emphysema, [Citation15, Citation17, Citation28], or between AATD patient cohorts that are, or are not being treated with augmentation therapy [Citation16, Citation28]. Two such studies reported that HRU in patients with AATD were higher than in those of age- and sex-matched groups with other obstructive lung diseases [Citation15, Citation17]. Furthermore, total healthcare costs per patient were significantly greater in patients with AATD compared with patients with COPD [Citation17]. In a third study, patients diagnosed with AATD were reported to have twice as many outpatient visits compared with patients diagnosed with COPD not concurrent with AATD, but fewer hospitalizations and shorter LOSs for inpatient services [Citation28]. In this same study, patients with AATD receiving versus not receiving augmentation therapy visited general practitioners or specialists more often [Citation28]. In terms of healthcare costs, 1 study reported that total annual healthcare costs were higher for recipients versus nonrecipients of augmentation therapy, with trends toward increased costs seen in most assessments, except physician and ER visits [Citation16]. In another study, annual outpatient costs were higher and inpatient costs were lower in patients with AATD receiving versus not receiving augmentation therapy [Citation28]. Importantly, although augmentation therapy use has been reported to increase healthcare costs [Citation16, Citation28], economic modeling studies indicate that augmentation therapy is a cost-effective option for managing severe AATD [Citation29] and is associated with a significant increase in life expectancy [Citation30].
The current data, along with previously published studies [Citation15–17, Citation27, Citation28], indicate that AATD is associated with a significant burden in terms of HRU and healthcare costs. Given the documented delay, low rates of AATD diagnosis [Citation6, Citation7, Citation21, Citation22], and low utilization of augmentation therapy [Citation16, Citation17], it is important that AATD be recognized, diagnosed, and treated in a more timely fashion because earlier diagnosis and treatment of AATD would be expected to slow its clinical course and reduce its healthcare burden. One way to lower the costs associated with AATD is to employ a comprehensive disease management plan [Citation31]. In a retrospective analysis of patients with AATD enrolled in a program composed of structured disease management education and coordinated augmentation therapy management, patients participating in the comprehensive treatment program experienced 36% fewer exacerbations and had 15% lower costs relative to a comparator cohort over an average follow-up time of approximately 2.3 years [Citation31].
Regarding patient demographics, it was observed that patients with a severe AATD clinical course were older, higher percentages were male and had Medicare as their insurance. At this time, the influence of age, insurance type, or the interaction of age by insurance on the findings of this study is not known. It was also observed that the first AATD-associated PEs were more likely to occur in the fall and winter in both AATD severity groups. This observation is consistent with at least 1 previous report [Citation12]. In an examination of the nature and impact of pulmonary exacerbations in patients with AATD, pulmonary exacerbations were reported to occur most frequently from October through January and least frequently from June to August [Citation12].
Our findings should be considered in light of certain study limitations. First, the severity of AATD was defined with the use of an HRU-based proxy (i.e. hospitalization following a PE). Disease severity was not confirmed using genetic information or objective clinical measures because this information is not available in claims databases. Second, the study did not control for behaviors, comorbidities, or other characteristics that could influence overall health and the frequency of PEs or for outliers and risk factors that could influence estimates of HRU and costs. Third, the study cohort was selected based on specific criteria from an insured population using electronic claims data. Therefore, the findings may not be generalizable to other populations of patients with different distributions of risk factors. Finally, because of the retrospective nature of the analyses, the validity of the findings could be affected by the administrative nature of the data and inaccuracies in recording demographic and clinical characteristics.
Conclusions
This report illustrates that patients with a more severe AATD clinical course are more likely to experience PEs, a finding also observed in published literature in which AATD severity was defined by clinical measures [Citation24]. Annual PE rates were approximately 2 times greater among patients with severe AATD-associated PEs requiring hospitalization than in patients with nonsevere AATD-associated PEs. Consequently, patients with a severe AATD clinical course had approximately 2 to 16 times greater HRU and 9 times greater total annual healthcare costs than patients with a nonsevere AATD clinical course. Only 15% of patients in the current study had been prescribed augmentation therapy, a value consistent with other studies reporting low utilization of augmentation therapy in patients with AATD [Citation16, Citation17]. This low utilization of augmentation therapy could be partially due to the multiple medical conditions for which augmentation therapy is not recommended [Citation20]. The early identification, diagnosis, and treatment of patients at increased risk of AATD-associated PEs may allow clinicians to better tailor a patient’s treatment and potentially alleviate the overall burden of AATD. Future research should focus on ways to identify patients with AATD earlier, especially those at elevated risk of morbidity who might benefit from augmentation therapy early in their disease course.
Declarations of interest
Michael Czorniak and Emily S. Brouwer are employees of Takeda Pharmaceuticals USA and hold Takeda stock. Ernesto Mayen Herrera was an employee of Takeda Pharmaceuticals USA at the time this study was conducted and holds Takeda stock. He is currently an employee of Teva Pharmaceuticals. Corey Joseph was an employee of Takeda Pharmaceuticals USA at the time this study was conducted and holds Takeda stock. Vivek Gandhi is an employee of Takeda Pharmaceuticals USA and is currently working under Safety and Health Value, Statistical and Quantitative Science (SQS).
Supplemental Material
Download PDF (188.2 KB)Acknowledgments
Under the direction of the authors, Srividya Ramachandran, PhD, and Craig Slawecki, PhD, employees of ICON plc (North Wales, PA, USA), provided writing assistance for this manuscript. Takeda Development Center Americas, Inc., Lexington, MA, USA, provided funding to ICON for support in writing and editing this manuscript.
Data availability
This study is based on data from IBM® MarketScan® Commercial Database and Medicare Supplemental Database obtained under license from IBM Watson Health (Ann Arbor, MI).
Correction Statement
This article has been republished with minor changes. These changes do not impact the academic content of the article.
Additional information
Funding
References
- Kohnlein T, Welte T. Alpha-1 antitrypsin deficiency: pathogenesis, clinical presentation, diagnosis, and treatment. Am J Med. 2008;121(1):3–9. DOI:10.1016/j.amjmed.2007.07.025
- de Serres FJ. Worldwide racial and ethnic distribution of alpha1-antitrypsin deficiency: summary of an analysis of published genetic epidemiologic surveys. Chest. 2002;122(5):1818–1829. DOI:10.1378/chest.122.5.1818
- Silverman EK, Miletich JP, Pierce JA, et al. Alpha-1-antitrypsin deficiency. High prevalence in the St. Louis area determined by direct population screening. Am Rev Respir Dis. 1989;140(4):961–966. DOI:10.1164/ajrccm/140.4.961
- O'Brien ML, Buist NR, Murphey WH. Neonatal screening for alpha1-antitrypsin deficiency. J Pediatr. 1978;92(6):1006–1010. DOI:10.1016/S0022-3476(78)80388-6
- Mackun P, Wilson S. Population distribution and change: 2000 to 2010. U.S Census Bureau; 2011.
- Campos M, Shmuels D, Walsh J. Detection of alpha-1 antitrypsin deficiency in the US. Am J Med. 2012;125(7):623–624. DOI:10.1016/j.amjmed.2011.12.014
- Brantly M. Efficient and accurate approaches to the laboratory diagnosis of alpha1-antitrypsin deficiency: the promise of early diagnosis and intervention. Clin Chem. 2006;52(12):2180–2181. DOI:10.1373/clinchem.2006.078907
- Stoller JK, Tomashefski J, Jr, Crystal RG, et al. Mortality in individuals with severe deficiency of alpha1-antitrypsin: findings from the National Heart, Lung, and Blood Institute Registry. Chest. 2005;127(4):1196–1204. DOI:10.1378/chest.127.4.1196
- Kelly E, Greene CM, Carroll TP, et al. Alpha-1 antitrypsin deficiency. Respir Med. 2010;104(6):763–772. DOI:10.1016/j.rmed.2010.01.016
- Stoller JK, Aboussouan LS. Alpha1-antitrypsin deficiency. Lancet. 2005;365(9478):2225–2236. DOI:10.1016/S0140-6736(05)66781-5
- Tomashefski JF, Jr, Crystal RG, Wiedemann HP, et al. The bronchopulmonary pathology of alpha-1 antitrypsin (AAT) deficiency: findings of the Death Review Committee of the National Registry for individuals with severe deficiency of alpha-1 antitrypsin. Hum Pathol. 2004;35(12):1452–1461. DOI:10.1016/j.humpath.2004.08.013
- Needham M, Stockley RA. Exacerbations in α1-antitrypsin deficiency. Eur Respir J. 2005;25(6):992–1000. DOI:10.1183/09031936.05.00074704
- Campos MA, Alazemi S, Zhang G, et al. Exacerbations in subjects with alpha-1 antitrypsin deficiency receiving augmentation therapy. Respir Med. 2009;103(10):1532–1539. DOI:10.1016/j.rmed.2009.04.008
- Parr DG, Guest PG, Reynolds JH, et al. Prevalence and impact of bronchiectasis in alpha1-antitrypsin deficiency. Am J Respir Crit Care Med. 2007;176(12):1215–1221. DOI:10.1164/rccm.200703-489OC
- Greulich T, Nell C, Hohmann D, et al. The prevalence of diagnosed alpha1-antitrypsin deficiency and its comorbidities: results from a large population-based database. Eur Respir J. 2017;49(1):1600154. DOI:10.1183/13993003.00154-2016
- Sieluk J, Levy J, Sandhaus RA, et al. Costs of medical care among augmentation therapy users and non-users with alpha-1 antitrypsin deficiency in the United States. Chronic Obstr Pulm Dis. 2018;6(1):6–16. DOI:10.15326/jcopdf.6.1.2017.0187
- Zacherle E, Noone JM, Runken MC, et al. Health care cost and utilization associated with alpha-1 antitrypsin deficiency among a cohort of Medicare beneficiaries with COPD. Value Health. 2015;18(7):A335–A766.
- Chapman KR, Burdon JG, Piitulainen E, et al. Intravenous augmentation treatment and lung density in severe alpha1 antitrypsin deficiency (RAPID): a randomised, double-blind, placebo-controlled trial. Lancet. 2015;386(9991):360–368. DOI:10.1016/S0140-6736(15)60860-1
- American Thoracic Society, European Respiratory Society. American Thoracic Society/European Respiratory Society statement: standards for the diagnosis and management of individuals with alpha-1 antitrypsin deficiency. Am J Respir Crit Care Med. 2003;168(7):818–900.
- Sandhaus RA, Turino G, Brantly ML, et al. The diagnosis and management of alpha-1 antitrypsin deficiency in the adult. Chronic Obstr Pulm Dis. 2016;3(3):668–682. DOI:10.15326/jcopdf.3.3.2015.0182
- Stoller JK, Smith P, Yang P, et al. Physical and social impact of alpha 1-antitrypsin deficiency: results of a survey. Cleve Clin J Med. 1994;61(6):461–467. DOI:10.3949/ccjm.61.6.461
- Stoller JK, Sandhaus RA, Turino G, et al. Delay in diagnosis of alpha1-antitrypsin deficiency: a continuing problem. Chest. 2005;128(4):1989–1994. DOI:10.1378/chest.128.4.1989
- United States Bureau of Labor Statistics. 2017. Consumer Price Index Detailed Report. Washington, DC: United States Bureau of Labor Statistics; 2017 [cited 2019 July 11]. Available from: https://www.bls.gov/cpi/tables/detailed-reports/home.htm.
- Barrecheguren M, Monteagudo M, Simonet P, et al. Diagnosis of alpha-1 antitrypsin deficiency: a population-based study. Int J Chron Obstruct Pulmon Dis. 2016;11:999–1004.
- Lara B, Blanco I, Martinez MT, et al. Spanish registry of patients with alpha-1 antitrypsin deficiency: database evaluation and population analysis. Arch Bronconeumol. 2017;53(1):13–18. DOI:10.1016/j.arbres.2016.05.003
- McElcaney NG, Stoller JK, Buist AS, et al. Baseline characteristics of enrollees in the National Heart, Lung and Blood Institute Registry of alpha 1-antitrypsin deficiency. Chest. 1997;111(2):394–403. DOI:10.1378/chest.111.2.394
- Mullins CD, Huang X, Merchant S, Alpha One Foundation Research Network Registry Investigators, et al. The direct medical costs of alpha(1)-antitrypsin deficiency. Chest. 2001;119(3):745–752. DOI:10.1378/chest.119.3.745
- Karl FM, Holle R, Bals R, COSYCONET Study Group, et al. Costs and health-related quality of life in alpha-1-antitrypsin deficient COPD patients. Respir Res. 2017;18(1):60. DOI:10.1186/s12931-017-0543-8
- Alkins SA, O’Malley P. Should health-care systems pay for replacement therapy in patients with alpha(1)-antitrypsin deficiency? A critical review and cost-effectiveness analysis. Chest. 2000;117(3):875–880. DOI:10.1378/chest.117.3.875
- Sclar DA, Evans MA, Robison LM, et al. Alpha1-proteinase inhibitor (human) in the treatment of hereditary emphysema secondary to alpha1-antitrypsin deficiency: number and costs of years of life gained. Clin Drug Investig. 2012;32(5):353–360. DOI:10.2165/11631920-000000000-00000
- Campos MA, Runken MC, Davis AM, et al. Impact of a health management program on healthcare outcomes among patients on augmentation therapy for alpha 1-antitrypsin deficiency: an insurance claims analysis. Adv Ther. 2018;35(4):467–481. DOI:10.1007/s12325-018-0690-4