
Abstract
Patients with mild chronic obstructive pulmonary disease (COPD) and lower resting diffusing capacity for carbon monoxide (DLCO) often report troublesome dyspnea during exercise although the mechanisms are not clear. We postulated that in such individuals, exertional dyspnea is linked to relatively high inspiratory neural drive (IND) due, in part, to the effects of reduced ventilatory efficiency. This cross-sectional study included 28 patients with GOLD I COPD stratified into two groups with (n = 15) and without (n = 13) DLCO less than the lower limit of normal (<LLN; Global Lung Function Initiative criteria) and 16 healthy controls. We compared dyspnea (Borg scale), IND (by diaphragm electromyography), ventilatory equivalent for CO2 (V̇E/V̇CO2), and respiratory mechanics during incremental cycle exercise in the three groups. Spirometry and resting lung volumes were similar between COPD groups. During exercise, dyspnea, IND and V̇E/V̇CO2 were higher at equivalent work rates (WR) in the DLCO<LLN group compared with the other two groups (all p < 0.05). In patients with DLCO<LLN, severe respiratory mechanical constraints, indicated by end-inspiratory lung volume of approximately 90% of total lung capacity, occurred at a lower WR than the other two groups (p < 0.05). The dyspnea/IND relationship was similar across groups; therefore, the increased dyspnea at a standardized WR in the low DLCO<LLN group reflected the higher corresponding IND. Higher dyspnea ratings in patients with mild COPD and DLCO<LLN were associated with higher IND and V̇E/V̇CO2 at a given work rate. Higher ventilatory requirements in the DLCO<LLN group accelerated dynamic mechanical abnormalities earlier in exercise, further increasing IND and dyspnea.
Introduction
Patients with mild (Global Initiative for Chronic Obstructive Lung Disease (GOLD) stage I) chronic obstructive pulmonary disease (COPD) can experience significant dyspnea during physical exertion [Citation1,Citation2], leading to reduced physical activity [Citation2], poor quality of life [Citation2], and increased mortality [Citation3]. It is evident that heterogenous pathophysiological abnormalities of the small airways [Citation1] and pulmonary microvasculature [Citation4–6] exist in mild COPD and may be clinically important [Citation6]. Broadly speaking, these abnormalities point to derangements of dynamic respiratory mechanics [Citation7] and/or pulmonary gas exchange [Citation8], which are amplified by exercise and require compensatory responses by the respiratory controller to maintain alveolar ventilation in pace with increasing metabolic demands [Citation9]. While such physiologic adaptations (i.e. increased inspiratory neural drive, IND) are usually successful in maintaining arterial blood gas and acid-base homeostasis during exercise, the cost is often increased perceived dyspnea which can contribute to exercise intolerance [Citation8,Citation9]. In mild COPD, the interrelationships between these diverse physiological abnormalities of pulmonary gas exchange and dynamic mechanics, increased IND, and dyspnea, are poorly understood and are the main focus of this paper.
Small airway loss and dysfunction are the hallmark of mild COPD and can lead to variable expiratory flow limitation, dynamic hyperinflation and prematurely reduced inspiratory reserve volume (IRV) at relatively low minute ventilation (V̇E) during exercise [Citation1,Citation10]. Thus, increased resistive and elastic loading of the inspiratory muscles can lead to compensatory increases in IND (cortical-motor command output) and perceived increased respiratory effort or discomfort [Citation9].
Importantly, the impact of abnormal respiratory mechanics on dyspnea in mild COPD needs to be considered in the context of the prevailing ventilatory demand, which mainly reflects the adaptations of the central respiratory controller to altered chemical stimuli. Key to this is the influence of reduced ventilatory efficiency, which was present in ∼30% of individuals with spirometrically-defined COPD in a Canadian open population sample (n = 715) [Citation11]. Ventilatory efficiency is measured as the ventilatory equivalent for carbon dioxide production (V̇E/V̇CO2) during exercise (specifically as the lowest value which occurs at the anaerobic threshold or soon thereafter), and is considerably higher (i.e. reduced efficiency) in mild COPD patients than in age- and sex-matched healthy controls [Citation1,Citation8,Citation9,Citation12]. High V̇E/V̇CO2 is believed to mainly reflect an increase in chemo-stimulation due to a high physiological dead space (VD) [Citation8], rather than increased central chemosensitivity, per se [Citation8,Citation13]. Thus, high V̇E/V̇CO2 during sub-maximal exercise suggests that regional pulmonary perfusion is diminished relative to alveolar ventilation [Citation8,Citation14,Citation15].
In addition to high exercise V̇E/V̇CO2, reduced single breath DLCO is an indirect marker of microvascular dysfunction (reduced capillary blood volume) and/or capillary destruction in emphysema [Citation16–18]. These related physiological markers have together been closely linked to higher dyspnea ratings in mild COPD [Citation18–20]. However, the relative importance of the effects of microvascular dysfunction (low DLCO, high V̇E/V̇CO2) and mechanical factors (reduced dynamic IRV) in contributing to increased IND and exertional dyspnea in mild COPD has never been determined.
Therefore, the main objective of this study was to compare dyspnea ratings, IND, V̇E/V̇CO2, and dynamic respiratory mechanics in two mild COPD groups with and without a DLCO less than the lower limit of normal (LLN) and a reference control group during exercise. We postulated that: 1) patients with DLCO<LLN would have higher V̇E/V̇CO2, IND and exertional dyspnea intensity than patients with similar resting mechanical abnormalities but with DLCO≥LLN and 2) that the higher IND in the DLCO<LLN group would be explained by higher ventilatory demand prompting an earlier onset of significant mechanical constraints.
Materials and methods
See online supplement for detailed methods.
Participants
This cross-sectional observational study included 28 participants with GOLD stage I COPD (forced expiratory volume in 1 s (FEV1)/forced vital capacity (FVC) ratio < 0.7, and FEV1≥80% of predicted value) [Citation21] and 16 healthy controls who completed pulmonary function tests (PFTs) and a cardiopulmonary exercise test (CPET) with measurements of diaphragm electromyography (EMGdi) and respiratory pressure manometry. They represent a convenience sample recruited from previous Respiratory Investigation Unit and Canadian Respiratory Research Network Studies (Figure E1). Some participants’ data were included in previous studies, but there is no overlap in the analysis or results. Individuals with cardiovascular, metabolic, or other conditions that could contribute to reduced ventilatory efficiency and/or dyspnea were excluded. All protocols were approved by the Queen’s University and Affiliated Teaching Hospitals Research Ethics Board (DMED-1659-13).
Study design and procedures
Medical history and symptom and activity questionnaires [Citation22–24] were completed. Spirometry, body plethysmography, and resting single-breath DLCO were performed using automated equipment following established guidelines [Citation25–27]. Chest computed tomography (CT) scans were qualitatively assessed by two experts (DEO,AFE) for the presence and severity of emphysema when available (19/28 COPD participants) [Citation28]. COPD participants were stratified into two groups by DLCO values ≥ or < the 5th percentile of the LLN (z score=–1.64) using Global Lung Function Initiative (GLI) equations [Citation29]. Symptom-limited, incremental CPET was conducted on an electronically braked cycle ergometer, as previously described [Citation8,Citation9]. Select PFT and CPET measurements were expressed as percent of predicted normal values and/or z scores [Citation29–31].
An esophageal catheter with multi-paired electrodes and dual pressure balloons was inserted nasally and positioned as previously described [Citation9,Citation32–34]. Raw EMGdi signal was sampled continuously and converted to a root mean square (RMS). The RMS EMGdi from tidal breaths was determined manually by selecting peak data between cardiac QRS complexes and averaging values of all breathing during exercise time periods. Maximal EMGdi (EMGdi, max) was measured during serial IC maneuvers (pre-exercise baseline, submaximal and peak exercise). Tidal EMGdi relative to maximum (EMGdi%max) was used as a surrogate measure for IND to the crural diaphragm based on a number of assumptions previously described [Citation32–34].
Esophageal (Pes) and gastric (Pga) pressures were measured continuously via differential pressure transducers. Transdiaphragmatic (Pdi) pressure was calculated as Pga minus Pes. Maximal Pes (Pes,max) and Pdi (Pdi,max) were obtained from serial sniff (pre-exercise baseline and peak) and IC maneuvers, respectively. Tidal Pes relative to maximum Pes (Pes%max) was used as an index of respiratory muscle effort [Citation9]. The breath selection for EMGdi and respiratory pressures occurred in the same 30 s window (first 30 s of second minute of exercise in each work rate period) as all other cardiorespiratory parameters.
Statistical analysis
The sample size was calculated a priori to detect a one Borg-unit difference at 80% power. One-way analysis of variance (ANOVA) with post-hoc Bonferroni corrected t-tests were used for between-group comparisons of demographics, PFT, CPET, neurophysiologic, and sensory variables. Sex as a covariate was included in ANOVA for key outcomes. Prevalence of comorbidities, medication use, and smoking status was compared between groups using Fisher’s exact test. Emphysema severity comparisons (between COPD groups) were analyzed using Fisher’s exact test. Slope of the relationship between dyspnea-to-oxygen uptake (V̇O2), and IND-to-work rate (WR) were determined using linear regression. Hey plots of tidal volume (VT) versus V̇E were used to determine individual VT/V̇E plateaus. Pearson’s correlation tested the associations between variables of interest. Data are presented as mean ± standard deviation (SD) unless otherwise indicated. Statistical significance was set a priori at p < 0.05. Data were analyzed using Statistical Package for Social Sciences (SPPS v. 26)
Results
Study participants
Participant characteristics are summarized in . Fifteen COPD participants had DLCO<LLN and 13 had DLCO≥LLN. The majority of COPD participants (24/28) were symptomatic by respiratory questionnaires (MRC and/or CAT, i.e. GOLD 1B), and COPD participants were more symptomatic than controls. Respiratory medication use and frequency of comorbidities were similar between COPD groups. Emphysema of trace-mild severity was evident on CT scans, and was not different between DLCO groups (p = 0.245).
Table 1. Participant characteristics.
Both COPD groups had a relatively preserved post-bronchodilator FEV1, a similar reduction in forced expiratory flow (25–75% of FVC) compared with control (). Both COPD groups had lower resting IC, and increased FRC and residual volume/total lung capacity (RV/TLC) compared with controls. The TLC-alveolar volume (VA) difference was similar between COPD groups. The carbon monoxide transfer coefficient (KCO) was lower in DLCO<LLN compared with DLCO≥LLN. All controls had a DLCO≥LLN. During CPET, V̇O2peak and WRpeak were lower in both COPD groups compared with controls (). The anaerobic threshold (AT) occurred at a lower V̇O2 in DLCO < LLN (1.04 ± 0.23 L/min) compared with control (1.71 ± 0.70 L/min, p = 0.001), but was not different between DLCO < LLN and DLCO > LLN (1.21 ± 0.31 L/min, p = 0.505), or DLCO > LLN and control (p = 0.073).
Table 2. Resting pulmonary function and select peak exercise measurements.
Neurophysiologic response to exercise
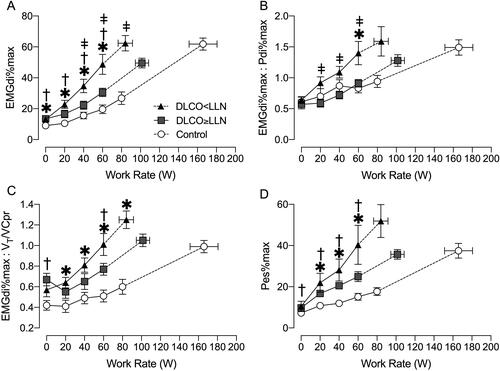
IND for a given WR was consistently elevated in both COPD groups compared with controls and was significantly higher in DLCO<LLN compared with DLCO≥LLN at 40 and 60 W (). The DLCO<LLN group had a greater degree of neuromuscular dissociation (EMGdi%max:Pdi%max, ) at 60 W compared with DLCO≥LLN and control. There was also a greater degree of neuromechanical dissociation (EMGdi%max:VT/VC%predicted, ) in both COPD groups compared with controls at 60 W. Throughout exercise, respiratory muscle effort (Pes%max) was similar in both COPD groups, but elevated compared to controls ().
Figure 1. Diaphragm electromyography (EMGdi) and respiratory pressure manometry responses to incremental exercise. A) ratio of tidal EMGdi to maximum EMGdi (EMGdi%max), B) ratio of EMGdi%max to transdiaphragmatic pressure (Pdi) as a percentage of maximum Pdi (Pdi%max), C) ratio of EMGdi%max to tidal volume (VT) as a percentage of predicted vital capacity (VCpr), and D) esophageal pressure (Pes) as a percentage of maximum Pes (Pes%max) all relative to work rate. Data are presented as mean ± SEM. DLCO: diffusing capacity for carbon monoxide; LLN: Lower limit of normal. *p < 0.05 DLCO<LLN vs. control, ǂp < 0.05 DLCO<LLN vs. DLCO≥LLN, †p < 0.05 DLCO≥LLN vs. control.
Ventilatory response to exercise
During exercise, V̇E was consistently elevated in both COPD groups compared with control (). Additionally, V̇E/V̇CO2 was consistently elevated in the DLCO<LLN compared to control throughout exercise (). At 60 W, V̇E/V̇CO2 was higher in DLCO<LLN compared with DLCO≥LLN (p = 0.0362) and DLCO≥LLN compared with controls (p = 0.0456). V̇E/V̇CO2 nadir (lowest 30 s average) was higher in DLCO<LLN (34 ± 4) compared with DLCO≥LLN (29 ± 4, p = 0.007) and controls (27 ± 3, p = 0.001). The slope of V̇E-to-V̇CO2 was greater in DLCO<LLN (32 ± 4) compared with the DLCO>LLN (28 ± 4, p = 0.0209) and controls (27 ± 3, p < 0.0001). At the AT, V̇E/V̇CO2 was higher in DLCO<LLN (35 ± 4) compared with DLCO>LLN (31 ± 4, p = 0.0348) and control (29 ± 3, p < 0.0001), and was higher in DLCO>LLN compared with control (p < 0.0001).
Figure 2. Ventilatory and gas exchange response to incremental exercise. A) minute ventilation (V̇E), B) ventilatory equivalent for carbon dioxide (V̇E/V̇CO2), C) partial pressure of end-tidal CO2 (PETCO2), and D) oxygen saturation estimated by pulse oximetry (SpO2). Data are presented as mean ± SEM. DLCO: diffusing capacity for carbon monoxide; LLN: Lower limit of normal. *p < 0.05 DLCO<LLN vs. control, ǂp < 0.05 DLCO<LLN vs. DLCO≥LLN, †p < 0.05 DLCO≥LLN vs. control.
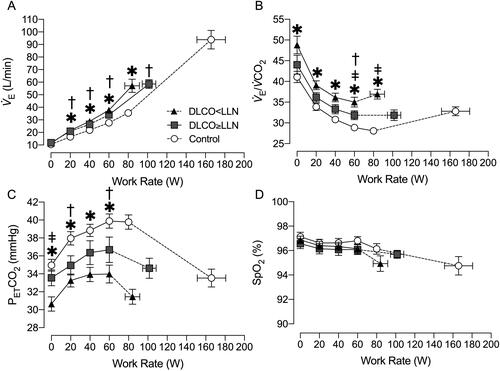
Partial pressure of end-tidal CO2 (PETCO2) was lower in DLCO<LLN compared with controls throughout exercise but there were no differences between COPD groups (). Estimated arterial oxygen saturation was not different between groups throughout exercise ().
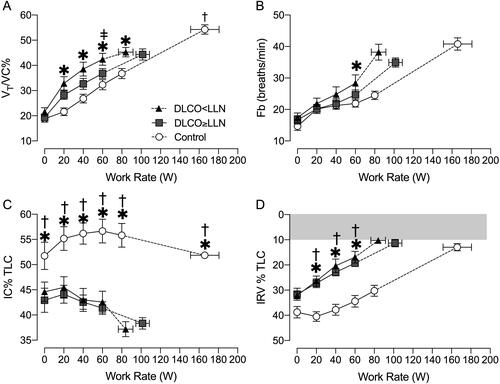
Tidal volume relative to vital capacity (VT/VC) was elevated in DLCO<LLN compared with controls. At 60 W, VT/VC was elevated in DLCO<LLN compared with DLCO≥LLN at 60 W (). 87% of the DLCO<LLN participants reached a VT/V̇E plateau compared with 69% of DLCO≥LLN participants (Figure E2). The plateau occurred at a lower average WR in DLCO<LLN than DLCO≥LLN (66 ± 31 W vs. 90 ± 23 W, p = 0.049). During exercise, both COPD groups breathed at higher operating lung volumes (lower IC and IRV) compared to controls (). The DLCO<LLN group encroached on critical mechanical limits earlier in exercise compared with DLCO≥LLN, reaching an end-inspiratory lung volume (EILV)>90% of TLC at a lower WR (76 ± 25 vs. 114 ± 35 W, p = 0.025).
Figure 3. Breathing pattern and operating lung volume responses to incremental exercise. A) tidal volume (VT) as a percentage of vital capacity (VC), B) breathing frequency (Fb), C) inspiratory capacity (IC) as a percentage of total lung capacity (TLC), and D) inspiratory reserve volume (IRV) as a percentage of TLC. Data are presented as mean ± SEM. DLCO: diffusing capacity for carbon monoxide; LLN: Lower limit of normal. *p < 0.05 DLCO<LLN vs. control, ǂp < 0.05 DLCO<LLN vs. DLCO≥LLN, †p < 0.05 DLCO≥LLN vs. control.
Sensory response to exercise
Dyspnea intensity during exercise was greater in DLCO<LLN compared with DLCO≥LLN and controls at 40 and 60 W ( and ). The relationship between dyspnea intensity as a function of increasing IND and V̇E as a percentage of maximum voluntary ventilation (MVV) was similar between groups ().
Figure 4. Dyspnea intensity during incremental exercise expressed relative to A) work rate, B) the ratio of diaphragmatic electromyography to maximal EMGdi (EMGdi%max) C) ventilation (V̇E) relative to maximum voluntary ventilation (MVV). Data are presented as mean ± SEM. Arrow indicates comparison at highest-equivalent work rate of 60 W between DLCO<LLN and the DLCO≥LLN and control groups. DLCO: diffusing capacity for carbon monoxide; LLN: Lower limit of normal. *p < 0.05 DLCO<LLN vs. control, ǂp < 0.05 DLCO<LLN vs. DLCO≥LLN.

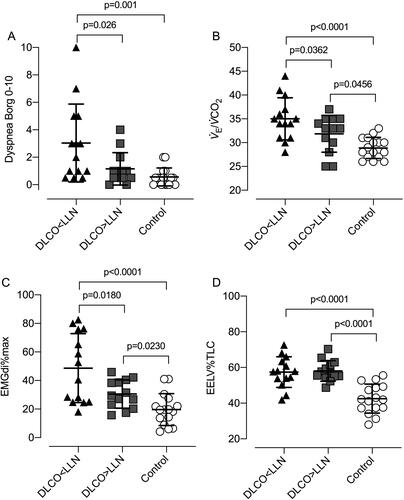
Figure 5. Individual exercise responses at 60 W for A) perceived dyspnea intensity (Borg scale), B) ventilation relative to carbon dioxide clearance (V̇E/V̇CO2), C) diaphragm electromyography (EMGdi) as a percentage of maximal EMGdi during inspiratory capacity maneuvers (EMGdi%max), and D) end-expiratory lung volume (EELV) as a percentage of total lung capacity (TLC). Data points are individual participant values with mean crossbars and standard deviation error bars. DLCO: Diffusing capacity for carbon monoxide; LLN: Lower limit of normal.
Correlative analysis
IND-WR slopes correlated with V̇E/V̇CO2 nadir p (r = 0.51, p < 0.001), and DLCO%predicted (r=–0.67, p < 0.001). DLCO%predicted in turn correlated with V̇E/V̇CO2 nadir (r = 0.43, p = 0.021) and the dyspnea-V̇O2 slope (r=–0.69, p < 0.001).
Discussion
Our results showed that: 1) mild COPD patients with DLCO<LLN had higher V̇E/V̇CO2, IND and dyspnea ratings during exercise compared with those with a DLCO≥LLN, despite similar resting respiratory mechanics; 2) The higher ventilatory requirements in the DLCO<LLN accelerated the development of significant respiratory mechanical constraints earlier in exercise, which further increased IND and dyspnea; 3) Dyspnea-IND slopes were similar in all three groups, therefore, the higher dyspnea ratings at a standardized WR in the DLCO<LLN group reflected simultaneously higher IND. This study provides new insights into the nature of the relationship between low DLCO and exertional dyspnea in patients with mild COPD.
Mild COPD is characterized by heterogeneous physiological derangements of pulmonary gas exchange and dynamic respiratory mechanics that are best uncovered by comparisons with healthy, age-matched controls during exercise (). The gradual evolution of these complex pathophysiological impairments in susceptible smokers ultimately results in adaptive compensatory increases of IND to maintain adequate alveolar ventilation (V̇A) during physical activity [Citation9,Citation35]. In this context, our results showed that the rise in IND, as a function of increasing power output, is higher in the two COPD groups than in healthy controls, being most pronounced in DLCO<LLN (). Higher IND for a given WR, V̇O2 or V̇E in COPD is multifactorial. Previous studies in mild COPD have focused on the role of increased airway resistance and mechanical loading of the inspiratory muscles [Citation9]. Under these conditions, increased cortical motor command output and electrical activation of the diaphragm (and other inspiratory muscles) is required to achieve adequate force generation to sustain V̇E commensurate with metabolic demand. Such factors are undoubtedly at play in the current COPD sample, particularly near peak exercise, when EILV is ∼89% of TLC [Citation7,Citation9]. The current study extends previous work by considering additional contributors to increased IND, such as increased chemo-stimulation and its negative impact on dynamic respiratory mechanics, particularly at lower exercise intensity.
The resting DLCO and V̇E/V̇CO2 are arguably indirect markers of pulmonary microvascular dysfunction/destruction and are linked to important clinical outcomes [Citation18–20,Citation36]. The single-breath DLCO consists of three components: pulmonary capillary blood volume (Vc), diffusing membrane capacity (Dm) and distribution of V̇A. Importantly, the TLC-VA differences were similar in the two COPD groups suggesting that lower V̇A as a fraction of TLC (i.e. poor distribution of inhaled gas mixture) did not explain differences in DLCO, thus confirming that the other factors are important. Tedjasaputra et al. [Citation16] recently demonstrated that both DLCO and Vc were reduced during exercise (while Dm and SpO2 were similar) in mild COPD, compared with healthy controls. Thus, low Vc may partly explain the link between low DLCO and high V̇E/V̇CO2.
Participants with lower DLCO had higher V̇E/V̇CO2 (nadir and slope) than the other two groups, indicating reduced ventilatory efficiency. In fact, V̇E/V̇CO2 nadir averaged ∼34 in DLCO<LLN– a cutoff value that has previously been linked to poorer survival in COPD [Citation36]. It is known that V̇E/V̇CO2 is influenced by: 1) the regulated resting arterial CO2 (PaCO2) (a variable known to be influenced by increased chemo-sensitivity) [Citation8,Citation13] and 2) the magnitude of the physiological dead space (number of alveolar lung units with high V̇A/Q̇ ratios) [Citation8]. Previous studies in mild COPD have established that enhanced central (and peripheral) chemo-sensitivity are unlikely contributors to increased V̇E/V̇CO2 nadir during exercise [Citation8,Citation13,Citation37,Citation38]. Indeed, in one such study high V̇E/V̇CO2 was more closely correlated with measured dead space than resting PaCO2 in mild COPD [Citation8]. Further although peripheral chemoreceptors are known to influence the ventilatory response to hypoxia during exercise in health [Citation39,Citation40], previous work in non-hypoxemic mild/moderate COPD has shown that enhanced peripheral chemosensitivity is unlikely to explain the increased ventilatory response (i.e. high V̇E/V̇CO2 nadir) during exercise [Citation37,Citation38].
Interestingly, in the current study, PETCO2 as a function of increasing WR was lowest in the DLCO<LLN group even though breathing pattern (which can influence PETCO2 at a given PaCO2) was similar between the COPD groups (). The low PETCO2 at rest and throughout exercise in DLCO<LLN could reflect the effects of reduced pulmonary blood perfusion (and Vc) and consequent inefficiencies in CO2 clearance [Citation5,Citation8]. In addition, we cannot exclude possible between-group differences in alveolar ventilation, though alveolar hyperventilation is not typical in mild COPD. Collectively, therefore, the consistently lower PETCO2 in patients with DLCO<LLN were more likely to represent the consequences of increased VD/VT. Given the well-known disparities between measured PETCO2 and arterial PaCO2 (even in mild COPD), direct measurements of arterial blood gases (unavailable in the current study) would be required to measure dead space and V̇A (calculation using the modified Bohr equation) and rule out any contribution of alveolar hyperventilation to the low PETCO2, by considering it in the context of the measured PaCO2 [Citation8]. This would allow for more definitive assessment of the contributions to reduced ventilatory efficiency in this population.
The relative importance of reduced ventilatory efficiency as a contributor to high IND and dyspnea in the DLCO<LLN group is best appreciated in the early phase of exercise and at the standardized 60 W comparison (). This point generally occurred before the anaerobic threshold (and the respiratory compensation point), where operating lung volumes, breathing pattern and arterial O2 saturation were similar in the two COPD groups. As anticipated, at higher exercise intensities, mechanical events became important. The higher IND (by 18%) and V̇E (by 11%) at 60 W in the DLCO<LLN group forced earlier dynamic mechanical constraints: the VT plateau (minimal IRV) and attendant tachypnea occurred at a lower WR, V̇E, and V̇O2 than the other two groups (). Thus, the results bolster the contention that significant dynamic respiratory mechanical constraints and high peak IND (62%) and severe dyspnea (Borg 6) can occur in patients with apparent, adequate breathing reserve, as traditionally estimated from FEV1 [Citation9,Citation41].
The association between activity-related dyspnea, low DLCO, high physiological dead space and high ventilatory demand is long established in advanced COPD and is often attributed to emphysema [Citation42]. Our current COPD participants, regardless of DLCO grouping, had similar minimal degrees of centrilobular emphysema on CT, which supports previous reports of a poor correlation of resting DLCO with emphysema scores in COPD [Citation18]. In this context, reduced pulmonary blood perfusion is known to occur in non-emphysematous lung regions in mild COPD [Citation15]. There is evidence that “vasculocentric” abnormalities (inflammation, endothelial dysfunction) can occur in mild COPD, independent of parenchymal destruction [Citation4,Citation5,Citation43,Citation44]. Notably, Barbera and colleagues [Citation4] originally showed intimal thickening and luminal narrowing of the pulmonary arteries in lung resection specimens in mild to moderate COPD, leading to high V̇A/Q̇ lung units and creating a skewed ventilation dispersion [Citation5]. Thus, it is conceivable that impaired capillary perfusion played an important role in decreasing DLCO and increasing VD in this sample with only minor or trace apical emphysema.
Participants with DLCO<LLN reported higher dyspnea intensity ratings at relatively low WRs compared with DLCO≥LLN and control (). Furthermore, dyspnea/IND and dyspnea/V̇E/MVV slopes were similar in all three groups (). It is clear that at 60 W, the DLCO<LLN group had higher IND and ventilatory demand/capacity imbalance, which helps explain their consistently higher exertional dyspnea ratings compared with the other two groups (). This association between reduced ventilatory efficiency/high demand and exertional dyspnea has been corroborated by a recent study by Phillips et al. [Citation45] which showed that in mild COPD, selective pulmonary vasodilation by inhaled nitric oxide (iNO, compared with placebo) was associated with decreased V̇E/V̇CO2 and dyspnea intensity. Importantly, this occurred in the absence of any change in dynamic lung mechanics or O2 saturation during iNO, highlighting the dyspneogenic role of reduced ventilatory efficiency in mild COPD. Taken in the context of current neurophysiological constructs of dyspnea, we posit that increased efferent electrical activation (increased IND) from both medullary (chemical) and cortical (mechanical) centers in the DLCO<LLN group, is relayed to the somatosensory cortex (increased central corollary discharge), where unpleasant respiratory sensations are consciously perceived [Citation46].
Limitations
Despite the best efforts to match controls on the basis of habitual physical activity in this retrospective analysis, the control group had greater than expected exercise capacity which may exaggerate group differences. However, the differences are unlikely to explain the key physiological differences at submaximal WR comparisons. Our study design did not allow us to explore multiple other potentially important afferent stimuli (e.g. from lungs, respiratory and locomotor muscles) that could potentially influence IND and the intensity and quality of dyspnea [Citation45]. Further, our study design did not include measurement of arterial blood gas, which limits our ability to calculate dead space, or consider the effects of carotid chemoreceptor response to arterial PO2. While our patients had no evidence of significant hypoxemia from pulse oximetry, or clinical diagnosis pulmonary hypertension, we did not determine if pulmonary artery pressures during exercise were higher in the DLCO<LLN than the other two groups, which would have contributed to a higher V̇E/V̇CO2. Future studies that included measurements of arterial blood gas and pulmonary artery pressures could add further mechanistic insight into genesis of dyspnea in mild COPD.
Conclusions
The results support the contention that IND during exercise is relatively high in COPD patients with only mild airway obstruction and lower DLCO. Moreover, we present new evidence that in those with mild COPD and low DLCO, abnormalities of pulmonary gas exchange likely contribute to higher IND from the early stages of exercise. Finally, the higher ventilatory demand in this group likely accelerated development of significant mechanical constraints with further amplification of IND and neuro-mechanical dissociation, which conflated to provoke greater respiratory discomfort as exercise proceeded.
Implications
DLCO measurement should be considered as part of a more comprehensive physiological evaluation of smokers with mild airway obstruction who present with disproportionate persistent dyspnea during physical activity. Combined abnormalities of DLCO and exercise V̇E/V̇CO2 suggest clinically important impairment of pulmonary gas exchange. The results set the stage for a deeper interrogation of the nature of microvascular dysfunction in smokers, including innovative biological studies to identify novel therapeutic targets.
Author contributions
All authors played a role in the content and writing of the manuscript. DEO had the original idea for the study. MDJ performed the majority of the data analysis. All authors contributed to data interpretation. MDJ and DEO wrote the first draft of the manuscript. All authors approved the final version of the manuscript.
Disclosure statement
M.D. James was supported by a Queen Elizabeth II Graduate Scholarship in Science and Technology. Dr. D.B. Phillips was supported by a postdoctoral fellowship from the Natural Sciences and Engineering Research Council of Canada. Dr. A.F. Elbehairy acknowledges the support of the European Respiratory Society, Fellowship LTRF 2019. Dr. D.E. O’Donnell has received research funding via Queen’s University from Canadian Institutes of Health Research, Canadian Respiratory Research Network, AstraZeneca, and Boehringer Ingelheim. The funders had no role in the study design, data collection and analysis, or preparation of the manuscript. All other authors have no conflicts of interest to declare.
References
- Ofir D, Laveneziana P, Webb KA, et al. Mechanisms of dyspnea during cycle exercise in symptomatic patients with GOLD Stage I Chronic Obstructive Pulmonary Disease. Am J Respir Crit Care Med. 2008;177(6):622–629. DOI:https://doi.org/10.1164/rccm.200707-1064OC
- Cherian M, Jensen D, Tan WC, et al. Dyspnoea and symptom burden in mild-moderate COPD: the Canadian Cohort Obstructive Lung Disease Study. ERJ Open Res. 2021 [March 25, 2021;7(2):00960-2020. DOI:https://doi.org/10.1183/23120541.00960-2020
- Huiart L, Ernst P, Suissa S. Cardiovascular morbidity and mortality in COPD. Chest. 2005;128(4):2640–2646. DOI:https://doi.org/10.1378/chest.128.4.2640
- Barberà JA, Riverola A, Roca J, et al. Pulmonary vascular abnormalities and ventilation–perfusion relationships in mild chronic obstructive pulmonary disease. Am J Respir Crit Care Med. 1994;149(2):423–429. DOI:https://doi.org/10.1164/ajrccm.149.2.8306040
- Rodriguez-Roisin R, Drakulovic M, Rodriguez DA, et al. Ventilation–perfusion imbalance and chronic obstructive pulmonary disease staging severity. J Appl Physiol. 2009;106(6):1902–1908. (1985). DOI:https://doi.org/10.1152/japplphysiol.00085.2009
- Wouters EFM, Franssen FM. Chronic obstructive pulmonary disease: shifting the paradigm to the vasculature. Am J Respir Crit Care Med. 2019;199(3):258–259. DOI:https://doi.org/10.1164/rccm.201808-1542ED
- Chin RC, Guenette JA, Cheng S, et al. Does the respiratory system limit exercise in mild chronic obstructive pulmonary disease?Am J Respir Crit Care Med. 2013;187(12):1315–1323. DOI:https://doi.org/10.1164/rccm.201211-1970OC
- Elbehairy AF, Ciavaglia CE, Webb KA, et al. Pulmonary gas exchange abnormalities in mild chronic obstructive pulmonary disease. implications for dyspnea and exercise intolerance. Am J Respir Crit Care Med. 2015;191(12):1384–1394. DOI:https://doi.org/10.1164/rccm.201501-0157OC
- Guenette JA, Chin RC, Cheng S, et al. Mechanisms of exercise intolerance in global initiative for chronic obstructive lung disease grade 1 COPD. Eur Respir J. 2014;44(5):1177–1187. DOI:https://doi.org/10.1183/09031936.00034714
- Hogg JC, Chu F, Utokaparch S, et al. The nature of small-airway obstruction in chronic obstructive pulmonary disease. N Engl J Med. 2004;350(26):2645–2653. DOI:https://doi.org/10.1056/NEJMoa032158
- Neder JA, Milne KM, Berton DC, CRRN (Canadian Respiratory Research Network) and the CanCOLD (Canadian Cohort of Obstructive Lung Disease) Collaborative Research Group, et al. Exercise tolerance according to the definition of airflow obstruction in smokers. Am J Respir Crit Care Med. 2020;202(5):760–762. DOI:https://doi.org/10.1164/rccm.202002-0298LE
- Elbehairy AF, Raghavan N, Cheng S, et al. Physiologic characterization of the chronic bronchitis phenotype in GOLD grade IB COPD. Chest. 2015;147(5):1235–1245. DOI:https://doi.org/10.1378/chest.14-1491
- Phillips DB, Domnik NJ, Elbehairy AF, et al. Elevated exercise ventilation in mild COPD is not linked to enhanced central chemosensitivity. Respir Physiol Neurbiol. 2021;284:103571. DOI:https://doi.org/10.1016/j.resp.2020.103571
- Kirby M, Owrangi A, Svenningsen S, et al. On the role of abnormal DL(CO) in ex-smokers without airflow limitation: symptoms, exercise capacity and hyperpolarised helium-3 MRI. Thorax. 2013;68(8):752–759. DOI:https://doi.org/10.1136/thoraxjnl-2012-203108
- Hueper K, Vogel-Claussen J, Parikh MA, et al. Pulmonary microvascular blood flow in mild chronic obstructive pulmonary disease and emphysema. The MESA COPD Study. Am J Respir Crit Care Med. 2015;192(5):570–580. DOI:https://doi.org/10.1164/rccm.201411-2120OC
- Tedjasaputra V, van Diepen S, Phillips DB, et al. Pulmonary capillary blood volume response to exercise is diminished in mild chronic obstructive pulmonary disease. Respir Med. 2018;145:57–65. DOI:https://doi.org/10.1016/j.rmed.2018.10.015
- Neder JA, Berton DC, Muller PT, Canadian Respiratory Research Network, et al. Ventilatory Inefficiency and Exertional Dyspnea in Early Chronic Obstructive Pulmonary Disease. Ann Am Thorac Soc. 2017;14(Supplement_1):S22–S29. DOI:https://doi.org/10.1513/AnnalsATS.201612-1033FR
- Elbehairy AF, O’Donnell CD, Abd Elhameed A, Canadian Respiratory Research Network, et al. Low Resting Diffusion Capacity, Dyspnea and Exercise Intolerance in COPD. J Appl Physiol. 2019;127(4):1107–1116. DOI:https://doi.org/10.1152/japplphysiol.00341.2019
- Elbehairy AF, Faisal A, Guenette JA, On Behalf of Canadian Respiratory Research Network (CRRN), et al. Resting Physiological Correlates of Reduced Exercise Capacity in Smokers with Mild Airway Obstruction. COPD. 2017;14(3):267–275. DOI:https://doi.org/10.1080/15412555.2017.1281901
- Phillips DB, James MD, Elbehairy AF, et al. Reduced exercise tolerance in mild chronic obstructive pulmonary disease: the contribution of combined abnormalities of diffusing capacity for carbon monoxide and ventilatory efficiency. Respirology. 2021 [Apr 7 2021]. DOI:https://doi.org/10.1111/resp.14045
- GOLD©. Global Strategy for the Diagnosis, Management, and Prevention of Chronic Obstructive Pulmonary Disease (2021 Report). Fontana, WI, USA, 2021.
- Mahler DA, Weinberg DH, Wells CK, et al. The measurement of dyspnea. Contents, interobserver agreement, and physiologic correlates of two new clinical indexes. Chest. 1984;85(6):751–758. DOI:https://doi.org/10.1378/chest.85.6.751
- Mahler DA, Wells CK. Evaluation of clinical methods for rating dyspnea. Chest. 1988;93(3):580–586. DOI:https://doi.org/10.1378/chest.93.3.580
- Jones PW, Harding G, Berry P, et al. Development and first validation of the COPD Assessment Test. Eur Respir J. 2009;34(3):648–654. DOI:https://doi.org/10.1183/09031936.00102509
- Graham BL, Steenbruggen I, Miller MR, et al. Standardization of Spirometry 2019 Update. An Official American Thoracic Society and European Respiratory Society Technical Statement. Am J Respir Crit Care Med. 2019;200(8):e70–e88. DOI:https://doi.org/10.1164/rccm.201908-1590ST
- Macintyre N, Crapo RO, Viegi G, et al. Standardisation of the single-breath determination of carbon monoxide uptake in the lung. Eur Respir J. 2005;26(4):720–735. DOI:https://doi.org/10.1183/09031936.05.00034905
- Wanger J, Clausen JL, Coates A, et al. Standardisation of the measurement of lung volumes. Eur Respir J. 2005;26(3):511–522. DOI:https://doi.org/10.1183/09031936.05.00035005
- Lynch DA, Austin JHM, Hogg JC, et al. CT-definable subtypes of chronic obstructive pulmonary disease: a statement of the Fleischner society. Radiology. 2015;277(1):192–205. DOI:https://doi.org/10.1148/radiol.2015141579
- Stanojevic S, Graham BL, Cooper BG, et al. Official ERS technical standards: Global Lung Function Initiative reference values for the carbon monoxide transfer factor for Caucasians. Eur Respir J. 2017;50(3):1700010. DOI:https://doi.org/10.1183/13993003.00010-2017
- Quanjer PH, Stanojevic S, Cole TJ, ERS Global Lung Function Initiative, et al. Multi-ethnic reference values for spirometry for the 3-95-yr age range: the global lung function 2012 equations. Eur Respir J. 2012;40(6):1324–1343. DOI:https://doi.org/10.1183/09031936.00080312
- Lewthwaite H, Benedetti A, Stickland MK, CanCOLD Collaborative Research Group and the Canadian Respiratory Research Network, et al. Normative peak cardiopulmonary exercise test responses in Canadian adults aged ≥ 40 years. Chest. 2020;158(6):2532–2545. DOI:https://doi.org/10.1016/j.chest.2020.06.074
- Luo YM, Moxham J, Polkey MI. Diaphragm electromyography using an oesophageal catheter: current concepts. Clin Sci (Lond). 2008;115(8):233–244. DOI:https://doi.org/10.1042/CS20070348
- Jolley CJ, Luo YM, Steier J, et al. Neural respiratory drive in healthy subjects and in COPD. Eur Respir J. 2009;33(2):289–297. DOI:https://doi.org/10.1183/09031936.00093408
- Jolley CJ, Luo YM, Steier J, et al. Neural respiratory drive and breathlessness in COPD. Eur Respir J. 2015;45(2):355–364. DOI:https://doi.org/10.1183/09031936.00063014
- Elbehairy AF, Guenette JA, Faisal A, et al. Mechanisms of exertional dyspnoea in symptomatic smokers without COPD. Eur Respir J. 2016;48(3):694–705. DOI:https://doi.org/10.1183/13993003.00077-2016
- Neder JA, Alharbi A, Berton DC, et al. Exercise ventilatory inefficiency adds to lung function in predicting mortality in COPD. COPD. 2016;13(4):416–424. DOI:https://doi.org/10.3109/15412555.2016.1158801
- Phillips DB, Collins SÉ, Bryan TL, et al. The effect of carotid chemoreceptor inhibition on exercise tolerance in chronic obstructive pulmonary disease: a randomized-controlled crossover trial. Respir Med. 2019;160:105815. DOI:https://doi.org/10.1016/j.rmed.2019.105815
- Stickland MK, Fuhr DP, Edgell H, et al. Chemosensitivity, cardiovascular risk, and the ventilatory response to exercise in COPD. PLoS One. 2016;11(6):e0158341. DOI:https://doi.org/10.1371/journal.pone.0158341
- Chronos N, Adams L, Guz A. Effect of hyperoxia and hypoxia on exercise-induced breathlessness in normal subjects. Clin Sci (Lond). 1988;74(5):531–537. DOI:https://doi.org/10.1042/cs0740531
- Ward SA, Whipp BJ. Effects of peripheral and central chemoreflex activation on the isopnoeic rating of breathing in exercising humans. J Physiol. 1989;411:27–43. DOI:https://doi.org/10.1113/jphysiol.1989.sp017557
- Neder JA, Berton DC, Marillier M, On Behalf of the Canadian Respiratory Research Network (CRRN), et al. Inspiratory constraints and ventilatory inefficiency are superior to breathing reserve in the assessment of exertional dyspnea in COPD. COPD. 2019;16(2):174–181. DOI:https://doi.org/10.1080/15412555.2019.1631776
- O’Donnell DE, Webb KA. Breathlessness in patients with severe chronic airflow limitation. Physiologic correlations. Chest. 1992;102(3):824–831. DOI:https://doi.org/10.1378/chest.102.3.824
- Peinado VI, Barbera JA, Ramirez J, et al. Endothelial dysfunction in pulmonary arteries of patients with mild COPD. Am J Physiol. 1998;274(6):L908–L913. DOI:https://doi.org/10.1152/ajplung.1998.274.6.L908
- Santos S, Peinado VI, Ramírez J, et al. Characterization of pulmonary vascular remodelling in smokers and patients with mild COPD. Eur Respir J. 2002;19(4):632–638. DOI:https://doi.org/10.1183/09031936.02.00245902
- Phillips DB, Brotto AR, Ross BA, the Canadian Respiratory Research Network, et al. Inhaled nitric oxide improves ventilatory efficiency and exercise capacity in patients with mild COPD: a randomized-control cross-over trial. J Physiol. 2021;599(5):1665–1683. DOI:https://doi.org/10.1113/JP280913
- O’Donnell DE, Ora J, Webb KA, et al. Mechanisms of activity-related dyspnea in pulmonary diseases. Respir Physiol Neurobiol. 2009;167(1):116–132. DOI:https://doi.org/10.1016/j.resp.2009.01.010