
 ?Mathematical formulae have been encoded as MathML and are displayed in this HTML version using MathJax in order to improve their display. Uncheck the box to turn MathJax off. This feature requires Javascript. Click on a formula to zoom.
Abstract
Limited information is available regarding the role of anaerobic metabolism capacity on GOLD 1 and 2 COPD patients during upper limb exercise. We aimed to compare the upper limb anaerobic power capacity, blood lactate concentration, cardiovascular and respiratory responses, in male COPD patients versus healthy subjects during the 30-s Wingate anaerobic test (WAnT). The rate of fatigue and time constant of the power output decay (τ, tau) were also calculated and a regression analysis model was built to assess the predictors of τ in these patients. Twenty-four male COPD patients (post-bronchodilator FEV1 73.2 ± 15.3% of predicted) and 17 healthy subjects (FEV1 103.5 ± 10.1% of predicted) underwent the WAnT. Measurements were performed at rest, at the end of the WAnT, and during 3′ and 5′ of recovery time. Peak power (p = 0.04), low power (p = 0.002), and mean power output (p = 0.008) were significantly lower in COPD patients than in healthy subjects. Power output decreased exponentially in both groups, but at a significantly faster rate (p = 0.007) in COPD patients. The time constant of power decay was associated with resistance (in ohms) and fat-free mass (r2 = 0.604, adjusted r2 = 0.555, and p = 0.002). Blood lactate concentration was significantly higher in healthy subjects at the end of the test, as well as during 3′ and 5′ of recovery time (p < 0.01). Compared with healthy subjects, COPD patients with GOLD 1 and 2 presented lower upper limb anaerobic capacity and a faster rate of power output decrease during a maximal intensity exercise. Also, the WAnT proved to be a valid tool to measure the upper limb anaerobic capacity in these patients.
Introduction
Locomotor muscle dysfunction is one of the most important extrapulmonary manifestations in patients with chronic obstructive pulmonary disease (COPD) [Citation1]. When performing activities of daily living using the upper limbs, COPD patients may experience intensive dyspnea, pulmonary hyperinflation, and reduced functional performance mainly due to oxidative capacity dysfunction and ventilatory constraints [Citation2]. Furthermore, compared with healthy subjects, COPD patients perform upper limb activities at a lower intensity and relatively higher muscle effort [Citation3].
Age-associated declines in muscle mass, strength, and aerobic capacity contribute to loss of physical function; therefore, completion of daily tasks may rely on anaerobic pathways [Citation4]. This mechanism may be intensified in COPD patients due to marked impairment in oxidative capacity. Adami et al. [Citation5] recently showed that oxidative capacity of upper and lower limb muscles was low in COPD patients compared with sex and age-matched smokers with normal spirometry, a fact that may contribute to respiratory symptoms, reduced muscle endurance, and quality of life. Apart from aerobic capacity, the production of high instantaneous power is also required in these patients for many daily activities, thus influencing the development of their daily autonomy. However, limited information is available regarding the role of anaerobic metabolism capacity on these patients during upper limb activities, especially in the early stages of the disease [Citation6–9].
The Wingate anaerobic test (WAnT) was designed to specifically evaluate the anaerobic capacity of muscle groups during a supra-maximal load and has been widely used for measurements of upper limb anaerobic metabolism in both athletes and healthy individuals [Citation10–12]. The WAnT requires arm cranking for 30 s at maximal speed against a constant force and promotes a considerable reduction in both the adenosine-triphosphate-phosphocreatine system (ATP-PC system) and glycogen contents, with consequent accumulation of lactate in the muscle and blood [Citation11, Citation12]. The constant effort applied during the test is directly related to the achieved workload (W) and induces a noticeable development of fatigue that can be calculated as the slope of the power decay [Citation10, Citation11]. According to Driss and Vandewalle [Citation13], active muscle mass during all-out cycling is the main biological factor limiting maximal power output, whereas main qualitative factors are probably type of muscle fiber, mechanical efficiency, and motor control.
We hypothesized that the upper limbs anaerobic capacity is impaired in GOLD 1 and 2 male COPD patients and could be safely assessed using the WAnT. We aimed to compare the upper limb anaerobic power capacity, blood lactate concentration, cardiovascular and respiratory responses, rate of fatigue, and time constant of the power output decay in GOLD 1 and 2 male COPD patients versus healthy subjects.
Materials and methods
Subjects
This is a cross-sectional and controlled investigation. Clinically stable patients (i.e. no exacerbation in the previous four weeks), with mild and moderate COPD (diagnosed according to the Global Initiative for Obstructive Lung Disease) [Citation14] admitted to a pulmonary rehabilitation center were recruited and compared with self-reported healthy subjects with no history of respiratory disease. Healthy subjects were enrolled by convenience among the rehabilitation center staff and relatives and friends of patients. COPD patients and healthy subjects included were not involved in any form of exercise training for at least one year prior to their participation in the study or were carrying out any heavy work with their arms. Exclusion criteria for both groups were the presence of other pulmonary diseases, cardiovascular disorders, and skeletal muscle abnormalities that could limit their shoulder girdle functionality, as well as any metabolic disorders or medical contraindications to performing the WanT.
The protocol was approved by the Research and Ethics Committee of the Federal University of São Paulo (no. 1733/07), and procedures were conducted according to the World Medical Association Declaration of Helsinki. All subjects signed an informed consent form.
Pulmonary function test and dyspnea
Spirometry was performed in both groups according to the ATS/ERS recommendations [Citation15], using a portable spirometer (EasyOne®, by NDD Medical Technologies, Andover, MA). Forced vital capacity (FVC), forced expiratory volume in the first second (FEV1), and FEV1/FVC ratio were obtained and compared with absolute and percentage of predicted values for the Brazilian population [Citation16]. Before the spirometry COPD patients were asked about their perceived breathlessness using the Medical Research Council (MRC) dyspnea scale and were then classified into MRC dyspnea grades [Citation17].
Anthropometry and body composition
Height, weight, triceps skinfold thickness as well as wrist, upper forearm, and arm circumferences were measured [Citation18, Citation19] (Lange skinfold caliper, USA). Arm muscle area (AMA) was also calculated according to Frisanchio’s equation [18].
where M: the upper arm muscle area, c: upper arm circumference converted to mm and T triceps skinfold [Citation18].
Patients with COPD and healthy subjects were asked to lay supine for at least 15 minutes, and bioimpedance was recorded using a conventional tetrapolar electrode array (Quantum II RJL Systems, USA). Data were analyzed using the manufacturer’s software, and both the resistance and reactance (in Ω) at 50 kHz were obtained in absolute values as well as relative to height [Citation20]. Fat mass and fat-free mass (FFM) were calculated and expressed in kilograms and as a percentage of body weight [Citation21]. FFM index was calculated by dividing FFM (in kg) by the height (in meters) squared [Citation22].
30-s Wingate anaerobic test
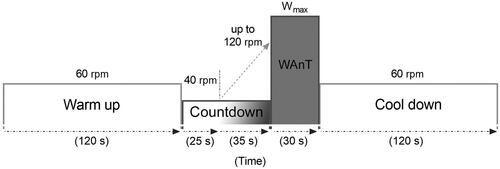
The WAnT was performed using a computerized upper body isokinetic cycle ergometer (Cybex® MET-300, Medway, USA) (). COPD patients and healthy subjects performed two WAnT with an interval of seven days in between, and the results of the best test based on the highest power output achieved were used for analyses [Citation10, Citation11]. Power output (in watts) was recorded during each second of the test. Peak power (PP, calculated as the highest power achieved in the first 5 s of the WAnT), lowest power (LP, as the lowest power output generated at the end of the test), and mean power (MP, as the average power throughout the whole 30-s period) were also calculated. MP values were also expressed relative to AMA, and PP values relative to both weight and FFM.
Figure 1. Schematic diagram of the study protocol. After a period of 120 s of warm-up pedaling at an angular speed of 60 rotations per second (rpm), a countdown period of 60 s was started. During the first 25 s of the countdown, subjects were instructed to pedal with an angular speed of 40 rotations per second. The speed was then increased up to 120 rotations per second during the remaining 35 s of the countdown period. Right after, subjects were verbally encouraged to give an all-out effort (Wmax) throughout a 30 s period. At the end of the Wingate test (WAnT), a cool down period of 120 s while pedaling with an angular speed of 60 rotations per minute.
None of the COPD patients or healthy subjects used bronchodilators before or after the WAnT since pulmonary function, anthropometric, and body composition data were performed in a different day. In all COPD patients and healthy subjects dyspnea and arm fatigue (10 – Borg scale) [Citation23], respiratory rate, pulse oxygen saturation (SpO2) (920 M, Healthdyne Technologies, USA), and both systolic and diastolic blood pressure were measured at rest (i.e. before warm-up), immediately at the end of the WAnT, as well as during 3′ and 5′ of recovery time. The heart rate was continuously monitored with electrocardiographic CM5, AFV, and V2 leads (EP-3 Dixtal, São Paulo, Brazil).
Blood lactate concentration
Arterialized capillary blood samples from all COPD patients and healthy subjects were collected from the hyperemic ear lobe, drawn into heparinized-capillary tubes (25 µl), and immediately dispensed into an Eppendorf tube with 50 μl of 1% sodium fluoride for subsequent analysis using a YSI Sport 1500 L-lactate analyzer (Yellow Springs, Yellow Springs Instruments, OH, USA). Samples were collected before warm-up, immediately at the end of the test, as well as at 3′ and 5′ of recovery time. Since lactate concentration could be influenced by both the power output and muscle mass [Citation24], values were also expressed relative to MP and FFM, and expressed as mmol·L−1·W−1 and mmol·L−1·kg−1, respectively [Citation25].
Statistical analyses
Data analyses
Descriptive and inferential analyses were conducted using SPSS 22 software (IBM Corp., USA). Data regarding decay of power output during WAnT was normalized for each patient by expressing it in percent of the power output value obtained in the first second of the test. Since ATP-PC and glycolytic systems become the dominant energy sources from the fifth second to the end of the WAnT [Citation26], non-linear regression curves (one-phase decay exponential models) that fit maximum power output values in a least-square sense were applied over all normalized data points from the 6th to the 30th second of the WAnT. This approach allowed to determine the rate of power decrease (i.e. fatigue index) by calculating the time constant (τ, tau) of power decay and its slope (calculated as the derivative of the exponential equation) A separate polynomial trend analyses were performed in the power output data of both groups (i.e. throughout the 30 s time-series data) to assess the existence of significant patterns, and partial eta squared statistics (ɳp2) were computed for each trend as a measure of effect size.
Statistical approach
The sample size was calculated according to the lactate concentration measured at rest and the end of the WAnT. A Cohen’s f = 0.92 was obtained according to a pilot study including five COPD patients (mean of 1.19 ± 0.40 and 4.69 ± 0.98) and five healthy subjects (mean of 1.10 ± 0.38 and 7.18 ± 1.97) and, assuming α = 0.05 and power = 99%, a minimum sample of 17 subjects for each group was obtained.
Data were reported as mean ± SD otherwise median and interval interquartile (IQR). Data distribution was verified using the Shapiro–Wilk test. Differences between COPD patients and healthy subjects (intergroup analyses) were calculated using the unpaired t-test or Mann-Whitney test. Friedman’s test was used to determine intragroup differences for heart rate, respiratory rate, blood pressure, SpO2, dyspnea, arm effort, and lactate concentration. In the event of a statistically significant difference, Dunn’s post hoc test of the four moments (rest, end of the WAnT, 3′, and 5′ of recovery times) allowed us to know which moment significantly differed from one to another. Cohen’s d was calculated to estimate effect-size for parametric data between groups and interpreted as small (<0.50), moderate (between 0.50 and 0.80), and large (>0.80). For non-parametric data, Cohen’s r for intergroup analysis was calculated according to Fritz et al. [Citation27] and expressed as low (<0.25), moderate (between 0.25 and 0.38), and large (>0.38). A multivariate stepwise linear regression analysis model was built using bioimpedance resistance, fat free mass, body mass index, and age to assess predictors of τ in COPD patients [Citation28]. Variables presenting p-values of <0.10 were included in the regression model. For this analysis, variables were standardized with respect to mean and SD, and the following parameters were reported: r2, adjusted r2, and p-value. Sample size, effect sizes, and power (1 − β) were analyzed using G*Power software, version 3.1.9.2 (Kiel, Germany). The level of statistical significance was set at p < 0.05 (two-tailed) for all tests.
Results
Twenty four COPD patients (30.0% GOLD 1 and 70% GOLD 2, with a mean smoking history of 56.6 ± 40.4 pack-years) and 17 healthy subjects were included in the study. There was no difference between the groups in terms of age, weight, body mass index, and body composition (). COPD patients presented a median MRC of 2 with IQR 1–2 (nine patients with grade 1, seven with grade 2, seven with grade 3, and one with grade 4), and a significantly lower (p < 0.001) FEV1 and FEV1/FVC when compared with healthy subjects.
Table 1. Anthropometric, lung function, and body composition characteristics of COPD and healthy subjects.
Anaerobic power capacity
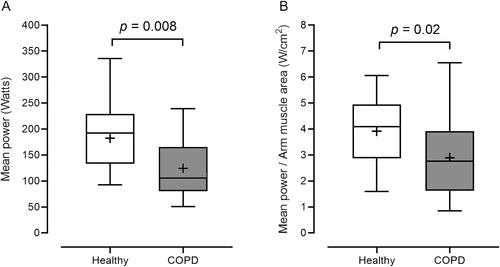
When compared to healthy subjects, COPD patients presented a significantly lower PP (Cohen’s d = 0.64, 1 − β = 0.50, p = 0.04) and LP (Cohen’s r = 1.08, 1 − β = 0.91, p = 0.002). Similar results were observed when PP was expressed relative to kilogram of body weight (Cohen’s d = 0.66, 1 − β = 0.53, p = 0.04) or kilogram of FFM (Cohen’s d = 0.64, 1 − β = 0.50, p = 0.04) (). MP values were also significantly lower in COPD patients, both when expressed in watts (Cohen’s r = 0.94, 1 − β = 0.84, p = 0.008) and normalized by AMA (Cohen’s r = 0.74, 1 − β = 0.62, p = 0.02) (). Apart from these, the fatigue index was not significantly different between groups (68.33 ± 20.87 for COPD patients and 70.06 ± 8.59 for healthy subjects).
Figure 2. Peak power output (in watts [panel A]), low power output (panel B), peak power normalized by weight (in kilograms [panel C]), and free fat mass (FFM [panel D]) during the Wingate test in healthy subjects and COPD patients. Data is shown as median (25th–75th percentile). Whiskers denote minimum and maximum values. Plus signals (+) represent mean values. White dots indicate outliers.
![Figure 2. Peak power output (in watts [panel A]), low power output (panel B), peak power normalized by weight (in kilograms [panel C]), and free fat mass (FFM [panel D]) during the Wingate test in healthy subjects and COPD patients. Data is shown as median (25th–75th percentile). Whiskers denote minimum and maximum values. Plus signals (+) represent mean values. White dots indicate outliers.](/cms/asset/3e38638a-9f04-4ae5-b9eb-099aac5d1516/icop_a_2079485_f0002_b.jpg)
Figure 3. Mean power, expressed in watts (panel A) and normalized by arm muscle area (panel B), during the Wingate test in healthy subjects and COPD patients. Data is shown as median (25th–75th percentile). Whiskers denote minimum and maximum values. Plus signals (+) represent mean values. W/cm2: Watts per centimeters squared.
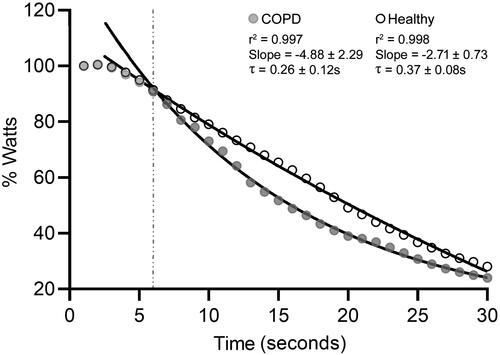
Normalized power output decreased exponentially in COPD patients (r2 = 0.997) and healthy subjects (r2 = 0.998) from 6 to 30 s of the WAnT. The τ and slope values indicated that power output decreased at a significantly faster rate in COPD patients when compared with healthy subjects (Cohen’s r = 0.83, 1 − β = 0.72, p = 0.007 and Cohen’s r = 1.20, 1 − β = 0.95, p = 0.005, respectively) (). The multivariate regression analysis showed that bioimpedance resistance and FFMkg explained 55.5% of the variability in τ value (r2 = 0.604, adjusted r2 = 0.555, SE = 0.678, and p = 0.002). The following model was determined: τ (s) = −14 404 + (−1.194 x resistance) + (0.703 x FFM[kg]).
Figure 4. Time courses of the normalized power output during the Wingate test in COPD patients (gray dots) and healthy subjects (white dots). All values are expressed in percentage (%) relative to the power achieved during the first second of the test. Lines represent the regression curves that fitted maximum values in a least-square sense from 6 s (gray line) to 30 s of the Wingate. τ: time constant.
Different decay patterns were identified in both groups during the WAnT. The power output of COPD patients decreased with significant quadratic (p = 0.03, ɳp2 = 0.175), linear (p < 0.001, ɳp2 = 0.881), and cubic (p = 0.04, ɳp2 = 0.152) trends, while only quadratic (p = 0.02, ɳp2 = 0.248) and linear (p < 0.001, ɳp2=0.986) components were identified in the power output decay of healthy subjects.
Two healthy subjects and two COPD patients developed chest pain/tightness at the end of the WAnT, which rapidly ceased after a few minutes, with no other consequences. One healthy subject had intense nauseas after the WAnT.
Blood lactate concentration
Blood lactate concentration significantly increased at the end of WAnT compared to the blood lactate concentration at rest in both groups, and there was a further significant increase at the third and fifth minutes of recovery time also in both groups (p < 0.001); however, lactate concentration was significantly lower in COPD patients at the end of the exercise (Cohen’s d = 0.81, 1 − β = 0.70), as well as during the third (Cohen’s d = 1.06, 1 − β = 0.90) and fifth minutes (Cohen’s d = 1.02, 1 − β = 0.88) of recovery time (). When expressed relative to FFM, similar differences were observed in lactate concentration at the end of the exercise (Cohen’s d = 0.84, 1 − β = 0.73), and during the third (Cohen’s d = 1.07, 1 − β = 0.95) and fifth minutes (Cohen’s d = 1.02, 1 − β = 0.93) of recovery time (). No significant differences were found when normalized for MP.
Figure 5. Lactate concentration (in absolute values [panel A] and normalized for fat-free mass [panel B]) at rest, at the end of the Wingate test, as well as after 3 and 5 minutes of recovery times in COPD patients and healthy subjects. Data is shown as median (25th–75th percentile). Whiskers denote minimum and maximum values. Plus signals (+) represent mean values. White dots indicate outliers.
![Figure 5. Lactate concentration (in absolute values [panel A] and normalized for fat-free mass [panel B]) at rest, at the end of the Wingate test, as well as after 3 and 5 minutes of recovery times in COPD patients and healthy subjects. Data is shown as median (25th–75th percentile). Whiskers denote minimum and maximum values. Plus signals (+) represent mean values. White dots indicate outliers.](/cms/asset/caa49776-f7ab-478f-b2dd-f40e1f05d7a0/icop_a_2079485_f0005_b.jpg)
Response of the cardiovascular and respiratory systems
As shown in , dyspnea, upper limb effort, respiratory rate, heart rate, and systolic blood pressure increased significantly (p < 0.001) in both groups at the end of the WAnT and remained increased after 3′ of recovery when compared with values at rest. Only the heart rate remained significantly higher at 5′ (p < 0.001). When compared with healthy subjects, COPD patients showed a significantly higher respiratory rate at the end of the test (Cohen’s d = 0.52, 1 − β = 0.36) and during the third minute of recovery (Cohen’s d = 0.36, 1 − β = 0.20).
Table 2. Cardiovascular, respiratory and exercise parameters during the WAnT in COPD patients and healthy subjects.
Discussion
The main finding of this study is that the upper limb anaerobic capacity of GOLD 1 and 2 COPD patients is reduced during the WAnT when compared with healthy subjects. Our male COPD patients in the early stages of the disease presented significantly lower peak and mean power, as well as a faster rate of power output decrease (expressed by a low time constant and high slope values) that is partially explained by the resistance and fat-free mass results [Citation19]. Additionally, at the end of the WAnT and during the third and fifth minutes of recovery time, lactate concentration (in mmol·L−1 and mmol·L−1·kg−1) was found to be significantly lower when compared with healthy. To the best of our knowledge, no previous studies have addressed the assessment of upper limb anaerobic capacity in COPD patients GOLD 1 and 2 using the WAnT.
It is widely accepted that COPD presents systemic features, including skeletal muscle dysfunction, possibly secondary to an increase in the inflammatory mediators released in the circulation [Citation29]. Skeletal muscle dysfunction in COPD patients is characterized by loss of muscle mass, decreased power and strength, adaptative alterations of muscle fibers type, mitochondrial cell dysfunction and it is well documented in advanced stages of COPD [Citation9], which may lead to a decrease of the level of physical activity.
It is known that the low force-generating capacity of the upper limb muscles is reduced in patients with COPD [Citation5, Citation30]. In our study, the absolute upper limb PP and MP outputs were, respectively, 25% and 32% lower in COPD patients when compared with healthy subjects. The anaerobic PP and MP remained smaller, even after expressing their values relative to body weight or FFM (in kg) and AMA. Although muscle wasting plays an important role in the loss of maximal strength [Citation31], muscle mass (assessed either by AMA, FFM, or FFMI) was not found to be altered, probably due to the low COPD severity of our patients. Yquel et al. [Citation32] observed that in moderate COPD patients doing maximal sprints on a cycle ergometer the peak anaerobic power was 30% lower than in healthy subjects; the authors suggest that the specific muscular dysfunction is reflected by a decrease in peak anaerobic power. The findings Yquel et al. [Citation32] support our hypothesis that a possible intrinsic dysfunction in muscle metabolism may occur before muscle atrophy in the early stage of the disease. As the variance of PP during this test is mainly explained by the energy from the metabolism of the anaerobic lactic acid [Citation12], the impairment of this energy system in this group of COPD patients may play an important role in limiting the generation of higher upper limb peak power outputs.
High power output during a high-intensity bout may imply high reliance on both the fast-twitch fibers and anaerobic metabolism [Citation33]. Studies have demonstrated that the glycolytic enzymes concentration (e.g. phosphofructokinase and lactate dehydrogenase) are similar or increased in deltoid muscle [Citation2] and lower limb muscles of COPD patients compared to healthy subjects [Citation34, Citation35], which may imply normal or greater anaerobic capacity. However, after the 6th second of the WAnT, a period in which the rate of glycolysis is expected to be the dominant contributor to performance with increased ATP synthesis [Citation36, Citation37], power output decreased at a faster rate in COPD patients. This distinct pattern was also identified in the polynominal trend analysis (). Furthermore, the time constant of power decay was found to be associated with resistance (an indirect measure of total body water) [Citation38] and FFM (in kg) which suggest intrinsic muscle cell damage [Citation39]. This suggestion could be evaluated by using sophisticated and direct measures as muscular biopsy or magnetic resonance image. Indeed, the above-mentioned findings support the concept of precocious muscle dysfunction in COPD and indicate that upper limb anaerobic metabolism capacity is decreased in the early stages of the disease.
Our results showed that COPD patients presented significantly lower blood lactate concentration (in absolute values and normalized for FFM) at the end of upper limb WAnT than healthy subjects, which is corroborated by the low peak power output in the COPD patients group. Anaerobic power output is associated with ATP production by glycolytic metabolism, accumulating blood lactate [Citation13, Citation40]. The reduced blood lactate concentration in our COPD patients may reflect low ATP production, leading to the low peak and mean power output and suggesting an inefficient anaerobic metabolism. This low lactate response was neither associated with physical inactivity nor with age, as both groups had a similar sedentary lifestyle and age. We believe the difference between this study and others regarding lactate production during exercise in COPD patients can be attributable to the different COPD severity and the type of exercise performed [Citation35]. In addition, even though the WAnT is a short test with a low contribution of the aerobic system [Citation37], the role of an altered skeletal muscle oxidative capacity in the production of lactic acid cannot be ruled out [Citation34, Citation35].
Although the WAnT is too short in time, both groups evolved with a significant heavy perception of dyspnea and arm fatigue at the end of the test. However, a higher respiratory rate was observed in COPD patients with a mean reduction of 4% in SpO2. These findings are of clinical relevance and may reinforce the statement that ventilatory dysfunction (inefficiency in maintaining adequate ventilation and oxygenation) is present during an all-out effort in patients in the early stages of the disease [Citation41]. Malaguti et al. [Citation3] investigated the impact of ventilatory constraints on the power-duration relationship during upper limb exercises in a group of no hypoxemic moderate-to-severe COPD patients and showed that critical power was not different from healthy subjects. Although patients with COPD typically experience more ventilatory stress, ventilatory constraints do not limit the sustained upper limbs exercise at the critical power. The lack of significant difference in heart rate between the two groups reflects the absence of any cardiac or systemic vascular effect upon GOLD 1 and 2 COPD patients during the exercise.
The WAnT did not result in any major medical adverse events: two healthy subjects and two COPD patients, after experiencing chest pain/tightness (no EKG changes) or nausea, declined to perform the second test. It is important to mention that our sample comprised elderly subjects, which makes them more vulnerable to possible complications when performing an extremely high effort of short duration.
Our study has some limitations. First, the enrollment of only male subjects was a strategy adopted to avoid a bias as women present different phenotype of COPD [Citation42], ∼30% lower anaerobic capacity and different body composition [Citation43], and different enzymatic and neurological factors [Citation44] compared with males. Second, the inclusion of only GOLD 1 and 2 COPD patients was due to the scarce evidence concerning the upper limb anaerobic metabolism and the generation of power outputs in this population; thus, results may differ from severe COPD patients. Although the sample size can be considered small, the study was sufficiently powered to identify an effect in power output and rate of fatigue between COPD and healthy subjects. Third, modern techniques to evaluate body composition (e.g. dual-energy X-ray absorptiometry, magnetic resonance) were not used which could allow us to specifically measure the upper limb FFM.
Clinical implications and future perspectives
Peripheral muscle weakness is widely known to affect exercise performance in COPD and for this reason, strength training is an important component of the pulmonary rehabilitation program for COPD patients. Based on our findings, COPD patients in early stages of the disease presented impaired anaerobic capacity. This metabolic pathway is important for providing energy to perform activities of daily living that require great effort in a short period of time. According to Slade et al. [Citation4], older adults may rely on anaerobic pathways to complete daily tasks due to age-related declines in aerobic capacity. In this context, strength training should be emphasized in pulmonary rehabilitation programs to improve the anaerobic upper limb muscle capacity of COPD patients in the early stages of the disease. Additionally, as direct measurements of muscle energetics are possible in vivo [Citation45], further studies are needed to know to what extent the upper and lower limb strength training promotes energetic and structural muscle adaptations in COPD patients.
Although aerobic capacity is widely assessed using a variety of methods [Citation46], anaerobic capacity is poorly understood in these patients. Chura et al. [Citation47] demonstrated that the WAnT is a reliable measure of lower limb anaerobic capacity in GOLD 2 COPD patients. Therefore, this study adds to the literature the possibility of using the WAnT and its parameters as a tool to assess the anaerobic upper limb capacity in GOLD 1 and 2 COPD patients.
Conclusions
Compared with healthy subjects, patients with mild to moderate COPD patients presented reduced anaerobic capacity and a faster rate of power output decrease during a maximal intensity Wingate anaerobic test performed with the upper limbs. The Wingate anaerobic test proved to be a valid tool to assess the upper limb anaerobic capacity in these patients. The findings of this study fill an important gap in the literature regarding the anaerobic metabolism of upper limbs of mild to moderate COPD patients. In the future studies should be conducted to investigate whether an intervention could alter the reduced anaerobic capacity of COPD patients and its influence on real-life activities. In this sense, an earlier diagnosis of muscle dysfunction may provide prognostic implications for both prevention and adequate treatment in the future.
Author contributions
VI, GS, and JJ designed the research. VI, AC, EP, LC, EC, MC, and ON collected data. VI, GS, AS and JJ analyzed and interpreted the data, as well as drafted the manuscript. All authors reviewed the manuscript drafts and inputted corrections. All authors approved the final version of the manuscript.
Acknowledgments
The authors also wish to thank the colleagues from the Exercise Physiology Unit (Division Neurophysiology and Exercise Physiology, Federal University of São Paulo (UNIFESP), Brazil) for their collaboration, Mr. Thiago Ribeiro and Mr. Paulo Correia for technical support, and the patients for their effort and enthusiastic cooperation throughout the study.
Disclosure statement
No potential conflict of interest was reported by the author(s).
Additional information
Funding
References
- Gea J, Agusti A, Roca J. Pathophysiology of muscle dysfunction in COPD. J Appl Physiol. 2013;114(9):1222–1234.
- Gea JG, Pasto M, Carmona MA, et al. Metabolic characteristics of the deltoid muscle in patients with chronic obstructive pulmonary disease. Eur Respir J. 2001;17(5):939–945. DOI:10.1183/09031936.01.17509390
- Malaguti C, Dal Corso S, Colucci E, et al. Critical power for the upper limb in patients with chronic obstructive pulmonary disease: a pilot study. Respir Physiol Neurobiol. 2019;270:103280. DOI:10.1016/j.resp.2019.103280
- Slade JM, Miszko TA, Laity JH, et al. Anaerobic power and physical function in strength-trained and non-strength-trained older adults. J Gerontol A Biol Sci Med Sci. 2002;57(3):M168–M172. DOI:10.1093/gerona/57.3.M168
- Adami A, Corvino RB, Calmelat RA, et al. Muscle oxidative capacity is reduced in both upper and lower limbs in COPD. Med Sci Sports Exerc. 2020;52(10):2061–2068. DOI:10.1249/MSS.0000000000002364
- Lima VP, Iamonti VC, Velloso M, et al. Physiological responses to arm activity in individuals with chronic obstructive pulmonary disease compared with healthy controls: a systematic review. J Cardiopulm Rehabil Prev. 2016;36(6):402–412. DOI:10.1097/HCR.0000000000000190
- de Souza GF, Castro AA, Velloso M, et al. Lactic acid levels in patients with chronic obstructive pulmonary disease accomplishing unsupported arm exercises. Chron Respir Dis. 2010;7(2):75–82. DOI:10.1177/1479972310361833
- Colucci M, Cortopassi F, Porto E, et al. Upper limb exercises using varied workloads and their association with dynamic hyperinflation in patients with COPD. Chest. 2010;138(1):39–46. DOI:10.1378/chest.09-2878
- Maltais F, Decramer M, Casaburi R, et al. An official American Thoracic Society/European Respiratory Society statement: update on limb muscle dysfunction in chronic obstructive pulmonary disease. Am J Respir Crit Care Med. 2014;189(9):e15–e62. DOI:10.1164/rccm.201402-0373ST
- Dotan R. The Wingate anaerobic test’s past and future and the compatibility of mechanically versus electro-magnetically braked cycle-ergometers. Eur J Appl Physiol. 2006;98(1):113–116. DOI:10.1007/s00421-006-0251-4
- Bar-Or O. The Wingate anaerobic test. An update on methodology, reliability and validity. Sports Med. 1987;4(6):381–394. DOI:10.2165/00007256-198704060-00001
- Beneke R, Pollmann C, Bleif I, et al. How anaerobic is the Wingate anaerobic test for humans? Eur J Appl Physiol. 2002;87(4–5):388–392. DOI:10.1007/s00421-002-0622-4
- Driss T, Vandewalle H. The measurement of maximal (anaerobic) power output on a cycle ergometer: a critical review. Biomed Res Int. 2013;2013:589361. DOI:10.1155/2013/589361
- Balkissoon R. Journal Club—COPD2020 Update. Global initiatiVe for Chronic Obstructive Lung Disease 2020 Report and the Journal of the COPD Foundation Special Edition, Moving to a New Definition for COPD: “COPDGene® 2019”. Chronic Obstr Pulm Dis. 2020;7(1):64–72.
- Graham BL, Steenbruggen I, Miller MR, et al. Standardization of spirometry 2019 update. An official American Thoracic Society and European Respiratory Society technical statement. Am J Respir Crit Care Med. 2019;200(8):e70–e88. DOI:10.1164/rccm.201908-1590ST
- Pereira CA, Sato T, Rodrigues SC. New reference values for forced spirometry in white adults in Brazil. J Bras Pneumol. 2007;33(4):397–406.
- Fletcher CM, Elmes PC, Fairbairn AS, et al. The significance of respiratory symptoms and the diagnosis of chronic bronchitis in a working population. Br Med J. 1959;2(5147):257–266. DOI:10.1136/bmj.2.5147.257
- Frisancho AR. New norms of upper limb fat and muscle areas for assessment of nutritional status. Am J Clin Nutr. 1981;34(11):2540–2545. DOI:10.1093/ajcn/34.11.2540
- Schols AM, Soeters PB, Dingemans AM, et al. Prevalence and characteristics of nutritional depletion in patients with stable COPD eligible for pulmonary rehabilitation. Am Rev Respir Dis. 1993;147(5):1151–1156. DOI:10.1164/ajrccm/147.5.1151
- Lukaski HC. Methods for the assessment of human body composition: traditional and new. Am J Clin Nutr. 1987;46(4):537–556. DOI:10.1093/ajcn/46.4.537
- Schols AM, Wouters EF, Soeters PB, et al. Body composition by bioelectrical-impedance analysis compared with deuterium dilution and skinfold anthropometry in patients with chronic obstructive pulmonary disease. Am J Clin Nutr. 1991;53(2):421–424. DOI:10.1093/ajcn/53.2.421
- Lukaski HC, Bolonchuk WW, Hall CB, et al. Validation of tetrapolar bioelectrical impedance method to assess human body composition. J Appl Physiol (1985). 1986;60(4):1327–1332. DOI:10.1152/jappl.1986.60.4.1327
- Borg GA. Psychophysical bases of perceived exertion. Med Sci Sports Exerc. 1982;14(5):377–381.
- Jensen-Urstad M, Svedenhag J, Sahlin K. Effect of muscle mass on lactate formation during exercise in humans. Eur J Appl Physiol Occup Physiol. 1994;69(3):189–195. DOI:10.1007/BF01094787
- Jacobs I, Tesch PA, Bar-Or O, et al. Lactate in human skeletal muscle after 10 and 30 s of supramaximal exercise. J Appl Physiol Respir Environ Exerc Physiol. 1983;55(2):365–367. DOI:10.1152/jappl.1983.55.2.365
- Zupan MF, Arata AW, Dawson LH, et al. Wingate anaerobic test peak power and anaerobic capacity classifications for men and women intercollegiate athletes. J Strength Cond Res. 2009;23(9):2598–2604. DOI:10.1519/JSC.0b013e3181b1b21b
- Fritz CO, Morris PE, Richler JJ. Effect size estimates: current use, calculations, and interpretation. J Exp Psychol Gen. 2012;141(1):2–18. DOI:10.1037/a0024338
- Austin PC, Steyerberg EW. The number of subjects per variable required in linear regression analyses. J Clin Epidemiol. 2015;68(6):627–636. DOI:10.1016/j.jclinepi.2014.12.014
- Singh D, Agusti A, Anzueto A, et al. Global strategy for the diagnosis, management, and prevention of chronic obstructive lung disease: the GOLD science committee report 2019. Eur Respir J. 2019;53(5):1900164. DOI:10.1183/13993003.00164-2019
- Gosselink R, Troosters T, Decramer M. Distribution of muscle weakness in patients with stable chronic obstructive pulmonary disease. J Cardiopulm Rehabil. 2000;20(6):353–360.
- Gosselink R, Troosters T, Decramer M. Peripheral muscle weakness contributes to exercise limitation in COPD. Am J Respir Crit Care Med. 1996;153(3):976–980. DOI:10.1164/ajrccm.153.3.8630582
- Yquel RJ, Tessonneau F, Poirier M, et al. Peak anaerobic power in patients with COPD: gender related differences. Eur J Appl Physiol. 2006;97(3):307–315. DOI:10.1007/s00421-006-0181-1
- Bogdanis GC. Effects of physical activity and inactivity on muscle fatigue. Front Physiol. 2012;3:142. DOI:10.3389/fphys.2012.00142
- Jakobsson P, Jorfeldt L, Henriksson J. Metabolic enzyme activity in the quadriceps femoris muscle in patients with severe chronic obstructive pulmonary disease. Am J Respir Crit Care Med. 1995;151(2):374–377. DOI:10.1164/ajrccm.151.2.7842194
- Maltais F, Simard AA, Simard C, et al. Oxidative capacity of the skeletal muscle and lactic acid kinetics during exercise in normal subjects and in patients with COPD. Am J Respir Crit Care Med. 1996;153(1):288–293. DOI:10.1164/ajrccm.153.1.8542131
- Serresse O, Lortie G, Bouchard C, et al. Estimation of the contribution of the various energy systems during maximal work of short duration. Int J Sports Med. 1988;9(6):456–460. DOI:10.1055/s-2007-1025051
- Smith JC, Hill DW. Contribution of energy systems during a Wingate power test. Br J Sports Med. 1991;25(4):196–199. DOI:10.1136/bjsm.25.4.196
- Walter-Kroker A, Kroker A, Mattiucci-Guehlke M, et al. A practical guide to bioelectrical impedance analysis using the example of chronic obstructive pulmonary disease. Nutr J. 2011;10:35.
- Rogers MA, Evans WJ. Changes in skeletal muscle with aging: effects of exercise training. Exerc Sport Sci Rev. 1993;21:65–102.
- Duche P, Ducher G, Lazzer S, et al. Peak power in obese and nonobese adolescents: effects of gender and braking force. Med Sci Sports Exerc. 2002;34(12):2072–2078. DOI:10.1097/00005768-200212000-00031
- Ofir D, Laveneziana P, Webb KA, et al. Mechanisms of dyspnea during cycle exercise in symptomatic patients with GOLD stage I chronic obstructive pulmonary disease. Am J Respir Crit Care Med. 2008;177(6):622–629. DOI:10.1164/rccm.200707-1064OC
- Perez TA, Castillo EG, Ancochea J, et al. Sex differences between women and men with COPD: a new analysis of the 3CIA study. Respiratory Medicine. 2020;171:106105. DOI:10.1016/j.rmed.2020.106105
- Hill DW, Smith JC. Gender difference in anaerobic capacity: role of aerobic contribution. Br J Sports Med. 1993;27(1):45–48. DOI:10.1136/bjsm.27.1.45
- Weber CL, Chia M, Inbar O. Gender differences in anaerobic power of the arms and legs-a scaling issue. Med Sci Sports Exerc. 2006;38(1):129–137. DOI:10.1249/01.mss.0000179902.31527.2c
- Jubrias SA, Esselman PC, Price LB, et al. Large energetic adaptations of elderly muscle to resistance and endurance training. J Appl Physiol. 2001;90(5):1663–1670. DOI:10.1152/jappl.2001.90.5.1663
- Radtke T, Crook S, Kaltsakas G, et al. ERS statement on standardisation of cardiopulmonary exercise testing in chronic lung diseases. Eur Respir Rev. 2019;28(154):180101. DOI:10.1183/16000617.0101-2018
- Chura RL, Marciniuk DD, Clemens R, et al. Test-Retest reliability and physiological responses associated with the steep ramp anaerobic test in patients with COPD. Pulm Med. 2012;2012:653831. DOI:10.1155/2012/653831