Abstract
Junctional Adhesion Molecules (JAMs) are components and regulators of the well-characterized epithelial and endothelial tight junction. Since the molecular components of native fibroblast adherens-like junctions remain poorly described we determined JAM expression profiles in fibroblasts. We found JAM-C on human dermal, lung, and corneal primary fibroblast cultures. Within murine lines, JAM-A was found in L-cells, JAM-C in 3T3 L1 cells, and both JAM-A and JAM-C were co-expressed in NIH 3T3 fibroblasts. In primary dermal fibroblasts, JAM-C concentrated at zipper-like junctions that formed between apposing cells. Dual immunostaining showed JAM-C co-localization with the ZO-1 intracellular scaffolding molecule at cell contacts that ranged from 7 μm to over 25 μm in length. JAM-C also labeled similar zipper-like junctions detected with N-Cadherin and Cadherin-11 antibodies. We conclude that endogenous JAM-C is an integral component of the dermal fibroblast adherens-like junction, and our data extend the expression and potential function of JAMs into mesenchymal tissues.
Keywords:
INTRODUCTION
Fibroblasts are essential for the maintenance of connective tissues and secrete the major interstitial fibrillar collagens and ground substances that constitute the extracellular matrix. They play a fundamental role during wound repair, where they restore tissue continuity and architecture in a process that is highly coordinated with numerous cell types (Martin Citation1997). During wound healing the quiescent fibroblast is activated and adopts the myofibroblast contractile phenotype (Hinz and Gabbiani Citation2003). These cells impart characteristics that are central not only to wound contracture, but also to fibrosis (Desmouliere et al. Citation2005; Eyden Citation2004; Grinnell Citation1994).
Fibroblasts are routinely schematized as isolated cells. Yet, in the gut and in the respiratory tract, fibroblast sub-populations assemble into sheath-like structures, where they directly communicate with each other and the epithelium (Evans et al. Citation1999; Powell et al. Citation1999). Furthermore, networks of condensed fibroblasts constitute the synovial lining, and evidence exists for a reticular web permeating throughout both loose and dense connective tissue (Barland et al. Citation1962; Joyce NC et al. Citation1987; Langevin et al. Citation2004; Novotny and Gommertnovotny Citation1990). A similar paradigm has also recently been described within the heart (Goldsmith et al. Citation2004). Moreover, elaboration of fibroblast intercellular junctions accompanies the fibroblast-myofibroblast differentiation pathway (Hinz and Gabbiani Citation2003). Despite these observations, the molecular nature of the adherens-like cell–cell contacts that characterize fibroblast junctions remains poorly defined (Hinz and Gabbiani Citation2003).
The family of Junctional Adhesion Molecules composed of JAM-A, JAM-B, and JAM-C1Footnote1 belongs to the Immunoglobulin Super-family. Each JAM features an extracellular domain composed of a single V-type and C2-type Ig-fold, a transmembrane domain, and a short intracellular tail of approximately 45 amino acids (Ebnet et al. Citation2004). JAM-A was originally characterized as a tight junction component of endothelial/epithelial cells and a participant in leukocyte transmigration (Martin-Padura et al. Citation1998). The subsequent determination that JAM-B and JAM-C were also junctionally expressed endothelial adhesion molecules (Arrate et al. Citation2001; Aurrand-Lions et al. Citation2001b; Cunningham et al. Citation2000; Liang et al. Citation2002; Palmeri et al. Citation2000) led to a primary focus on defining the roles of JAMs during inflammation ((Chavakis et al. Citation2004; Corada et al. Citation2005; Khandoga et al. Citation2005; Zen et al. Citation2004) and reviewed by (Ebnet et al. Citation2004)).
In more recent years, the participation of JAMs during cell polarity and cell–cell junction biogenesis has emerged as an equally dominant theme (Bazzoni et al. Citation2005; Corada et al. Citation2005; Ebnet et al. Citation2004; Gliki et al. Citation2004; Mandell and Parkos Citation2005). Each JAM possesses an intracellular C-terminal type II PDZ (Post-synaptic density-95/Discs-large/Zonula occludens-1) binding motif, and the propensity of JAMs to bind to the PDZ domains of polarity molecules such as Par3 and PATJ has been instrumental in elucidation of JAM function (Ebnet et al. Citation2004; Gliki et al. Citation2004; Itoh et al. Citation2001). The recombinant intracellular tails of JAMs have also been shown to interact with multiple scaffolding molecules including ZO-1 (Zonula Occludens-1), AF-6/afadin, MUPP1, and PICK-1 (Ebnet et al. Citation2004; Reymond et al. Citation2005).
Numerous ultrastructural studies prove JAM-A resides predominantly at tight junctions (Dobrogowska and Vorbrodt, Citation2004; Liu et al. Citation2000; Martin-Padura et al. Citation1998; Matsuda et al. Citation2004; Vorbrodt and Dobrogowska Citation2003). Likewise, confocal analysis of heterologously expressed JAM-C in kidney epithelial monolayers determined that it too partitions into tight junctions (Aurrand-Lions et al. Citation2001a). Surprisingly, however, endogenous JAM-C was recently observed at desmosomes within gut epithelial cells and at the specialized spermatid-sertoli junction (Gliki et al. Citation2004; Zen et al. Citation2004). Clearly, JAMs are able to assemble into different junctions in diverse tissues.
In this study we describe the differential expression of JAM family members in fibroblasts derived from various anatomic locations. We focus our immuno-localization studies on JAM-C expression in dermal fibroblasts as a model system, and we demonstrate that JAM-C contributes to the molecular composition of the adherens-like junction that defines fibroblast cell–cell contacts. This is evidenced by the co-localization of endogenous JAM-C with native ZO-1, N-cadherin, and Cadherin-11 at these zipper-like adhesive intercellular contact sites.
MATERIALS AND METHODS
Cell Culture
The human dermal and lung primary fibroblast cultures were purchased from Gibco (Invitrogen, Carlsbad, CA) and passaged in RPMI Medium 1640. Human corneal fibroblasts were a kind gift from the laboratory of Alison McDermott (University of Houston, Texas). NIH 3T3 and L-cell mouse fibroblast lines (ATCC) were maintained in Dulbecco's Modified Eagle Medium (DMEM) with 10% FCS.
Flow Cytometry
Cells were trypsinized and labeled with JAM primary antibodies at 1 μg/106 cells. Secondary antibodies were Alexa-488 conjugated goat anti-rabbit or donkey anti-goat (Invitrogen, Carlsbad, CA). For analysis of human cells, we employed our previously generated rabbit polyclonal serum (Arrate et al. Citation2001). For labeling of mouse JAM-A we used a goat anti-mouse JAM-A polyclonal (R&D Systems, Minneapolis, MN), for mouse JAM-B a rabbit anti-mouse JAM-B polyclonal that we had previously generated against the extracellular domain of mouse JAM-B, and for mouse JAM-C we used our rabbit polyclonal that was generated against the human JAM-C antigen that also shows cross-reactivity with the mouse extracellular domain (Arrate et al. Citation2001). Labeled cells were analyzed using a FACScan and Cell Quest software (BD Biosciences, Franklin Lakes, CA).
Quantitative RT-PCR
TaqMan® MGB probes and primers were designed against murine JAMs, JAM-A (Acc # U89915), JAM-B (Acc #AJ291757), JAM-C (Acc #AJ300304) and human JAMs, JAM-A (Acc # AF111713), JAM-B (Acc #NM021219), JAM-C (Acc #AF356518). Total mRNA was made using the RNeasy Mini Kit (Qiagen, Valencia, CA) with on column DNase digestion. Quantitative RT-PCR was performed using the standard curve method. Products were amplified on an ABI 7500 machine and analyzed using SDS v1.2.2 software (Applied Biosystems, Foster City, CA). JAM quantities were standardized against GAPDH.
Immunoprecipitation and Western Blotting
Adherent cells were trypsinized and then biotinylated with 0.5 mg of EZ-Link Sulfo-NHS-Biotin (Pierce, Rockford, IL) in PBS pH 8.0 for 30 min at room temperature as described previously (Cunningham et al. Citation2000). Labeled cells were subsequently lysed using PBS/1% Triton-X 100, and JAM protein immunoprecipitated using polyclonal antibodies (as outlined above) coupled with Protein A sepharose beads (Amersham, Piscataway, NJ). Precipitates were boiled in Laemmli sample buffer/20 mM DTT. Proteins were separated on 4–15% SDS polyacrylamide protein gels, and transferred to Immobilion-P membrane for Western blotting. Detection of biotinylated, immunoprecipitated JAM was performed using streptavidin-HRP and Enhanced Chemiluminescence (ECL).
Adhesion Assays
These assays were essentially performed identically to the flow cytometry experiments, except that the primary antibody was replaced with purified recombinant JAM-Fc. Human JAM-B-Fc was synthesized as a secreted protein in COS cells and purified over protein A as previously described (Cunningham et al. Citation2000). The Fc moiety of our JAM-Fc constructs is mouse IgG2a, and this isotype was used as a control for labeling. Following adhesion for 30 min on ice, cells were washed 3X with PBS-2% FBS and labeled with GAM-Alexa-488 for detection of adhered JAM-B-Fc.
Immunofluorescence
Human dermal fibroblasts were grown on glass cover slips. At 70% confluency the cells were washed twice with PBS and fixed with 1% formaldehyde in PBS (Tousimis, Rockville, MD) for 20 min at room temperature. After washing, the cells were permeabilized for 10 min with 0.1% Triton X-100, and blocked for 30 min with BSA or goat serum in PBS. Cells were incubated with primary antibodies against human JAM-C (Arrate et al. Citation2001), ZO-1 (BD Biosciences, CA or Zymed Laboratories Inc., CA), N-Cadherin (Zymed Laboratories Inc., San Francisco, CA) and Cadherin-11 (R&D, MN). Cells were subsequently washed three times and incubated with anti-mouse, anti-rabbit, or anti-goat secondary antibodies directly labeled with either AlexaFluor-488 or 568 (Invitrogen, Carlsbad, CA). To label actin filaments, fibroblasts were incubated with phalloidin conjugated to Alexa-568 to form an actin-phalloidin complex. Cells were further exposed to TOTO-3 after RNase treatment in order to stain nuclei. Finally, fibroblasts were mounted with Airvol and visualized using a Zeiss 510-meta confocal microscope and a 63× immersion oil objective (Carl Zeiss, Ober kochen, Germany) in the multi-track scanning mode. Excitation wavelengths were set to 488 nm (Argon laser), 543 nm, and 633 nm (HeNe lasers). Emission wavelengths were 505–530 nm, 560-585 nm, and 650–700 nm for Alexa488, Alexa568, and TOTO-3 signal detection, respectively. Single optical slices were set to 0.8 μM and Z-stack slices to 0.38 μM. Collected images were processed using LSM Image VisArt (Carl Zeiss, Inc., Thornwood, NY) and saved in a 48 bit TIFF RGB format.
For line scan analysis, 48 bit RGB Tiff images were converted to 24 bit format and intensity line scan histograms produced using MetaMorph 6.2r4 software (Molecular Devices Corp, Sunnyvale, CA). A scan line encompassing 24 pixels in width was placed across the zipper-like junctions identified with JAM-C, ZO-1, Cadherin-11, and N-Cadherin staining. Average fluorescence intensity versus axial pixel position was plotted for each.
RESULTS
To determine whether Junctional Adhesion Molecules, JAM-A, JAM-B, and JAM-C were expressed on fibroblast cultures, we first performed flow cytometry to obtain a qualitative assessment of JAM expression. shows that JAM-C is expressed on a variety of human primary fibroblast cultures, including human dermal, lung, and corneal fibroblasts. However, the surface expression of both JAM-A and JAM-B is not detectable beyond the preimmune control in these cells. We further examined the well-established mouse NIH 3T3, L-cell, and 3T3 L1 fibroblast lines (). It is of note that L-cells are portrayed as a line devoid of adherens and tight junction transmembrane proteins. In contrast to the human primary cultures, both JAM-A and JAM-C were detected in NIH 3T3 cells. On the other hand, the 3T3 L1 sub-clone primarily expressed JAM-C and L-cells selectively expressed JAM-A.
Figure 1 Analysis of JAM family expression on human fibroblasts. Primary cultures of human dermal (A), lung (B), and corneal (C) fibroblasts were suspended and incubated with rabbit anti-JAM polyclonal antibodies and preimmune serum. Cells were washed and binding of rabbit antibodies was detected by incubation with Alexa-488 conjugated goat anti-rabbit secondary antibodies followed by analysis using flow cytometry. Preimmune serum, filled histogram: *, overlay of histogram traces for JAM-A and JAM-B; JAM-C histogram shifted to the right in each panel shows expression beyond background. Traces are representative of one experiment for corneal fibroblasts and three experiments for dermal and lung fibroblasts.
Figure 2 Analysis of JAM family expression on mouse fibroblast cell lines. Adherent cultures of L-cell (A), NIH 3T3 (B), and 3T3 L1 (C) fibroblast cell lines were suspended and incubated with anti-JAM polyclonal antibodies and preimmune serum. Cells were washed and binding of JAM specific antibodies was detected by incubation with Alexa-488 conjugated goat anti-rabbit (for JAM-B and JAM-C) and donkey anti-goat (for JAM-A) secondary antibodies followed by analysis using flow cytometry. Preimmune serum, filled histogram; *, overlay of histogram traces with preimmune for JAM-B and JAM-C (A), for JAM-B (B) and for JAM-A and JAM-B (C). Traces are representative of three experiments.
To confirm these novel observations, we quantified the levels of mRNA for each JAM family member by using real time PCR. RNA was derived from each of the fibroblasts examined in and , and JAM transcript levels were normalized against GAPDH mRNA. The data from primary cultures and immortalized cell lines are plotted as two separate panels due to variance in housekeeping gene levels between both sources (). It is found that JAM-C mRNA is predominant over JAM-A and JAM-B in the dermal, lung, and corneal primary cultures, and the 3T3 L1 cell line. Murine L-cells only express JAM-A, while JAM-A and JAM-C transcripts co-exist in NIH 3T3 fibroblasts. Generally, the degree of JAM family mRNA expression correlates with the detection of JAM protein by flow cytometry ( and ).
Figure 3 Analysis of JAM transcript levels by quantitative RT-PCR. Total RNA was prepared from each human primary fibroblast (A) and mouse fibroblast (B) cell line, reverse transcribed and analyzed for JAM-A, JAM-B, and JAM-C mRNA expression using Taqman MGB probes. JAM transcript levels are presented as a ratio to the GAPDH housekeeping gene.
With continuing focus on human fibroblasts, and to corroborate the surface expression and molecular mass of JAM-C, we performed a modified immunoprecipitation/Western blotting procedure. Dermal and lung fibroblasts were surface biotinylated as described previously and subjected to immunoprecipitation with primary antibodies specific for each of the three JAM family members. shows that a single biotinylated protein band of approximately 43 kDa (dermal) and 45 kDa (lung) is detected by HRP-streptavidin blotting, only in the JAM-C lane. This corresponds to the estimated size of glycosylated full length JAM-C as determined previously in other cells (Arrate et al. Citation2001; Cunningham et al. Citation2000).
Figure 4 Western blotting of JAM-C in human fibroblasts. Dermal (A) and lung (B) fibroblasts were surface biotinylated, lysed in 1% TX-100 buffer, and subjected to immunoprecipitation. Primary rabbit polyclonal antibodies were: preimmune (lane 1), JAM-A (lane 2), JAM-B (lane 3), and JAM-C (lane 4). JAM-antibody complexes were precipitated with protein-A sepharose, subjected to SDS electrophoresis, transferred to Immobilon-P and biotinylated protein was detected using streptavidin-HRP coupled with enhanced chemiluminescence (ECL). Digital images were directly captured and analyzed using a Biorad ChemiDoc EQ System and QuantityOne software.
Since JAM expression on fibroblasts is a novel observation, and its function in mesenchymal cells is unknown, we proceeded to verify that fibroblast JAM-C acts as an adhesive molecule. For these studies, human dermal fibroblasts were chosen as the model system. Cells were suspended and tested for their ability to bind recombinant JAM-B, an avid heterophilic binding partner for JAM-C (Arrate et al. Citation2001; Cunningham et al. Citation2002; Liang et al. Citation2002). The JAM-B/JAM-C adhesive interaction is readily measurable in suspended cell format, and we quantified the adhesive capacity of JAM-C using flow cytometry. shows that JAM-B adheres efficiently to fibroblast expressed JAM-C, and this interaction is competed out by excess soluble JAM-C.
Figure 5 Adhesive capacity of fibroblast expressed JAM-C. Primary cultures of human dermal fibroblasts were suspended and incubated with recombinant soluble JAM-B-Fc ectodomain in the absence, or presence (*) of competing soluble JAM-C ectodomains that lacked an Fc fusion (open histograms). To control for any JAM-B-Fc background adhesion, fibroblasts were incubated with an Fc control (filled histogram). Cells were washed and binding of Fc was detected by incubation with Alexa-488 conjugated goat anti-mouse secondary antibodies followed by analysis using flow cytometry. Graphical inlay depicts the mean fluorescence intensity (MFI) for each condition ∀ SEM, n = 3.
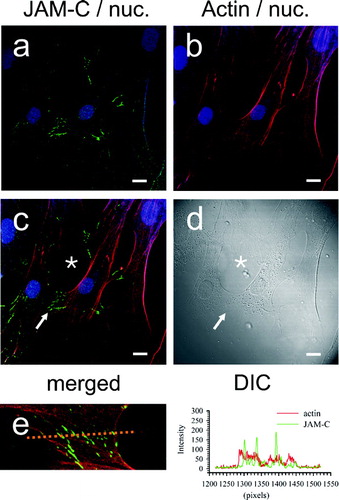
In polarized endothelial and epithelial cell monolayers, JAM-C clusters at discrete sites of cell–cell contact, and it is becoming increasingly apparent that JAMs participate in cell junction assembly (Ebnet et al. Citation2004; Zen et al. Citation2004). In order to analyze JAM-C topography within fibroblasts we performed immunolocalization of this molecule in sub-confluent dermal fibroblast cultures. shows quite strikingly that JAM-C concentrates along membrane processes that have established contact between adjacent cells (, , arrow). JAM-C staining was confined to zipper-like stripes of varied length at the cell–cell contact zone, ranging between 3–10 μm. Of significance, filipodial extensions that had not yet made contact between cells, as evidenced by the DIC image (, asterisk) did not exhibit JAM-C staining (, asterisk). Intercellular contacts were not stained with preimmune antibody (, , arrow). To further investigate a structural role for JAM-C in cell–cell adhesive coupling, JAM-C was immunolocalized in relation to the cellular actin cytoskeleton that was labeled with Alexa-568-conjugated phalloidin. As shown in , JAM-C was confined to intercellular contact sites (panel a) in areas where the elongated actin cytoskeleton extended close to and below areas of membrane to membrane contact (panel b). Overlay of JAM-C and actin staining () showed that actin fibers were closely apposed to the zipper-like pattern of JAM-C (arrow), but did not co-localize (as defined by the lack of yellow signal due to red/green channel spectral coincidence). Furthermore, in areas of non-apposed membrane (*, panel C), JAM-C was absent at the termini of actin bundles extending below the membrane. Differential interference contrast (DIC) was used to confirm the limits of the cellular processes (arrow, *, panel D). Intensity line scan analysis (panel E, broken line and histogram) of the zipper-like junction (panel C, arrow) did not show a correlation between JAM-C and actin staining patterns.
Figure 6 Immunofluorescence of JAM-C in adherent human dermal fibroblast cultures. Fibroblasts were fixed, blocked, and then stained for JAM-C or control (preimmune) using rabbit polyclonal antibodies followed by goat anti-rabbit Alexa-488. Nuclei were stained with TOTO-3 and RNase treatment was used to reduce cytoplasmic staining. Nuclei are blue in all panels. A, JAM-C staining (green); (→) JAM-C concentrated at cell–cell contacts; (*) JAM-C absent from exploratory filipodia. B, corresponding DIC image of panel a. C, preimmune antibody staining (green). (→), lack of preimmune staining at cell–cell contacts. D, corresponding DIC image of panel c. (→), cell–cell contacts. Images were analyzed using Zeiss LSM Image Examiner™ software. All panels were collected and displayed utilizing identical signal detection/gain settings. Scale bars, 10 μm.
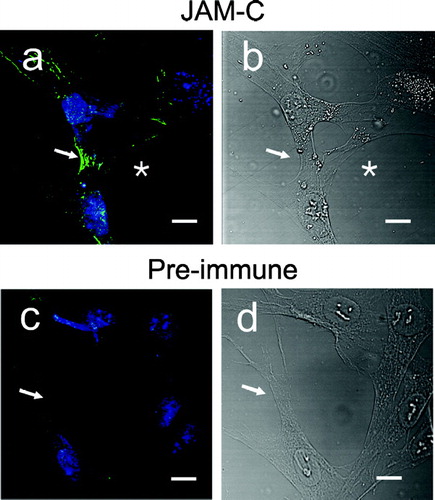
Figure 7 JAM-C topography in dermal fibroblasts in relation to the actin cytoskeleton. Staining for JAM-C protein was achieved using polyclonal antibodies and nuclei detected using TOTO-3, as for . For visualization of the actin cytoskeleton, the actin filaments were labeled with Alexa-568 conjugated phalloidin. Nuclei are blue in all panels. A, JAM-C, detected with Alexa-488 conjugated secondary (green); B, actin staining (red); C, merged JAM-C and actin images; (→) JAM-C at cell–cell contacts; (*) JAM-C absence from the “free” termini of actin filaments. D, corresponding DIC image. E, line scan through zipper junctions and corresponding histogram. Images were analyzed using Zeiss LSM Image Examiner™ software. All panels were collected and displayed utilizing identical signal detection/gain settings. Scale bars, 10 μm.
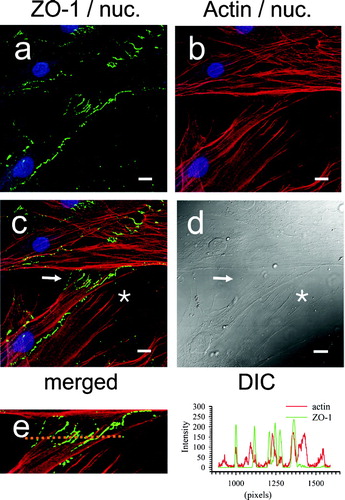
Although fibroblasts do not exhibit tight junctions, cell–cell contacts with molecular characteristics of adherens junctions are discernable. The intracellular ZO-1 scaffolding molecule is expressed within dermal fibroblasts and is found at cadherin based junctions of rat 3Y1 fibroblasts (Howarth et al. Citation1992; Itoh et al. Citation1993). It is known that JAM-C co-localizes with ZO-1 at endothelial tight junctions, and recombinant expressed JAM-C is able to actively recruit ZO-1 to cell–cell contacts in transfected cells (Ebnet et al. Citation2003). Therefore we sought to elucidate ZO-1 topography in dermal fibroblast cultures. (panels a and b) clearly shows that ZO-1 is primarily restricted to sites of cell–cell contact, where it decorates both punctate (panel A, broken arrow) and zipper-like junctions (panel A, closed arrow). The lengths of ZO-1 intercellular bridges at punctate cell contacts measured around 1.5 μm, whereas at zipper junctions staining was elongated to as much as 15 μm (right and central fibroblast). Substitution of ZO-1 antibody with an isotype control results in a low level of general non-specific background staining (, ). shows that similar to JAM-C, ZO-1 (panel A) is not found to any significant extent at the end of actin bundles (panel B) that do not feed into sites of cell–cell contact (panel C, asterisk). Differential interference contrast (DIC) was used to confirm the limits of the cellular processes (panel D). At sites of intercellular contact, close apposition of ZO-1 staining with the termini of actin bundles (panel C, arrow) was observed in a pattern identical to JAM-C. Under the growth and plating conditions used in these experiments, ZO-1 does not show spectral coincidence with actin, and line scan analysis shows little overlap (panel E, and histogram).
Figure 8 Immunofluorescence of ZO-1 in adherent human dermal fibroblast cultures. Fibroblasts were fixed, blocked, and then stained for ZO-1 using mouse monoclonal antibody, followed by goat anti-mouse Alexa-488. Nuclei (blue) were highlighted by TOTO-3 in all panels. A, ZO-1 (green) staining. (→) ZO-1 at zipper cell-cell contacts. (broken →) ZO-1 at punctate cell–cell contacts. B, corresponding DIC image of panel A. C, isotype antibody control staining (green). D, corresponding DIC image of panel C. Images were analyzed using Zeiss LSM Image Examiner™ software. All panels were collected and displayed utilizing identical signal detection/gain settings. Scale bars, 10 μm.
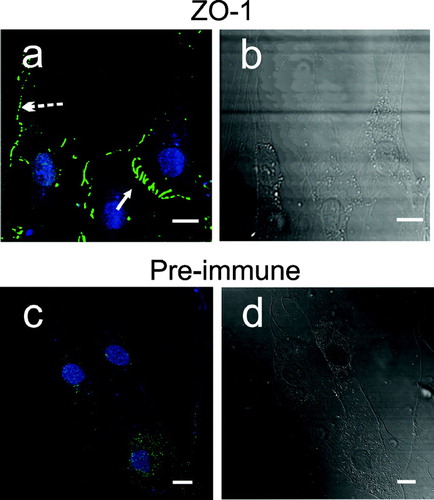
Figure 9 ZO-1 topography in dermal fibroblasts in relation to the actin cytoskeleton. Staining for ZO-1 was achieved using monoclonal anti-ZO-1 antibody and nuclei were detected using TOTO-3, as for . Actin filaments were visualized using phalloidin-568. Nuclei are blue in all panels. A, ZO-1 staining (green). B, actin staining (red). C, merged ZO-1 and actin images; (→) ZO-1 staining at cell–cell contacts; (*) ZO-1 absence from the “free” termini of actin filaments in non-contacting membranes. D, corresponding DIC image. E, line scan through zipper junctions and corresponding histogram. Images were analyzed using Zeiss LSM Image Examiner™ software. All panels were collected and displayed utilizing identical signal detection/gain settings. Scale bars, 10 μm.
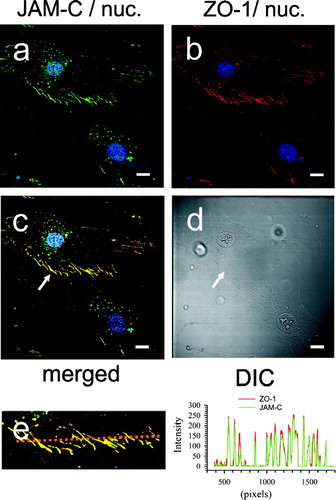
To confirm the topographical relationship between JAM-C and ZO-1 we next performed co-localization studies. As predicted, , , shows that ZO-1 is perfectly aligned with JAM-C (panel C, arrow) in long processes that form bridges between the cells (panel D, arrow). The lengths of these intercellular bridges ranged from 7 μm to over 25 μm. Of note, similar lengths of zipper junction staining have been described as characteristic of the transition from the fibroblast to the myofibroblast phenotype. When pixel intensity measurements were made along a 125 μm line bisecting the zipper junction in panel C, complete overlap of the red and green channel intensity occurred at bridges where peak JAM-C staining correlated with peak ZO-1 staining (panel E, and histogram).
Figure 10 Co-localization of JAM-C with ZO-1 in adherent human dermal fibroblast cultures. Fibroblasts were fixed, blocked, and then stained for both JAM-C (green) and ZO-1 (red) and using rabbit polyclonal anti-JAM-C antibodies and mouse monoclonal anti-ZO-1 as described in , , , . Nuclei are blue in all panels. A, JAM-C staining (green). B, ZO-1 staining (red). C, merged images from panels A and B. (→) Yellow indicates areas of JAM-C/ZO-1 co-localization. D, corresponding DIC image. E, A measurement line (upper image) bisecting the cell zipper junction of panel C was used to construct a JAM-C (green) and ZO-1 (red) intensity histogram (right). Images were analyzed using Zeiss LSM Image Examiner™ software. All panels were collected and displayed utilizing identical signal detection/gain settings. Scale bars, 10 μm.
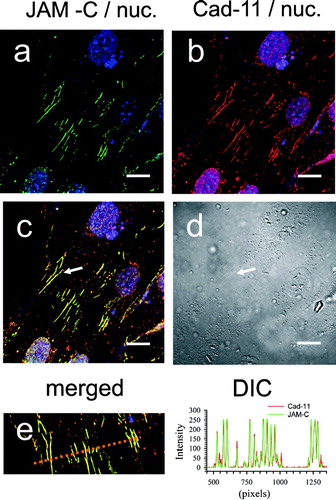
The data thus far strongly indicated that JAM-C was a component of the adherens-like fibroblast cell–cell contact. In order to further confirm and strengthen our observations we next explored Cadherin expression and topography. Fibroblasts may express both N-Cadherin and Cadherin-11, and variations in cadherin composition accompany differences in cell plating densities, and the level of transition between the fibroblast and myofibroblast phenotypes. (panel B) and (panel B) demonstrate that our human dermal fibroblast cultures express both N-Cadherin and Cadherin-11, respectively. As expected, each Cadherin is concentrated at zipper-like fibroblast cell–cell junctions, and this pattern of staining is absent in the sections stained with control antibody (data not shown). Dual labeling of dermal fibroblasts with JAM-C and each Cadherin demonstrates that both family members exhibit spectral overlap at the zipper cell–cell contacts (yellow in panels c). This is even more evident following examination of the line scan analysis (panel e) where coincidence of JAM-C and Cadherin peak intensity staining is clear.
Figure 11 Co-localization of JAM-C with N-Cadherin in adherent human dermal fibroblast cultures. Fibroblasts were fixed, blocked, and then stained for both JAM-C (green) and N-Cadherin (red) using rabbit polyclonal anti-JAM-C antibodies and mouse monoclonal anti-N-Cadherin. Nuclei are blue in all panels. A, JAM-C staining (green). B, N-Cadherin staining (red). C, merged images from panels A and B. (→) Yellow indicates areas of JAM-C/N-Cadherin co-localization. D, corresponding DIC image. E, a line scan bisecting the cell zipper junction of panel C was used to construct a JAM-C (green) and N-Cadherin (red) intensity histogram. Images were analyzed using Zeiss LSM Image Examiner ™ software. All panels were collected and displayed utilizing identical signal detection/gain settings. Scale bars, 10 μm.
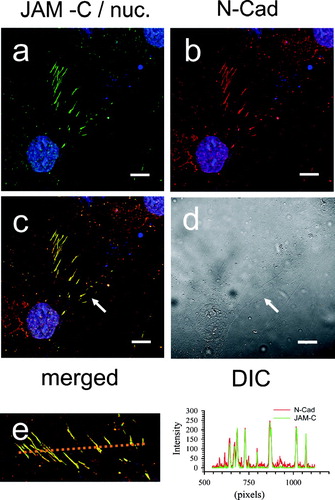
Figure 12 Co-localization of JAM-C with Cadherin-11 in adherent human dermal fibroblast cultures. Fibroblasts were fixed, blocked, and then stained for both JAM-C (green) and Cadherin-11 (red) using rabbit polyclonal and goat polyclonal antibodies respectively. Nuclei are blue in all panels. A, JAM-C staining (green). B, Cadherin-11 staining (red). C, merged images from panels A and B. Yellow indicates areas of JAM-C/Cadherin-11 co-localization. D, corresponding DIC image. E, a line scan bisecting the cell zipper junction of panel C was used to construct a JAM-C (green) and Cadherin-11 (red) intensity histogram. Images were analyzed using Zeiss LSM Image Examiner™ software. All panels were collected and displayed utilizing identical signal detection/gain settings. Scale bars, 10 μm.
DISCUSSION
It is becoming increasingly clear that the influences of the JAM family reach beyond the endothelial/epithelial linings and leukocyte interactions (Gliki et al. Citation2004; Keiper et al. Citation2005; Santoso et al. Citation2005). The data presented within this manuscript describe the novel finding that Junctional Adhesion Molecules are expressed in fibroblasts and demonstrate for the first time that JAM function extends into connective tissue.
JAMs are primarily described as molecular components of the continuous circumferential tight junction that is characteristic of polarized epithelial/endothelial cells. As such, JAM expression in fibroblasts was unexpected. Fibroblasts lack both tight junctions and the classical adherens junctions that are typically continuous belt-like structures. Rather, adjacent fibroblast membranes present with alternating regions of cell–cell contact followed by lengths of membrane where no contact is established. At the contact, intercellular bridges establish cell–cell adhesion, and actin filaments run parallel within these intercellular processes; the overall architecture gives the appearance of stripe-like junctions (Hinz et al. Citation2004; Yonemura et al. Citation1995). JAM-C staining very clearly exhibits a pattern consistent with its localization within intercellular bridges supporting the hypothesis that JAMs are integral to fibroblast adherens-like junctions. Our data lead us to predict that the JAM family may play a wider role in the establishment and/or maintenance and function of many different types of cell–cell contacts. In this regard, JAM-C has recently been demonstrated to serve a critical function at the spermatid–sertoli cell junction (Gliki et al. Citation2004).
Biochemical assays have previously demonstrated that the recombinant intracellular PDZ binding motif of JAM-C can bind ZO-1, and both JAM-C and JAM-A co-localize with ZO-1 at tight junctions within other cellular systems. However, ZO-1 is not restricted to tight junctions. It is also observed at the adherens junctions of polarized cells and has been described at the adherens-like junctions of immortalized fibroblast cell lines (Itoh et al. Citation1993; Itoh et al. Citation1997). Data for native ZO-1 localization in primary fibroblasts are scarce. In this study we show that JAM-C displays an intimate spatial relationship with ZO-1 at zipper-like cell–cell contacts and conclude that both endogenously expressed JAM-C and ZO-1 are components of the native dermal fibroblast adherens-like junction. The lack of spectral coincidence for ZO-1/actin either reflects additional protein linkages between these proteins or technical limitations at the level of light microscopy.
Most recently it has been demonstrated that Cadherin-11 is a component of human dermal fibroblast adherens-like junctions (Ehrlich et al. Citation2006). Here we show that fibroblast zipper-like cell– cell contacts express both N-Cadherin and Cadherin-11 in such close proximity to JAM-C that spectral overlap is achieved. The ability of ZO-1 to bind α-catenin, that in turn engages cadherins, leads us to propose the likely existence of a multimeric complex at these intercellular sites that is composed at least of JAM-C/ZO-1/catenin/cadherin (Gumbiner, Citation2005; Itoh et al. Citation1997). It is envisaged that direct linkage of this complex to the actin cytoskeleton could be mediated by either ZO-1 and/or catenin (Gumbiner, Citation2005; Itoh et al. Citation1997).
Dynamic regulation of fibroblast cell junctions, and a switch from N-Cadherin to Cadherin-11 expression accompanies progression along the fibroblast-protomyofibroblast-myofibroblast differentiation pathway (Hinz et al. Citation2004; Van Hoorde et al. Citation1999). It has been demonstrated that plating of fibroblasts at low density on inflexible supports in 2D culture is sufficient to induce transition to the protomyofibroblast/myofibroblast phenotype (Desmouliere et al. Citation2005; Masur et al. Citation1996). In more quiescent fibroblasts, junctions range from 2–5 μm while transition to the myofibroblast results in junction lengthening to 20–30 μm (Hinz et al. Citation2004). The span of JAM-C and ZO-1 staining within cell–cell contacts of our primary dermal fibroblast cultures ranged from 1.5 μm in puncta to over 25 μm long stripes, which is highly suggestive of JAM-C participation in both quiescent fibroblasts and myofibroblast intercellular contacts. Confirming the observations with JAM-C and ZO-1, we show that cell–cell structures labeled with JAM-C antibodies also label with N-Cadherin and Cadherin-11 antibodies, well-characterized integral membrane components of adherens junctions.
In comparison to epithelial and endothelial cell–cell contacts, relatively little is known about the molecular composition and precise function of fibroblast intercellular junctions. It is entirely conceivable that fibroblast cell junction composition/function varies with anatomical location, consistent with the evolving theme of fibroblast heterogeneity and topographical differentiation (reviewed by (Eyden, Citation2004; Fries et al. Citation1994; Sorrell and Caplan, Citation2004; Yamaguchi et al. Citation2005)). This paradigm of junctional heterogeneity at both the molecular and functional level has long been acknowledged for both endothelial and epithelial cells (Van Itallie and Anderson, Citation2004). Furthermore, it is documented that JAMs are differentially transcribed within various epithelia and within the endothelium of different vascular beds (Aurrand-Lions et al. Citation2001b; Liang et al. Citation2002; Martin-Padura et al. Citation1998; Palmeri et al. Citation2000; Zen et al. Citation2004). Based upon our current studies documenting differential JAM expression within fibroblasts, we propose that diversity exists for fibroblast intercellular contacts. However, we recognize that our data may also be explained by JAM expression differences between human primary cells and murine fibroblast cell lines. The effect of junctional heterogeneity upon the strength and signaling capacity of fibroblast intercellular contacts remains to be determined.
To conclude, our current discoveries regarding the differential expression of Junctional Adhesion Molecules within fibroblasts raises new hypotheses concerning the role of JAMs in connective tissue physiology and pathology. Supporting a likely functional role we demonstrate here that fibroblast JAM-C can engage with adhesive counter-receptors and assemble into cell–cell contacts in close proximity not only with junctional ZO-1, but also N-Cadherin and Cadherin-11. We predict that JAMs will have an impact upon the establishment of fibroblast intercellular junctions in a manner parallel to their function in other cells (Ebnet et al. Citation2004). Fibroblast intercellular contacts are fundamental to the wound healing process, and we identify JAMs as candidate regulators of fibroblast adherens-like junctions.
ACKNOWLEDGMENTS
We would like to thank Ahmad Tawil and Linda Wible for technical support. The human corneal fibroblasts were a kind gift from the laboratory of Alison McDermott, University of Houston, College of Optometry, Texas. This work was funded by DK59550 (APM) and DK64233 (CWS) and USDA 6250-51000-04.
Notes
1For a recent review of current and past JAM nomenclature see Mandell and Parkos 2005; Muller 2003. NCBI databases maintain the original HUGO nomenclature, and to help the reader navigate these sites we provide the following: F11R/JAM/JAM1 (JAM-A), Ref Acc. No. NM_016946. ii) JAM2 (JAM-B), Ref Acc No. NM_021219. iii) JAM3 (JAM-C), Ref Acc No. NM_032801.
REFERENCES
- Arrate M P, Rodriguez J M, Tran T M, Brock T A, Cunningham S A. Cloning of human junctional adhesion molecule 3 (JAM3) and its identification as the JAM2 counter-receptor. J Biol Chem 2001; 276: 45826–45832, [INFOTRIEVE], [CSA]
- Aurrand-Lions M, Duncan L, Ballestrem C, Imhof B A. JAM-2, a novel immunoglobulin superfamily molecule, expressed by endothelial and lymphatic cells. J Biol Chem 2001a; 276: 2733–2741, [INFOTRIEVE], [CSA], [CROSSREF]
- Aurrand-Lions M, Johnson-Leger C, Wong C, Du P L, Imhof B A. Heterogeneity of endothelial junctions is reflected by differential expression and specific subcellular localization of the three JAM family members. Blood 2001b; 98: 3699–3707, [INFOTRIEVE], [CSA], [CROSSREF]
- Barland P, Novikoff A B, Hamerman D. Electron microscopy of the human synovial membrane. J Cell Biol 1962; 14: 207–220, [INFOTRIEVE], [CSA], [CROSSREF]
- Bazzoni G, Tonetti P, Manzi L, Cera M R, Balconi G, Dejana E. Expression of junctional adhesion molecule-A prevents spontaneous and random motility. J Cell Sci 2005; 118: 623–632, [INFOTRIEVE], [CSA], [CROSSREF]
- Chavakis T, Keiper T, Matz-Westphal R, Hersemeyer K, Sachs U J, Nawroth P P, Preissner K T, Santoso S. The junctional adhesion molecule-C promotes neutrophil transendothelial migration in vitro and in vivo. J Biol Chem 2004; 279: 55602–55608, [INFOTRIEVE], [CSA], [CROSSREF]
- Corada M, Chimenti S, Cera M R, Vinci M, Salio M, Fiordaliso F, De Angelis N, Villa A, Bossi M, Staszewsky L I, Vecchi A, Parazzoli D, Motoike T, Latini R, Dejana E. Junctional adhesion molecule-A-deficient polyrnorphonuclear cells show reduced diapedesis in peritonitis and heart ischemia-reperfusion injury. Proc Natl Acad Sci 2005; 102: 10634–10639, [INFOTRIEVE], [CSA], [CROSSREF]
- Cunningham S A, Arrate M P, Rodriguez J M, Bjercke R J, Vanderslice P, Morris A P, Brock T A. A novel protein with homology to the junctional adhesion molecule. Characterization of leukocyte interactions. J Biol Chem 2000; 275: 34750–34756, [INFOTRIEVE], [CSA], [CROSSREF]
- Cunningham S A, Rodriguez J M, Arrate M P, Tran T M, Brock T A. JAM2 Interacts with a 4b 1. Facilitation by JAM3. J Biol Chem 2002; 277: 27589–27592, [INFOTRIEVE], [CSA], [CROSSREF]
- Desmouliere A, Chaponnier C, Gabbiani G. Tissue repair, contraction, and the myofibroblast. Wound Repair Reg 2005; 13: 7–12, [CSA], [CROSSREF]
- Dobrogowska D HVorbrodt A W. Immunogold localization of tight junctional proteins in normal and osmotically-affected rat blood-brain barrier. J Mol Hist 2004; 35: 529–539, [CSA], [CROSSREF]
- Ebnet K, Aurrand-Lions M, Kuhn A, Kiefer F, Butz S, Zander K, Brickwedde M KMZ, Suzuki A, Imhof B A, Vestweber D. The junctional adhesion molecule (JAM) family members JAM- 2 and JAM-3 associate with the cell polarity protein PAR-3: A possible role for JAMs in endothelial cell polarity. J Cell Sci 2003; 116: 3879–3891, [INFOTRIEVE], [CSA], [CROSSREF]
- Ebnet K, Suzuki A, Horikoshi Y, Hirose T, Meyer Zu, Brickwedde M K, Ohno S, Vestweber D. The cell polarity protein ASIP/PAR-3 directly associates with junctional adhesion molecule (JAM). EMBO J 2001; 20: 3738–3748, [INFOTRIEVE], [CSA], [CROSSREF]
- Ebnet K, Suzuki A, Ohno S, Vestweber D. Junctional adhesion molecules (JAMs): More molecules with dual functions?. J Cell Sci 2004; 117: 19–29, [INFOTRIEVE], [CSA], [CROSSREF]
- Ehrlich H P, Allison G M, Leggett M. The myofibroblast, cadherin, alpha smooth muscle actin and the collagen effect. Cell Biochem Funct 2006; 24: 63–70, [INFOTRIEVE], [CSA], [CROSSREF]
- Evans M J, Van Winkle L S, Fanucchi M V, Plopper C G. The attenuated fibroblast sheath of the respiratory tract epithelial-mesenchymal trophic unit. Am J Respir Cell Mol Biol 1999; 21: 655–657, [INFOTRIEVE], [CSA]
- Eyden B. Fibroblast phenotype plasticity. Relevance for understanding heterogeneity in “fibroblastic” tumors. Ultrastruct Pathol 2004; 28: 307–319, [INFOTRIEVE], [CSA], [CROSSREF]
- Fries K M, Blieden T, Looney R J, Sempowski G D, Silvera M R, Willis R A, Phipps R P. Evidence of fibroblast heterogeneity and the role of fibroblast subpopulations in fibrosis. Clin Immunol Immunopathol 1994; 72: 283–292, [INFOTRIEVE], [CSA], [CROSSREF]
- Gliki G, Ebnet K, Aurrand-Lions M, Imhof B A, Adams R H. Spermatid differentiation requires the assembly of a cell polarity complex downstream of junctional adhesion molecule-C. Nature 2004; 431: 320–324, [INFOTRIEVE], [CSA], [CROSSREF]
- Goldsmith E C, Hoffman A, Morales M O, Potts J D, Price R L, McFadden A, Rice M, Borg T K. Organization of fibroblasts in the heart. Dev Dyn 2004; 230: 787–794, [INFOTRIEVE], [CSA], [CROSSREF]
- Grinnell F. Fibroblasts, myofibroblasts, and wound contraction. J Cell Biol 1994; 124: 401–404, [INFOTRIEVE], [CSA], [CROSSREF]
- Gumbiner B M. Regulation of cadherin-mediated adhesion in morphogenesis. Nat Rev Mol Cell Biol 2005; 6: 622–634, [INFOTRIEVE], [CSA], [CROSSREF]
- Hinz B, Gabbiani G. Cell-matrix, and cell-cell contacts of myofibroblasts: Role in connective tissue remodeling. Thromb Haemost 2003; 90: 993–1002, [INFOTRIEVE], [CSA]
- Hinz B, Pittet P, Smith-Clerc J, Chaponnier C, Meister J J. Myofibroblast development is characterized by specific cell-cell adherens junctions. Mol Biol Cell 2004; 15: 4310–4320, [INFOTRIEVE], [CSA], [CROSSREF]
- Howarth A G, Hughes M R, Stevenson B R. Detection of the tight junction-associated protein Zo-1 in astrocytes and other nonepithelial cell-types. Am J Physiol 1992; 262: C461–C469, [INFOTRIEVE], [CSA]
- Itoh M, Nagafuchi A, Moroi S, Tsukita S. Involvement of ZO-1 in cadherin-based cell adhesion through its direct binding to or catenin and actin filaments. J Cell Biol 1997; 138: 181–192, [INFOTRIEVE], [CSA], [CROSSREF]
- Itoh M, Nagafuchi A, Yonemura S, Kitaniyasuda T, Tsukita S, Tsukita S. The 220-Kd protein colocalizing with cadherins in nonepithelial cells is identical to Zo-1, a tight junction associated protein in epithelial-cells - cDNA cloning and immunoelectron microscopy. J Cell Biol 1993; 121: 491–502, [INFOTRIEVE], [CSA], [CROSSREF]
- Itoh M, Sasaki H, Furuse M, Ozaki H, Kita T, Tsukita S. Junctional adhesion molecule (JAM) binds to PAR-3: A possible mechanism for the recruitment of PAR-3 to tight junctions. J Cell Biol 2001; 154: 491–497, [INFOTRIEVE], [CSA], [CROSSREF]
- Joyce N C, Haire M F, Palade G E. Morphologic and biochemical evidence for a contractile cell network within the rat intestinal mucosa. Gastroenterology 1987; 92: 68–81, [INFOTRIEVE], [CSA]
- Keiper T, Al Fakhri N, Chavakis E, Athanasopoulos A N, Isermann B, Herzog S, Saffrich R, Hersemeyer K, Bohle R M, Haendeler J, Preissner K T, Santoso S, Chavakis T. The role of junctional adhesion molecule-C (JAM-C) in oxidized LDL-mediated leukocyte recruitment. Faseb J 2005; 19: 2078–2080, [INFOTRIEVE], [CSA]
- Khandoga A, Kessler J S, Meissner H, Hanschen M, Corada M, Motoike T, Enders G, Dejana E, Krombach F. Junctional adhesion molecule-A deficiency increases hepatic ischemia- reperfusion injury despite reduction of neutrophil transendothelial migration. Blood 2005; 106: 725–733, [INFOTRIEVE], [CSA], [CROSSREF]
- Langevin H M, Cornbrooks C J, Taatjes D J. Fibroblasts form a body-wide cellular network. Histochem Cell Biol 2004; 122: 7–15, [INFOTRIEVE], [CSA], [CROSSREF]
- Liang T W, Chiu H H, Gurney A, Sidle A, Tumas D B, Schow P, Foster J, Klassen T, Dennis K, DeMarco R A, Pham T, Frantz G, Fong S. Vascular endothelial-junctional adhesion molecule (VE-JAM)/JAM 2 interacts with T, NK, and dendritic cells through JAM 3. J Immunol 2002; 168: 1618–1626, [INFOTRIEVE], [CSA]
- Liu Y, Nusrat A, Schnell F J, Reaves T A, Walsh S, Pochet M, Parkos C A. Human junction adhesion molecule regulates tight junction resealing in epithelia. J Cell Sci 2000; 113: 2363–2374, [INFOTRIEVE], [CSA]
- Mandell K J, Parkos C A. The JAM family of proteins. Adv Drug Del Rev. 2005; 57: 857–867, [CSA], [CROSSREF]
- Martin P. Wound healing–Aiming for perfect skin regeneration. Science 1997; 276: 75–81, [INFOTRIEVE], [CSA], [CROSSREF]
- Martin-Padura I, Lostaglio S, Schneemann M, Williams L, Romano M, Fruscella P, Panzeri C, Stoppacciaro A, Ruco L, Villa A, Simmons D, Dejana E. Junctional adhesion molecule, a novel member of the immunoglobulin superfamily that distributes at intercellular junctions and modulates monocyte transmigration. J Cell Biol 1998; 142: 117–127, [INFOTRIEVE], [CSA], [CROSSREF]
- Masur S K, Dewal H S, Dinh T T, Erenburg I, Petridou S. Myofibroblasts differentiate from fibroblasts when plated at low density. Proc Natl Acad Sci 1996; 93: 4219–4223, [INFOTRIEVE], [CSA], [CROSSREF]
- Matsuda M, Kubo A, Furuse M, Tsukita S. A peculiar internalization of claudins, tight junction-specific adhesion molecules, during the intercellular movement of epithelial cells. J Cell Sci 2004; 117: 1247–1257, [INFOTRIEVE], [CSA], [CROSSREF]
- Muller W A. Leukocyte-endothelial-cell interactions in leukocyte transmigration and the inflammatory response. Trends Immunol 2003; 24: 327–334, [INFOTRIEVE], [CSA], [CROSSREF]
- Novotny G EK, Gommertnovotny E. A simple procedure for demonstrating the overall morphology of fibroblasts in routine histological preparations of adult tissues, using silver impregnation. J Microsc 1990; 159: 99–107, [INFOTRIEVE], [CSA]
- Palmeri D, van Zante A, Huang C C, Hemmerich S, Rosen S D. Vascular endothelial junction-associated molecule, a novel member of the immunoglobulin superfamily, is localized to intercellular boundaries of endothelial cells. J Biol Chem 2000; 275: 19139–19145, [INFOTRIEVE], [CSA], [CROSSREF]
- Powell D W, Mifflin R C, Valentich J D, Crowe S E, Saada J I, West A B. Myofibroblasts. II. Intestinal subepithelial myofibroblasts. Am J Physiol Cell Physiol 1999; 277: C183–C201, [CSA]
- Reymond N, Garrido-Urbani S, Borg J P, Dubreuil P, Lopez M. PICK-1: A scaffold protein that interacts with Nectins and JAMs at cell junctions. FEBS Lett 2005; 579: 2243–2249, [INFOTRIEVE], [CSA], [CROSSREF]
- Santoso S, Orlova V V, Song K, Sachs U J, Andrei-Selmer C L, Chavakis T. The homophilic binding of junctional adhesion molecule-C mediates tumor cell-endothelial cell interactions. J Biol Chem 2005; 280: 36326–36333, [INFOTRIEVE], [CSA], [CROSSREF]
- Sorrell J M, Caplan A I. Fibroblast heterogeneity: More than skin deep. J Cell Sci 2004; 117: 667–675, [INFOTRIEVE], [CSA], [CROSSREF]
- Van Hoorde L, Braet K, Mareel M. The N-cadherin/catenin complex in colon fibroblasts and myofibroblasts. Cell Adh Comm 1999; 7: 139–150, [CSA]
- Van Itallie C M, Anderson J M. The molecular physiology of tight junction pores. Physiol 2004; 19: 331–338, [CSA], [CROSSREF]
- Vorbrodt A W, Dobrogowska D H. Molecular anatomy of intercellular junctions in brain endothelial and epithelial barriers: Electron microscopist's view. Brain Res Rev 2003; 42: 221–242, [INFOTRIEVE], [CSA], [CROSSREF]
- Yamaguchi Y, Hearing V J, Itami S, Yoshikawa K, Katayama I. Mesenchymal-epithelial interactions in the skin: Aiming for site-specific tissue regeneration. J Dermatol Sci 2005; 40: 1–9, [INFOTRIEVE], [CSA], [CROSSREF]
- Yonemura S, Itoh M, Nagafuchi A, Tsukita S. Cell-to-cell adherens junction formation and actin filament organization—Similarities and differences between non-polarized fibroblasts and polarized epithelial-cells. J Cell Sci 1995; 108: 127–142, [INFOTRIEVE], [CSA]
- Zen K, Babbin B A, Liu Y, Whelan J B, Nusrat A, Parkos C A. JAM-C is a component of desmosomes and a ligand for CD11b/CD18-mediated neutrophil transepithelial migration. Mol Biol Cell 2004; 15: 3926–3937, [INFOTRIEVE], [CSA]